1812
Dependence of PDFF Measurement Accuracy on Location, Resolution, and Field Strength – a Phantom Experiment1Department of Radiology, University of Wisconsin-Madison, Madison, WI, United States, 2Department of Radiology and Nuclear Medicine, Universität zu Lübeck, Lübeck, Germany, 3Calimetrix, Madison, WI, United States, 4Department of Medical Physics, University of Wisconsin-Madison, Madison, WI, United States, 5Department of Biomedical Engineering, University of Wisconsin-Madison, Madison, WI, United States, 6Department of Departments of Electrical & Computer Engineering, University of Wisconsin-Madison, Madison, WI, United States, 7Department of Medicine, University of Wisconsin-Madison, Madison, WI, United States, 8Department of Emergency Medicine, University of Wisconsin-Madison, Madison, WI, United States
Synopsis
Keywords: Quantitative Imaging, Phantoms
The purpose of this work was to determine the spatial dependence of PDFF measurements at both 1.5T and 3.0T in a phantom setting. We showed that bias in CSE-MRI-based PDFF measurements is low when performed in areas not more than 20 cm from the isocenter in any direction. These results have immediate practical relevance for clinical routine, e.g., in prescribing MRI acquisitions for clinical PDFF measurements and for the correct placement of pocket phantoms in the MRI bore when used as quality assurance tools.
Introduction
Accurate quantification of proton density fat fraction (PDFF) in the liver is essential for clinical care of patients with fatty liver disease which is recognized as a global epidemic1,2.Chemical-shift encoded MRI (CSE-MRI) is the state-of-the-art MRI method for noninvasive quantification of PDFF3. Previous results showed that PDFF bias increases with distance from isocenter with bias increasing steeply over 18cm in-plane and over 10cm in the z-direction4. However, this study tested a limited number of z-offsets at 3.0T only. For clinical use, the maximum distance from isocenter in all directions at which PDFF measurements are still accurate needs still to be determined. The purpose of this work was to determine the spatial dependence of PDFF measurements at both 1.5T and 3.0T.
Methods
Phantom: 26 sets of commercially available vials-only pocket PDFF phantoms (PDFF Phantom Pack, Calimetrix, Madison, WI) were stacked to fill the bore (Figure 1A-C). Each pocket phantom set contains 5 vials (each 25x25x91mm) with 0%,10%,20%,30%, and 40% PDFF concentration, respectively, resulting in 130 vials total.Acquisition and Reconstruction: Acquisitions were performed on clinical MRI systems (3.0T SIGNA Premier; 1.5T SIGNA Artist, GE Healthcare, WI, USA) using a 30-channel anterior array receiver coil and a commercial CSE-MRI method (IDEAL IQ, GE Healthcare) for PDFF quantification with 3 different spatial resolutions. (Figure 1D)
Acquisitions were repeated with 9 different z-direction offsets (0cm, ±10cm, ±13cm, ±15cm, ±20cm). Subsequently, the entire phantom setup was rotated 180° around the y-axis and acquisitions repeated to facilitate measurement of different PDFF concentrations at additional locations within the bore. To avoid fat/water swaps, confounder-corrected PDFF maps were reconstructed using a magnitude-based reconstruction where the iterative parameter estimation algorithm is initialized with the initial assumption that PDFF=0%. The confounding effects of T2* decay, spectral complexity of fat and temperature were also corrected5.
PDFF measurements: Regions of interest (ROI, 7.5mm diameter) were placed in the center of all vials using OsiriX (Pixmeo, Switzerland).
Statistics: Absolute bias between the vendor provided true PDFF and the measured PDFF for each ROI were calculated for each vial. Bias between vendor-provided and measured PDFF values was evaluated separately for distance from isocenter in xy-plane, offset from isocenter in z-direction, and absolute difference in x-y-z direction. This was done at both 1.5T and 3.0T and for different spatial resolution, respectively. PDFF bias was plotted as a function of distance from isocenter in-plane, along the z axis and distance in all directions. Results were displayed in scatter plots, boxplots, and Bland Altman-plots.
Results
PDFF measurement bias increased with increasing in-plane distance from isocenter with a steep increase at 20cm (Figure 2). At a cutoff of ≤20cm distance from isocenter in the xy-plane, bias at 1.5T (3.0T) was ≤3.0% in 97% (97%) of vials and ≤2.5% in 93% (94%).PDFF measurement bias increased with increasing offset in the z-direction with a steep increase at 20cm (Figure 3). At ≤15cm offset and within a radius of 10cm around isocenter in the xy-plane, bias at 1.5T (3.0T) was ≤3.0% in 99% (100%) of vials and ≤2.5% in 96% (99%).
At a distance ≤20cm from isocenter in x-y-z direction, bias at 1.5T (3.0T) was ≤3.0% in 99% (98%) of vials and ≤2.5% in 97% (95%), Figure 4.
The cutoff of ≤20cm was independent of spatial resolution and field strength (Figure 5)
Discussion
In this work we investigated the effects of off-isocenter imaging on bias in PDFF measurements using CSE-MRI at 1.5T and 3.0T and for three different spatial resolutions. As expected, bias increased with increasing distance from isocenter. Bias was low up to 20cm in any direction from isocenter and translated into a clinically acceptable PDFF measurement bias of <2.5% in ≥95% of measurements. This finding has two important implications. First, it shows the importance of proper placement of the patient in the MRI bore to maximize effective coverage of the liver when accurate PDFF measurements are to be performed. Second, pocket phantoms should be placed under the patient, centered in the left-right direction close to the liver, as much as possible.The observed off-center imaging bias may be related to several factors. Concomitant gradients are known to affect PDFF estimation, depending on the characteristics of the echo train6. B0 inhomogeneities are naturally accounted for in CSE-MRI, which estimates them in the PDFF estimation. B1 inhomogeneities are generally avoided through the use of low flip angles. Spatially dependent eddy currents or time delays of the gradient may also bias PDFF estimates, although these should be avoided by magnitude-based CSE-MRI fitting.
We note that these results are study-specific and may depend on the specific sequence parameters and hardware.
Conclusion
Bias in CSE-MRI-based PDFF measurements is low when performed in areas less than 20 cm from magnet isocenter. This is relevant for prescribing clinical PDFF measurements and for the positioning of pocket phantoms as quality assurance tools.Acknowledgements
We wish to thank Calimetrix for use of the pocket phantoms for this study. Further, we wish to acknowledge support from the NIH (NIH R01 DK088925, R44EB025729), UW Institute for Clinical and Translational Research, and the Clinical and Translational Science Award of the NCATS/NIH, as well as GE Healthcare who provides research support to the University of Wisconsin. Dr. Oechtering receives funding from the German Research Foundation (OE 746/1-1). Dr. Reeder is the Fred Lee Sr. Endowed Chair of Radiology.
David Rutkowski, PhD, and Jean Brittain, PhD, are employees of Calimetrix LLC. Scott Reeder, MD, PhD, Diego Hernando, PhD, and Jean Brittain, PhD have ownership interests in Calimetrix LLC.
References
1. Loomba R. MRI-Proton Density Fat Fraction Treatment Response Criteria in Nonalcoholic Steatohepatitis. Hepatology 2021;73:881-3.
2. Kanwal F, Shubrook JH, Younossi Z, et al. Preparing for the NASH epidemic: A call to action. Metabolism 2021;122:154822.
3. Starekova J, Zhao R, Colgan TJ, et al. Improved free-breathing liver fat and iron quantification using a 2D chemical shift-encoded MRI with flip angle modulation and motion-corrected averaging. Eur Radiol 2022;32:5458-67.
4. Panagiotopoulos N, Oechtering TH, Rutkowski D, Brittain JH, Hernando D, Reeder SB. Spatial Dependence of PDFF Measurement Bias using Chemical Shift Encoded MRI ISMRM; 2021; virtual.
5. Reeder SB, Cruite I, Hamilton G, Sirlin CB. Quantitative Assessment of Liver Fat with Magnetic Resonance Imaging and Spectroscopy. J Magn Reson Imaging 2011;34:729-49.
6. Colgan TJ, Hernando D, Sharma SD, Reeder SB. The effects of concomitant gradients on chemical shift encoded MRI. Magn Reson Med 2017;78:730-8.
Figures
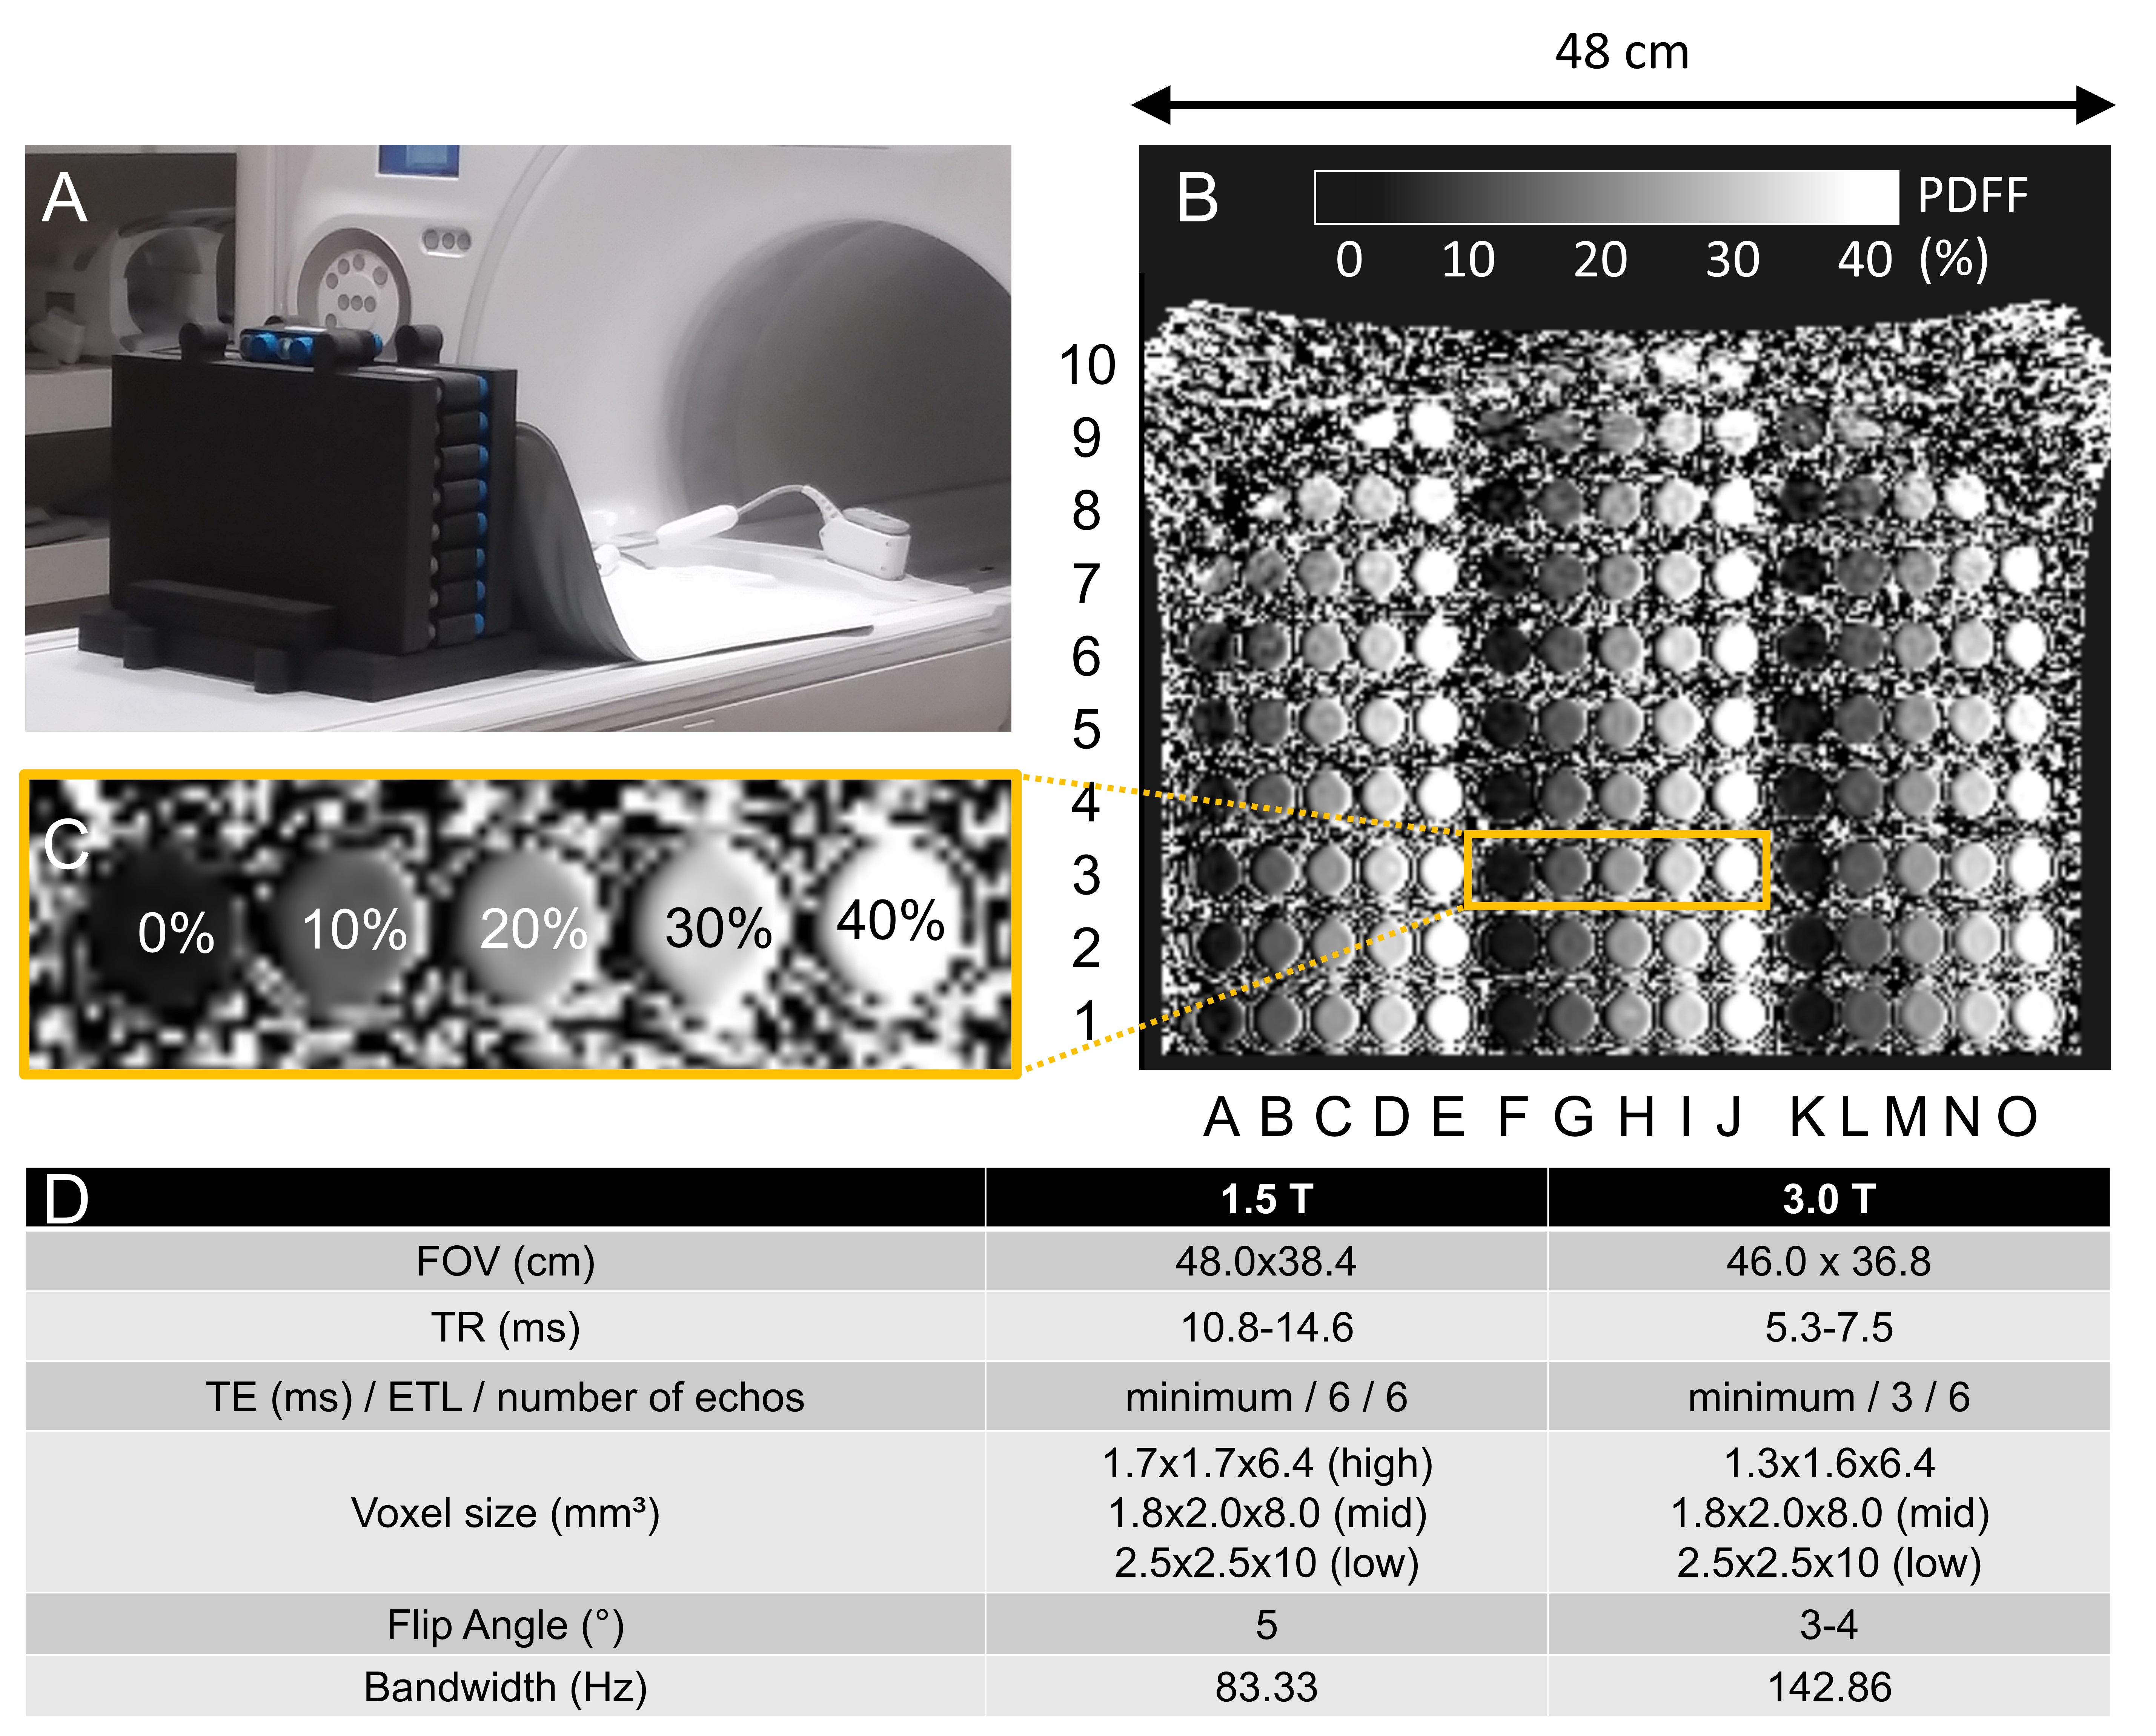
Figure 1: A+B) 26 phantoms were stacked into a foam sleeve to fill most of the bore covering 48x38cm. C) Each phantom contained 5 vials with PDFF values of 0%, 10%, 20%, 30%, and 40%. D) Acquisition parameters.
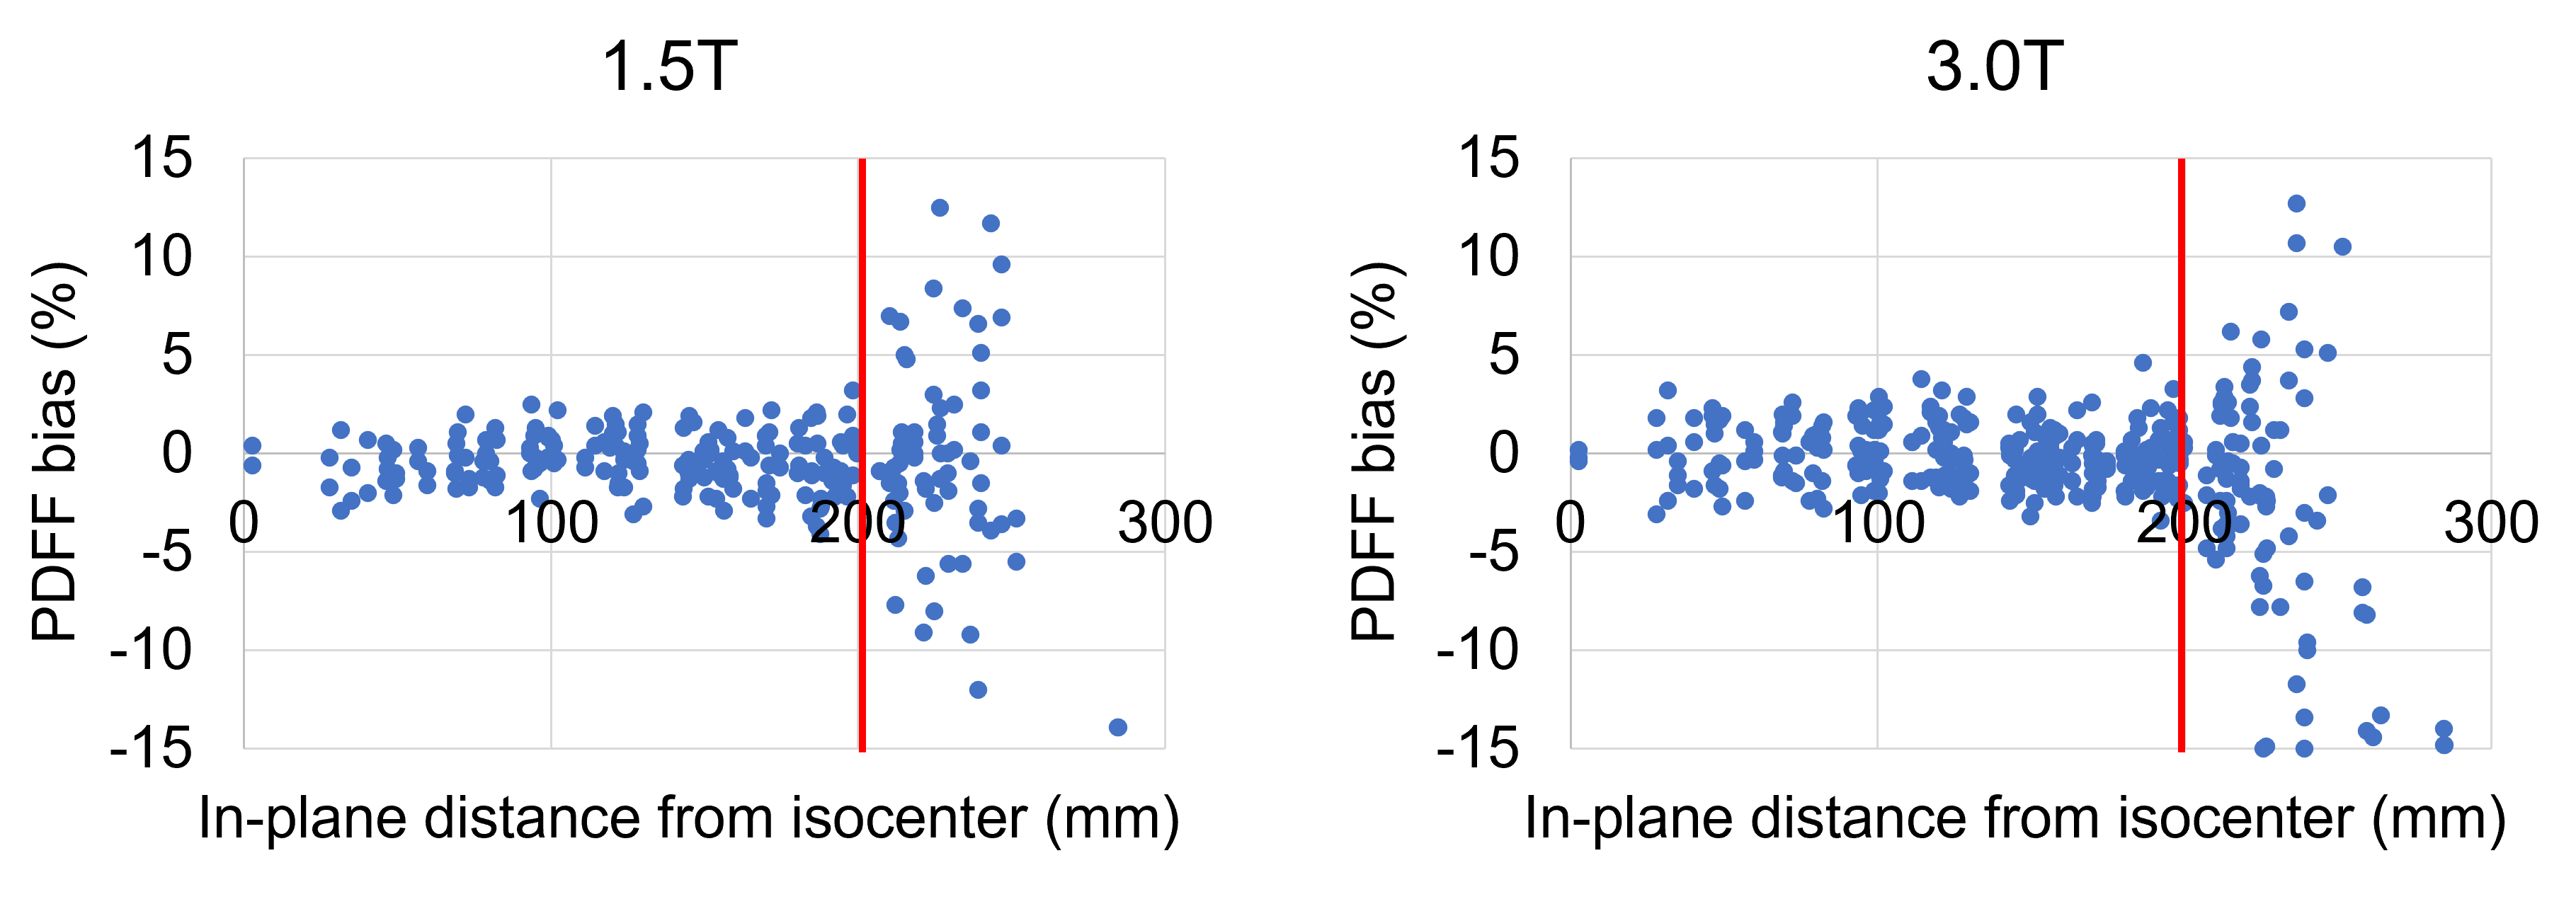
Figure 2: In-plane PDFF bias increases sharply at 20 cm in-plane distance from isocenter at both 1.5T and 3.0T.
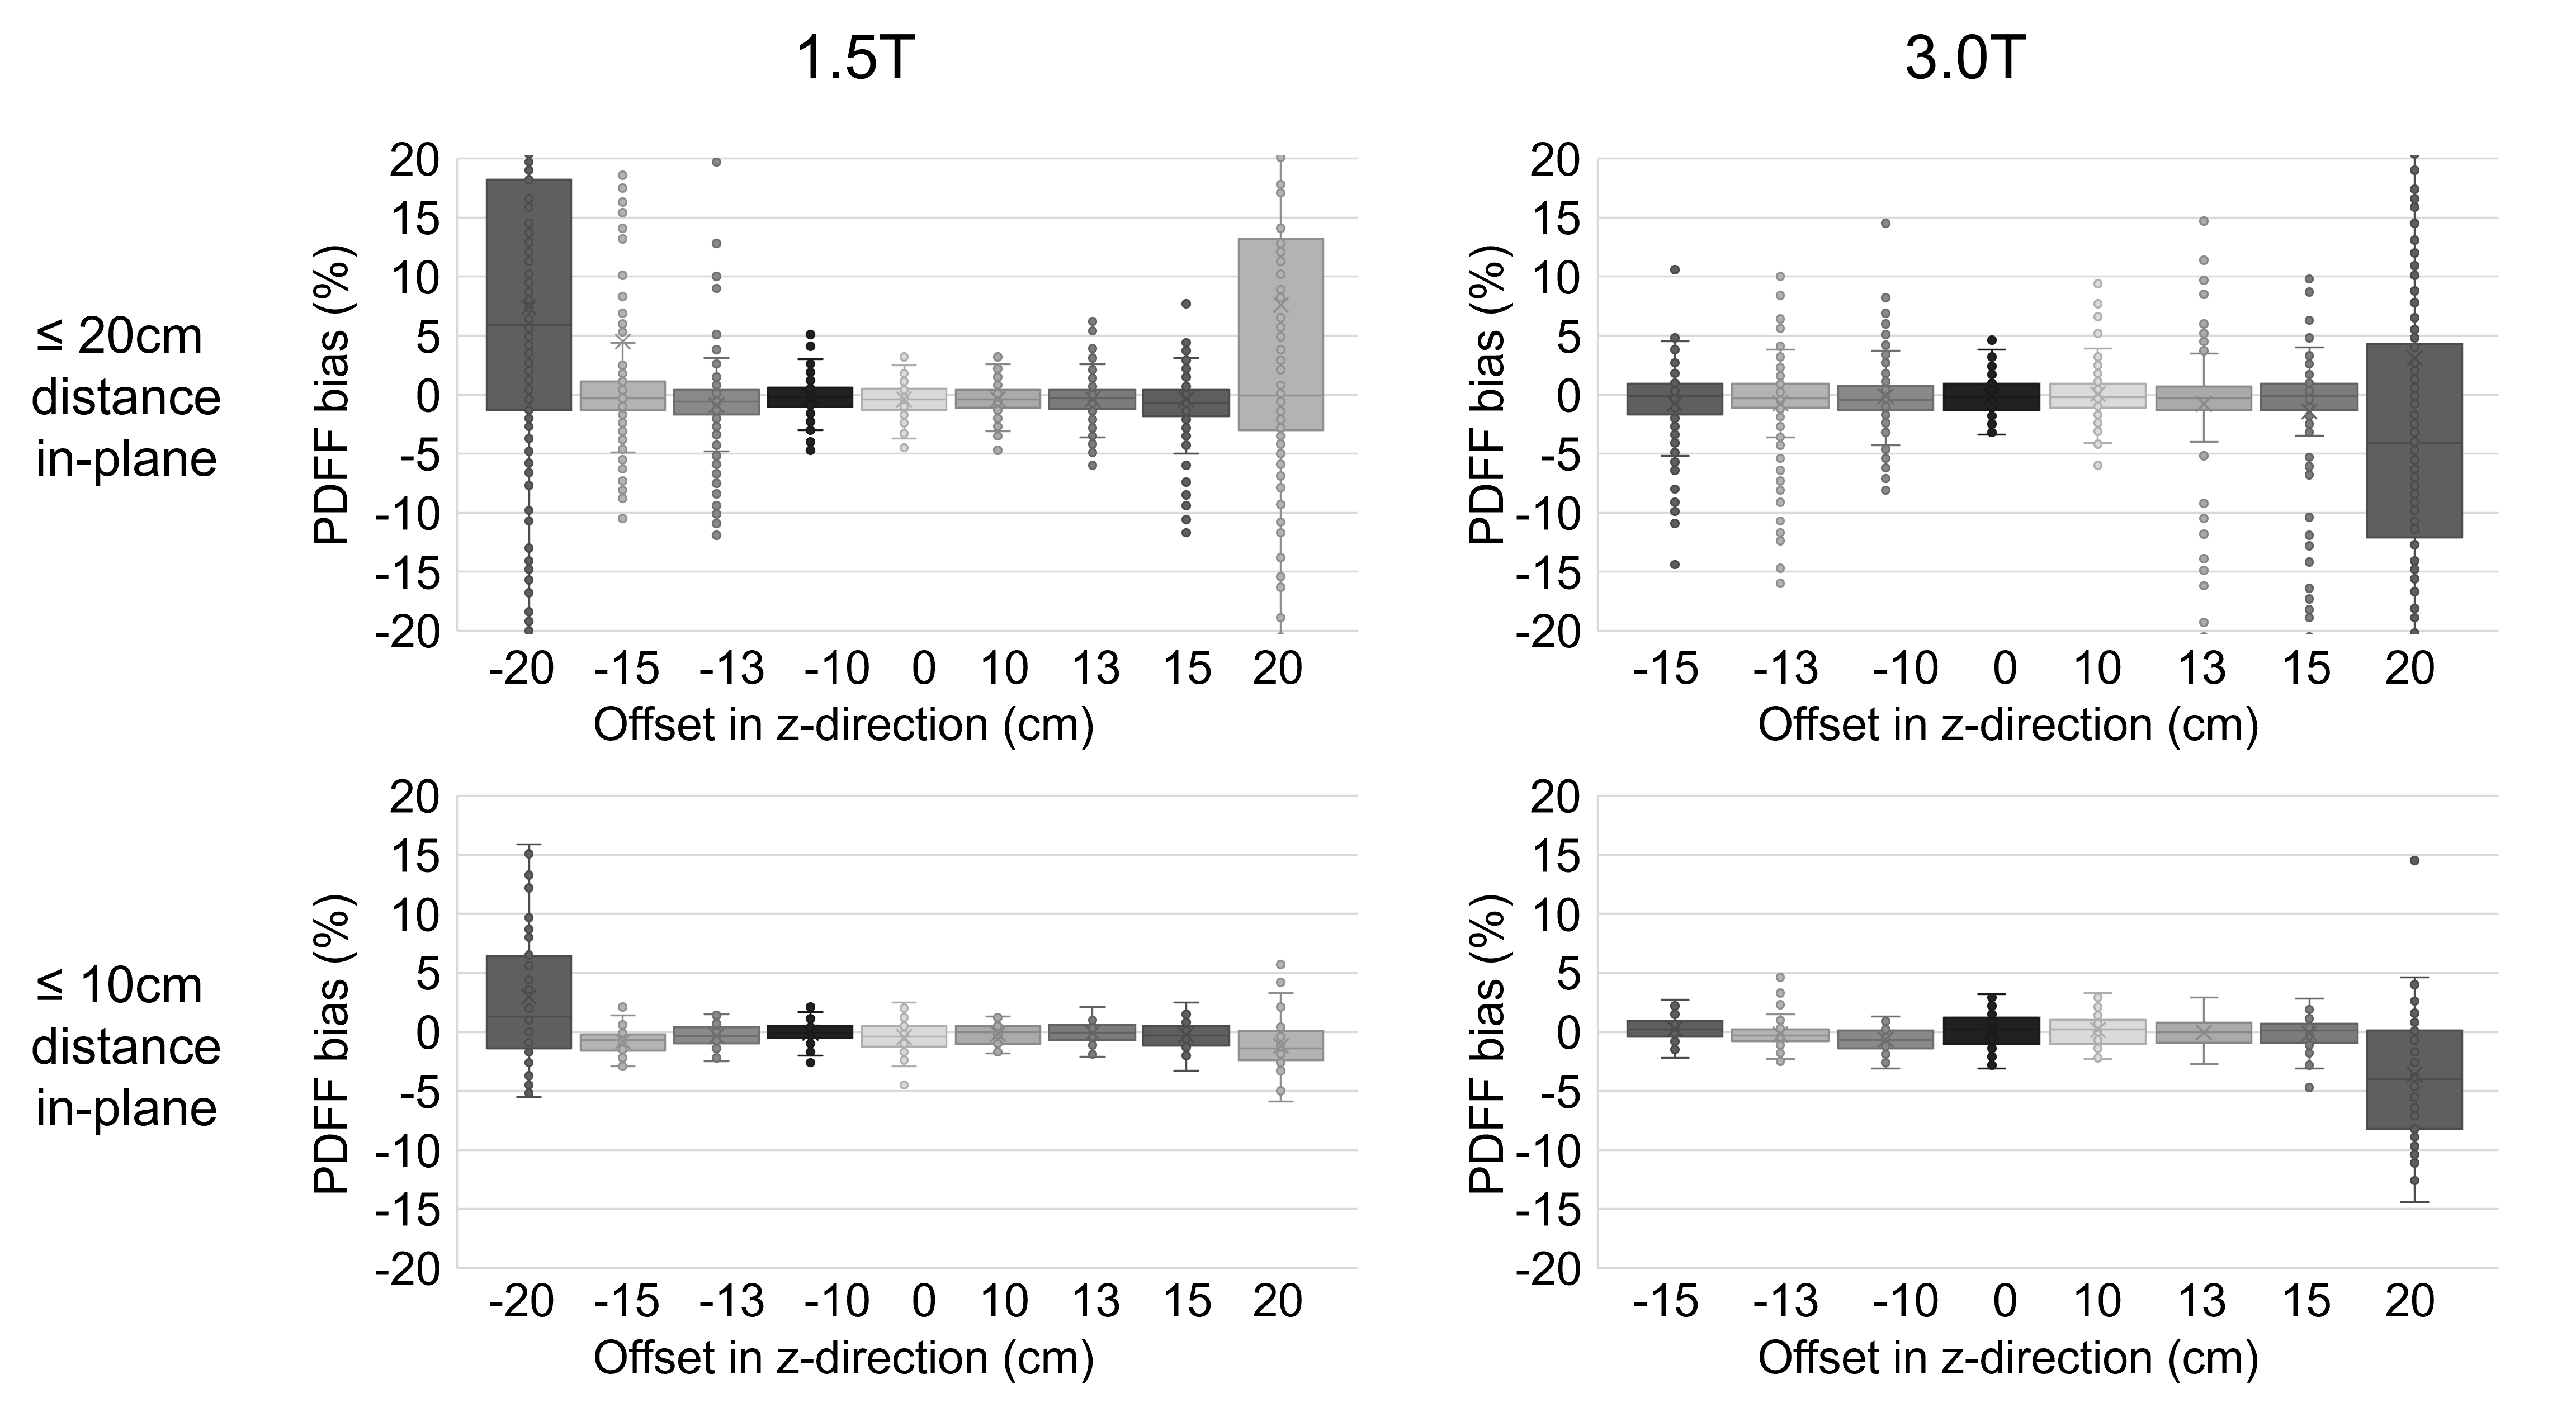
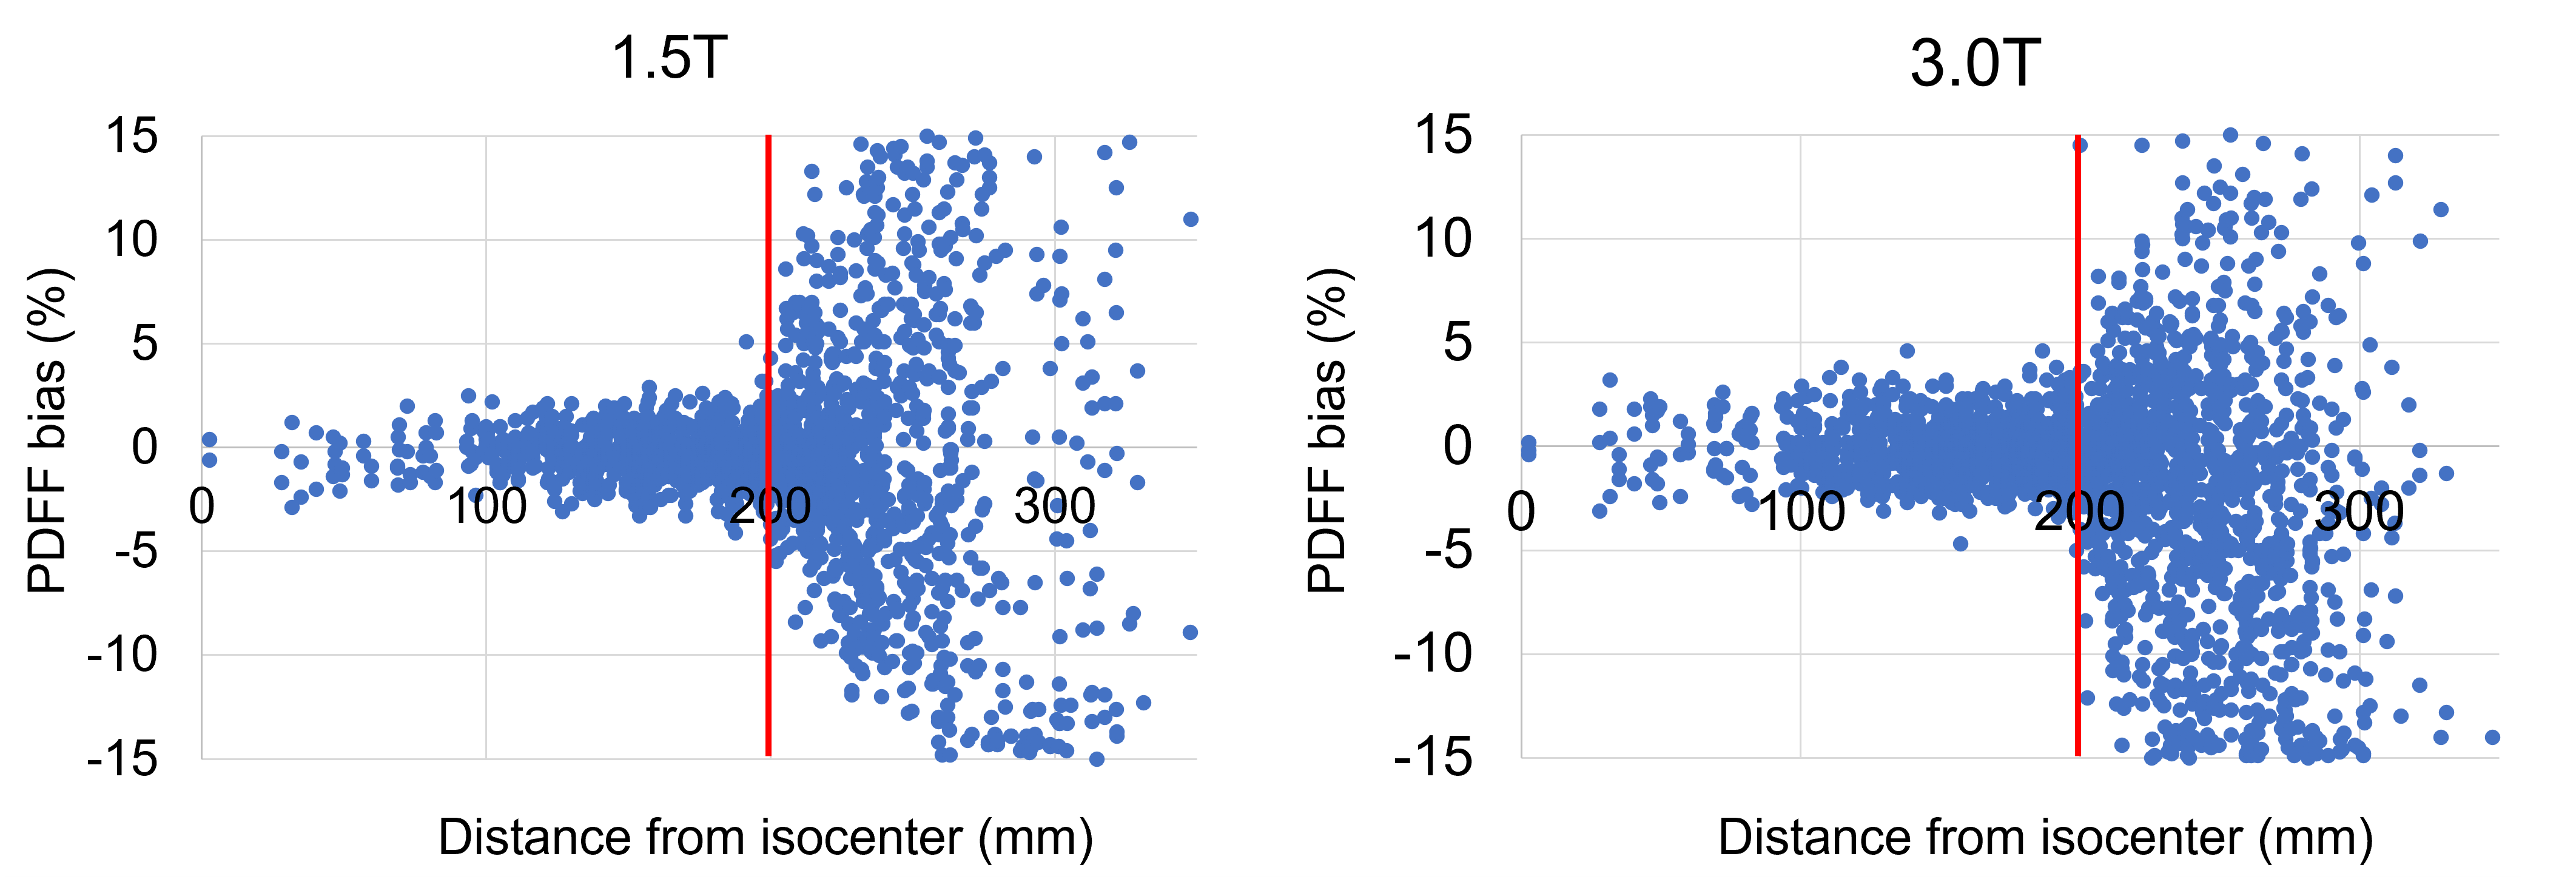
Figure 4: Bias was low within 20cm distance from isocenter in each direction. There was a steep increase at 20cm with clinically non-tolerable bias.
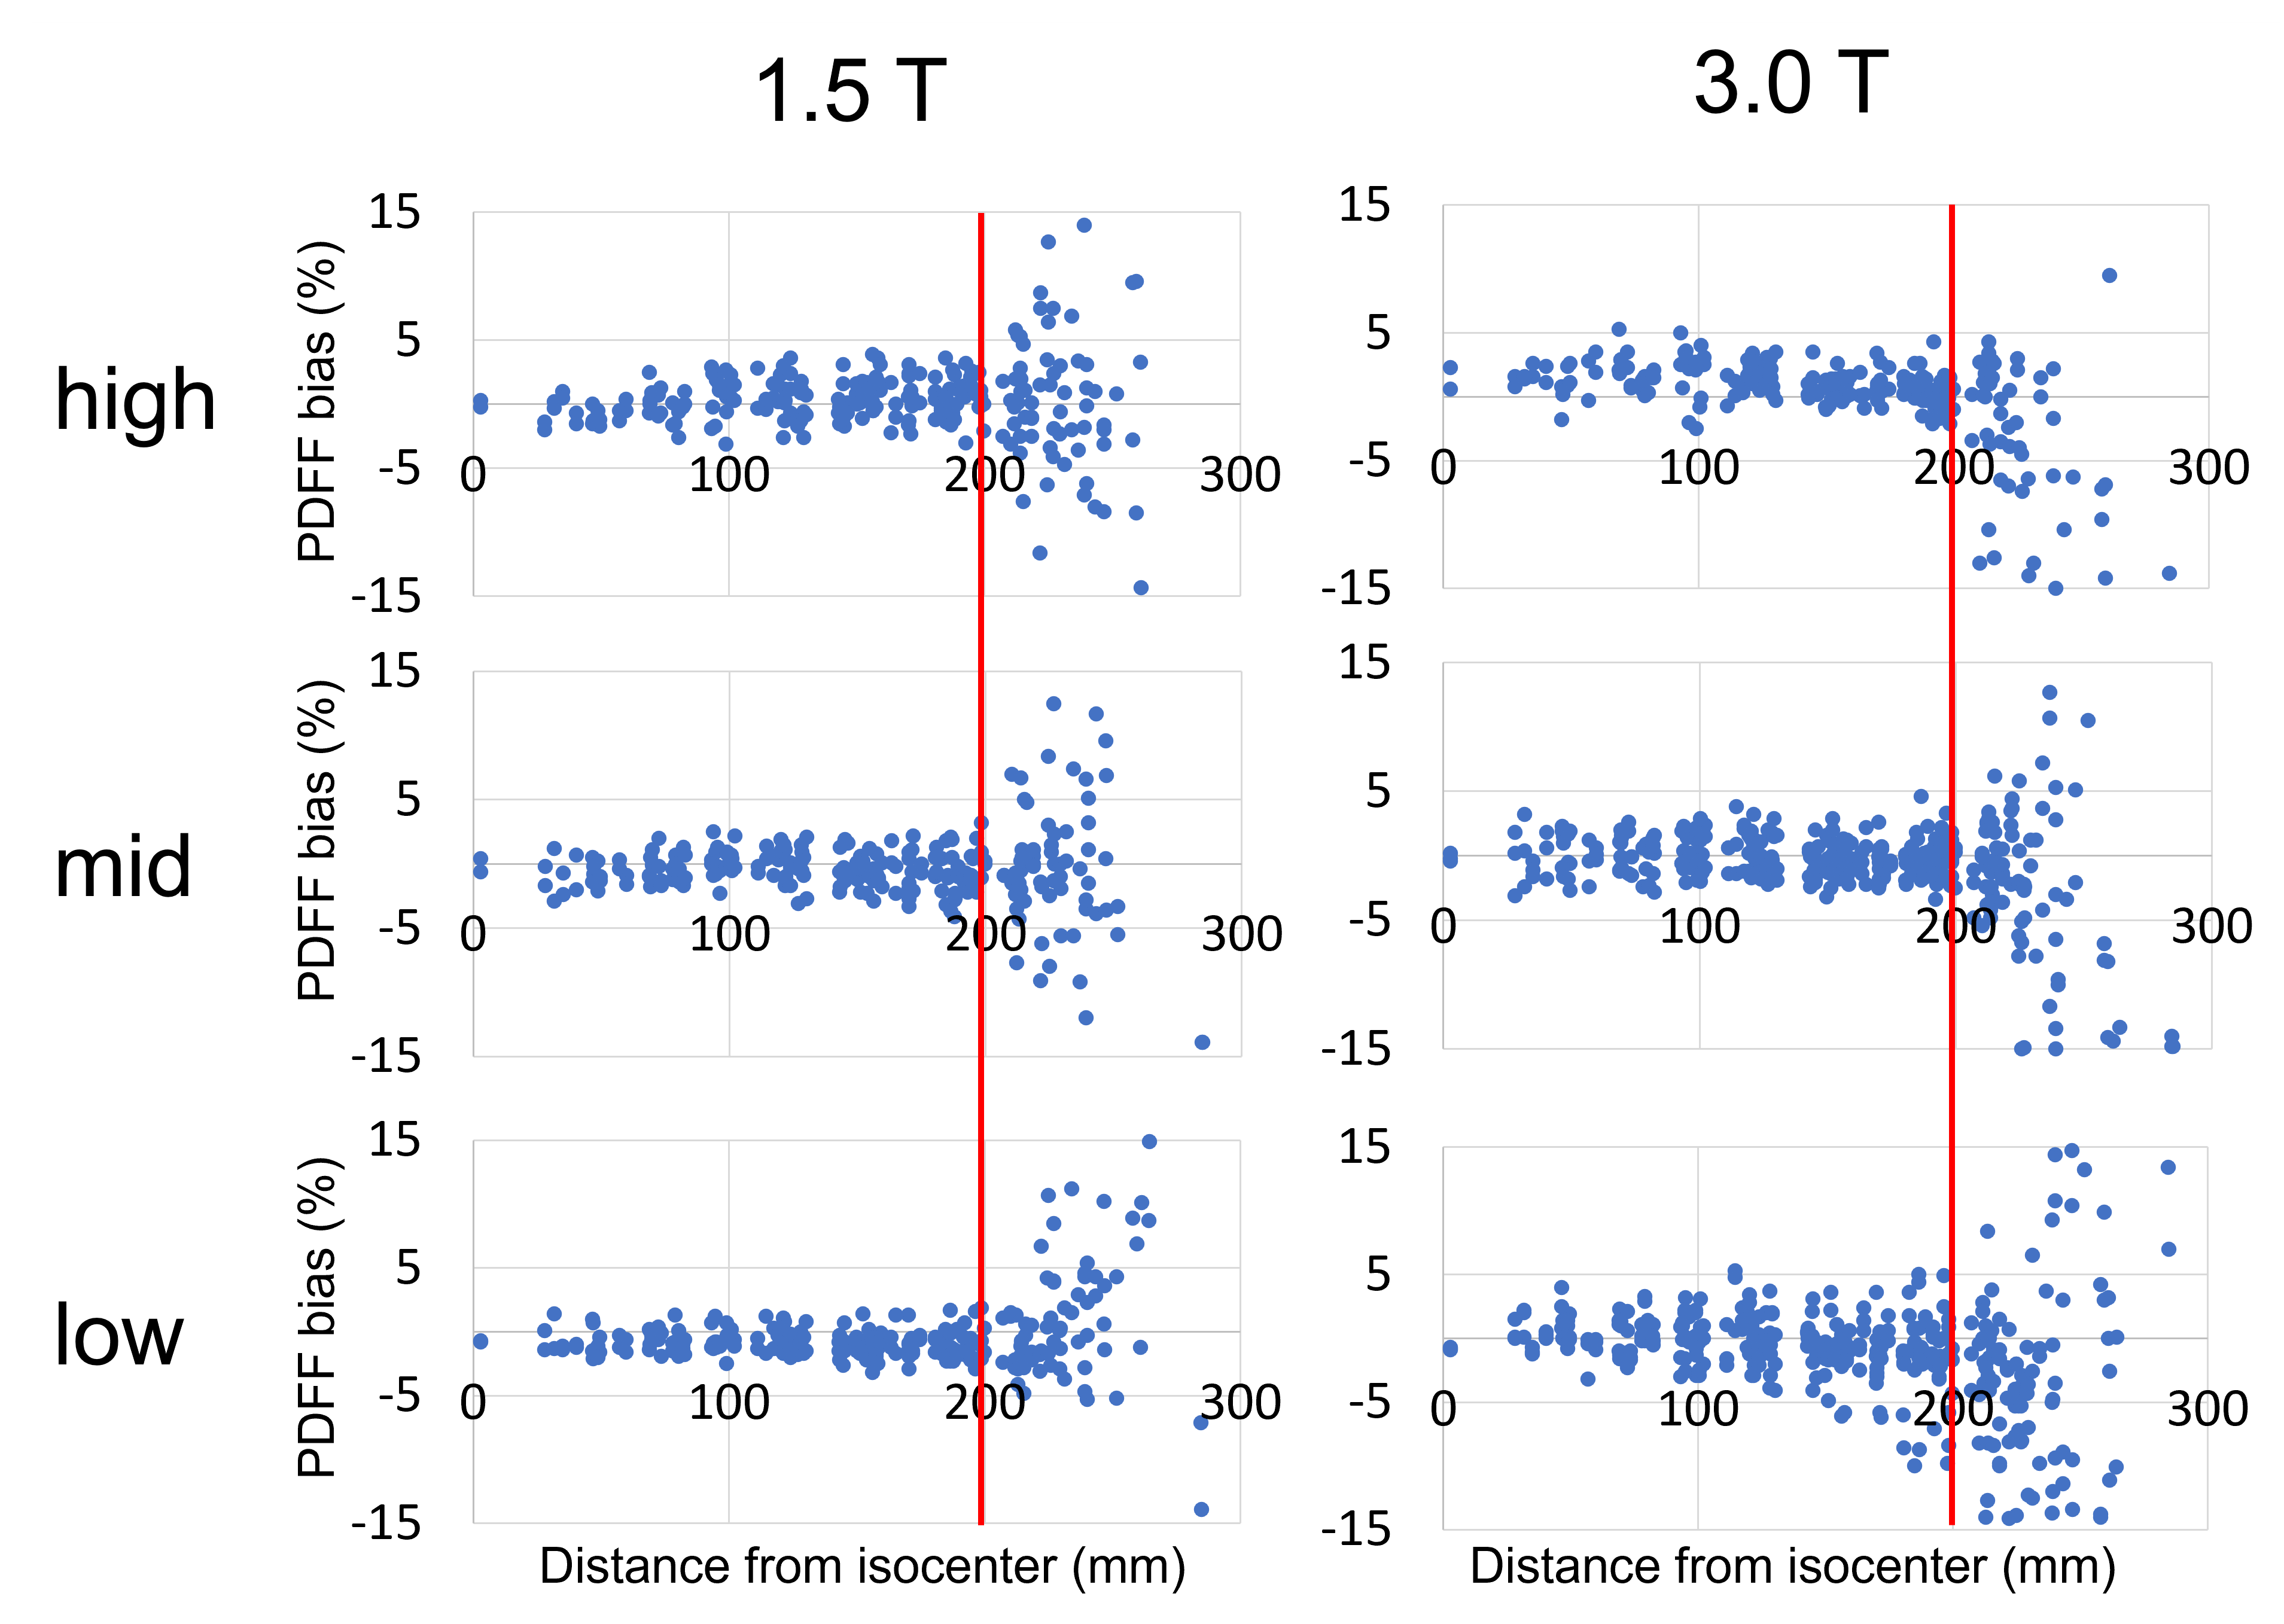
Figure 5: Spatial resolution of the acquired PDFF maps did not affect the cutoff value of 20cm distance from isocenter in-plane.