1811
Addressing Bias and Precision in Low SNR Chemical Shift Encoded MRI Proton Density Fat Fraction Estimation using a Deep Learning Reconstruction1GE HealthCare, Waukesha, WI, United States, 2Radiology, University of Wisconsin - Madison, Madison, WI, United States, 3Medical Physics, University of Wisconsin - Madison, Madison, WI, United States, 4Biomedical Engineering, University of Wisconsin - Madison, Madison, WI, United States, 5Electrical and Computer Engineering, University of Wisconsin - Madison, Madison, WI, United States, 6Medicine, University of Wisconsin - Madison, Madison, WI, United States, 7Emergency Medicine, University of Wisconsin - Madison, Madison, WI, United States
Synopsis
Keywords: Quantitative Imaging, Machine Learning/Artificial Intelligence
Low bias and high precision are important for accurate diagnosis, staging, and treatment monitoring of chronic liver disease using chemical shift-encoded (CSE)-MRI. However, CSE-MRI proton density fat fraction (PDFF) measurements are often biased by an asymmetric noise distribution present in PDFF maps acquired with low/moderate signal-to-noise ratio (SNR). This work investigates the use of deep learning de-noising to mitigate this bias in phantoms and in vivo. Results demonstrate that deep learning reconstruction removes or reduces noise-related PDFF estimation bias while maintaining the expected noise distribution characteristic of PDFF.
Introduction
Chemical shift-encoded (CSE)-MRI is an established method for measuring confounder-corrected proton density fat fraction (PDFF) as a biomarker of tissue triglyceride concentration1. Low bias and high precision of PDFF estimates is important for accurate diagnosis, staging, and treatment monitoring of chronic liver disease2. Acquiring data with high signal-to-noise ratio (SNR) reduces bias and improves precision3. However, many CSE-MRI measurements are acquired with low flip angles to avoid T1 bias4, rapid acquisitions to avoid motion artifacts5, or high liver iron content6, degrading overall performance. This can be problematic for PDFF estimation where low SNR results in an asymmetric noise distribution leading to biased measurements7,8.A prototype commercial de-noising deep learning reconstruction (DLR) is capable of increasing the effective SNR of acquired 3D datasets (AIR Recon DL 3D, GE Healthcare, Waukesha, WI)9. Qualitatively, DLR has been reported to increase image quality, reduce noise and artifacts, and improve lesion conspicuity10,11. However, important work remains to validate the use of DLR in quantitative CSE-MRI, where signal consistency across acquired echoes must be maintained. Therefore, the purpose of this work is to validate the use of DLR in quantitative CSE-MRI and examine its ability to mitigate the impact of low SNR on noise-related PDFF bias.
Methods
This work evaluates the bias and precision of CSE-MRI PDFF estimation with and without DLR in a pure water phantom, pure fat phantom (peanut oil), a gel-based fat/water phantom (Calimetrix, Madison, WI), and in vivo. Raw source echo data were reconstructed using conventional (i.e., without DL) reconstruction and at three de-noising levels (low: 30%, medium: 50%, high: 75%) with DLR, for a total of four independent reconstructions of the same raw data. SNR was calculated in the first echo as the average magnitude signal within a region of interest (ROI) over the corrected12 standard deviation of background noise.Phantom Experiments
In each phantom experiment, five multi-echo 3D CSE-MRI acquisitions (IDEALIQ, GE Healthcare) were acquired with varying flip angles (to modulate SNR) at 1.5T (Signa Artist, GE Healthcare) using a 19-channel head/neck coil (acquisition parameters shown in Table 1).
CSE-MRI nonlinear least squares (NLLS) fittings were performed using complex data according to the following formulation (after initialization by a graph-cut algorithm13):$$\widehat{\theta}=\underset{\theta}{argmin}\left[\sum_{n=1}^{N}\left|M_0e^{i\phi_0}(1-\eta+\eta\,C_n)e^{-R_2^*\,t_n}e^{i2\pi\psi\,t_n}-s_n\right|^2\right]\quad[1]$$
$$$s_n~$$$is the data acquired at echo time$$$~t_n$$$. $$$\widehat{\theta}~$$$is the estimated set of parameters including the complex signal amplitude ($$$M_0e^{i\phi_0}$$$), PDFF ($$$\eta$$$), relaxation constant ($$$R_2^*$$$), and B0 field map ($$$\psi$$$). $$$C_n~$$$is the weighted sum of complex exponentials reflecting a predetermined 6-peak spectral model of fat14,15 ($$$C_n=\sum_{p=1}^{6}\alpha_pe^{i2\pi\,f_p\,t_n}$$$).
In the pure water (PDFF=0%) and pure fat (PDFF=100%) phantom experiments, the mean and median were calculated for a large ROI within a central slice of each estimated PDFF map. Additionally, a maximum likelihood estimation (MLE) was performed to fit the measured ROI values to the previously derived PDFF noise distribution7.
In the gel fat/water phantom experiment, acquisitions were performed twice in a test/retest experiment. ROIs were placed in the three vials containing a colloidal suspension of both fat and water. Measurements were compared to the nominal PDFF values calibrated by Calimetrix (3.2%, 5.4%, 24.2%). Test/Retest mean and standard deviation of bias were calculated16 in each vial.
In Vivo Evaluations
Three in vivo CSE-MRI volunteer datasets, acquired in a HIPAA-compliant manner and with IRB approval, were selected for retrospective evaluation (acquisition parameters in Table 1). Fitting was performed using a combination of complex and magnitude-based NLLS as provided in an investigational version of a 3D multi-echo CSE-MRI prototype (IronQuant, GE Healthcare)17,18. A single co-localized ROI was placed in the right lobe of the liver in each reconstructed map and PDFF bias and noise performance were compared.
Results
Phantom ExperimentsROI analysis in PDFF maps estimated from the conventional reconstruction confirmed7 the presence of a non-symmetric noise distribution whose average becomes increasingly biased as SNR decreases (Figure 1). In the pure water phantom, Figure 2 shows that DLR provided a 3.5 factor increase in SNR and removed a -1.1% PDFF estimation bais from the lowest SNR data (SNR=4.3). Similar results were observed in the pure fat phantom (Figure 2).
Results from the Test/Retest experiment in the gel fat/water phantom showed an average improvement of PDFF bias after DLR, particularly at low SNR (Figure 3).
In Vivo Evaluations
DL recon was demonstrated in three in vivo cases. Average PDFF differences were minor; however, standard deviation (a surrogate for precision) was improved by 0.19% PDFF on average (Figure 4).
Discussion
This work provided validation for the use of DLR in quantitative CSE-MRI. Applying DLR in phantoms successfully reduced PDFF estimation bias and improved noise performance. We found the effect of DLR on the noise distribution of estimated PDFF to be analogous to that of acquiring data with increased SNR (i.e., decreased bias and reduced variance, but still distributed according to the previously derived noise distribution of PDFF7).In the abdomen, the spatial resolution of CSE-MRI is typically constrained by the limited scan time available for a breath hold; however, application of DLR may provide an opportunity to recover SNR in highly accelerated acquisitions without introducing noise-related PDFF bias.
This study presented only a limited number of in vivo cases. Enrollment is on-going to extend the analysis to a larger cohort.
Acknowledgements
The authors wish to acknowledge support from the NIH (R01EB031886) and GE HealthCare, who provides research support to the University of Wisconsin. Dr. Reeder is a Fred Lee Sr. Endowed Chair of Radiology.
References
1. Reeder SB, Hu HH, Sirlin CB. Proton density fat-fraction: a standardized MR-based biomarker of tissue fat concentration. J Magn Reson Imaging 2012;36:1011–4 doi: 10.1002/jmri.23741.
2. Yokoo T, Serai SD, Pirasteh A, et al. Linearity, Bias, and Precision of Hepatic Proton Density Fat Fraction Measurements by Using MR Imaging: A Meta-Analysis. Radiology 2017:170550 doi: 10.1148/radiol.2017170550.
3. Utaroh Motosugi, Diego Hernando, Curtis Wiens, Peter Bannas, Scott B. Reeder. High SNR Acquisitions Improve the Repeatability of Liver Fat Quantification Using Confounder-corrected Chemical Shift-encoded MR Imaging. Magn Reson Imaging 2017 doi: 10.2463/mrms.mp.2016-0081.
4. Liu CY, McKenzie CA, Yu H, Brittain JH, Reeder SB. Fat quantification with IDEAL gradient echo imaging: correction of bias from T(1) and noise. Magn Reson Med 2007;58:354–64 doi: 10.1002/mrm.21301.
5. Ruby JA, Hernando D, Campo C, et al. Motion Insensitive Quantification of Liver Proton Density Fat-Fraction Using a Single-Shot Sequential 2D Technique. 2016.
6. Horng DE, Hernando D, Reeder SB. Quantification of Liver Fat in the Presence of Iron Overload. J Magn Reson Imaging 2017;45:428–39 doi: 10.1002/jmri.25382.
7. Roberts NT, Hernando D, Holmes JH, Wiens CN, Reeder SB. Noise properties of proton density fat fraction estimated using chemical shift-encoded MRI. Magnetic Resonance in Medicine 2018;80:685–695 doi: 10.1002/mrm.27065.
8. Lawrence EM, Roberts NT, Hernando D, Mao L, Reeder SB. Effect of noise and estimator type on bias for analysis of liver proton density fat fraction. Magnetic Resonance Imaging 2020;74:244–249 doi: 10.1016/j.mri.2020.09.027.
9. Lebel RM. Performance characterization of a novel deep learning-based MR image reconstruction pipeline. 2020.
10. Kim S-H, Choi YH, Lee JS, et al. Deep learning reconstruction in pediatric brain MRI: comparison of image quality with conventional T2-weighted MRI. Neuroradiology 2022 doi: 10.1007/s00234-022-03053-1.
11. Wang X, Ma J, Bhosale P, et al. Novel deep learning-based noise reduction technique for prostate magnetic resonance imaging. Abdom Radiol 2021;46:3378–3386 doi: 10.1007/s00261-021-02964-6.
12. Henkelman RM. Measurement of signal intensities in the presence of noise in MR images. Medical physics 1985;12:232–3 doi: 10.1118/1.595711.
13. Hernando D, Kellman P, Haldar JP, Liang Z-P. Robust water/fat separation in the presence of large field inhomogeneities using a graph cut algorithm. Magn Reson Med 2010;63:79–90 doi: 10.1002/mrm.22177.
14. Yu H, Shimakawa A, McKenzie CA, Brodsky E, Brittain JH, Reeder SB. Multiecho water-fat separation and simultaneous R estimation with multifrequency fat spectrum modeling. Magnetic Resonance in Medicine 2008;60:1122–1134 doi: 10.1002/mrm.21737.
15. Hamilton G, Yokoo T, Bydder M, et al. In vivo characterization of the liver fat (1)H MR spectrum. NMR Biomed 2011;24:784–90 doi: 10.1002/nbm.1622.
16. Weingärtner S, Desmond KL, Obuchowski NA, et al. Development, validation, qualification, and dissemination of quantitative MR methods: Overview and recommendations by the ISMRM quantitative MR study group. Magnetic Resonance in Medicine 2022;n/a doi: 10.1002/mrm.29084.
17. Yu H, Shimakawa A, Hines CD, et al. Combination of complex-based and magnitude-based multiecho water-fat separation for accurate quantification of fat-fraction. Magnetic Resonance in Medicine 2011;66:199–206 doi: 10.1002/mrm.22840.
18. Hernando D, Hines CD, Yu H, Reeder SB. Addressing phase errors in fat-water imaging using a mixed magnitude/complex fitting method. Magn Reson Med 2012;67:638–44 doi: 10.1002/mrm.23044.
Figures
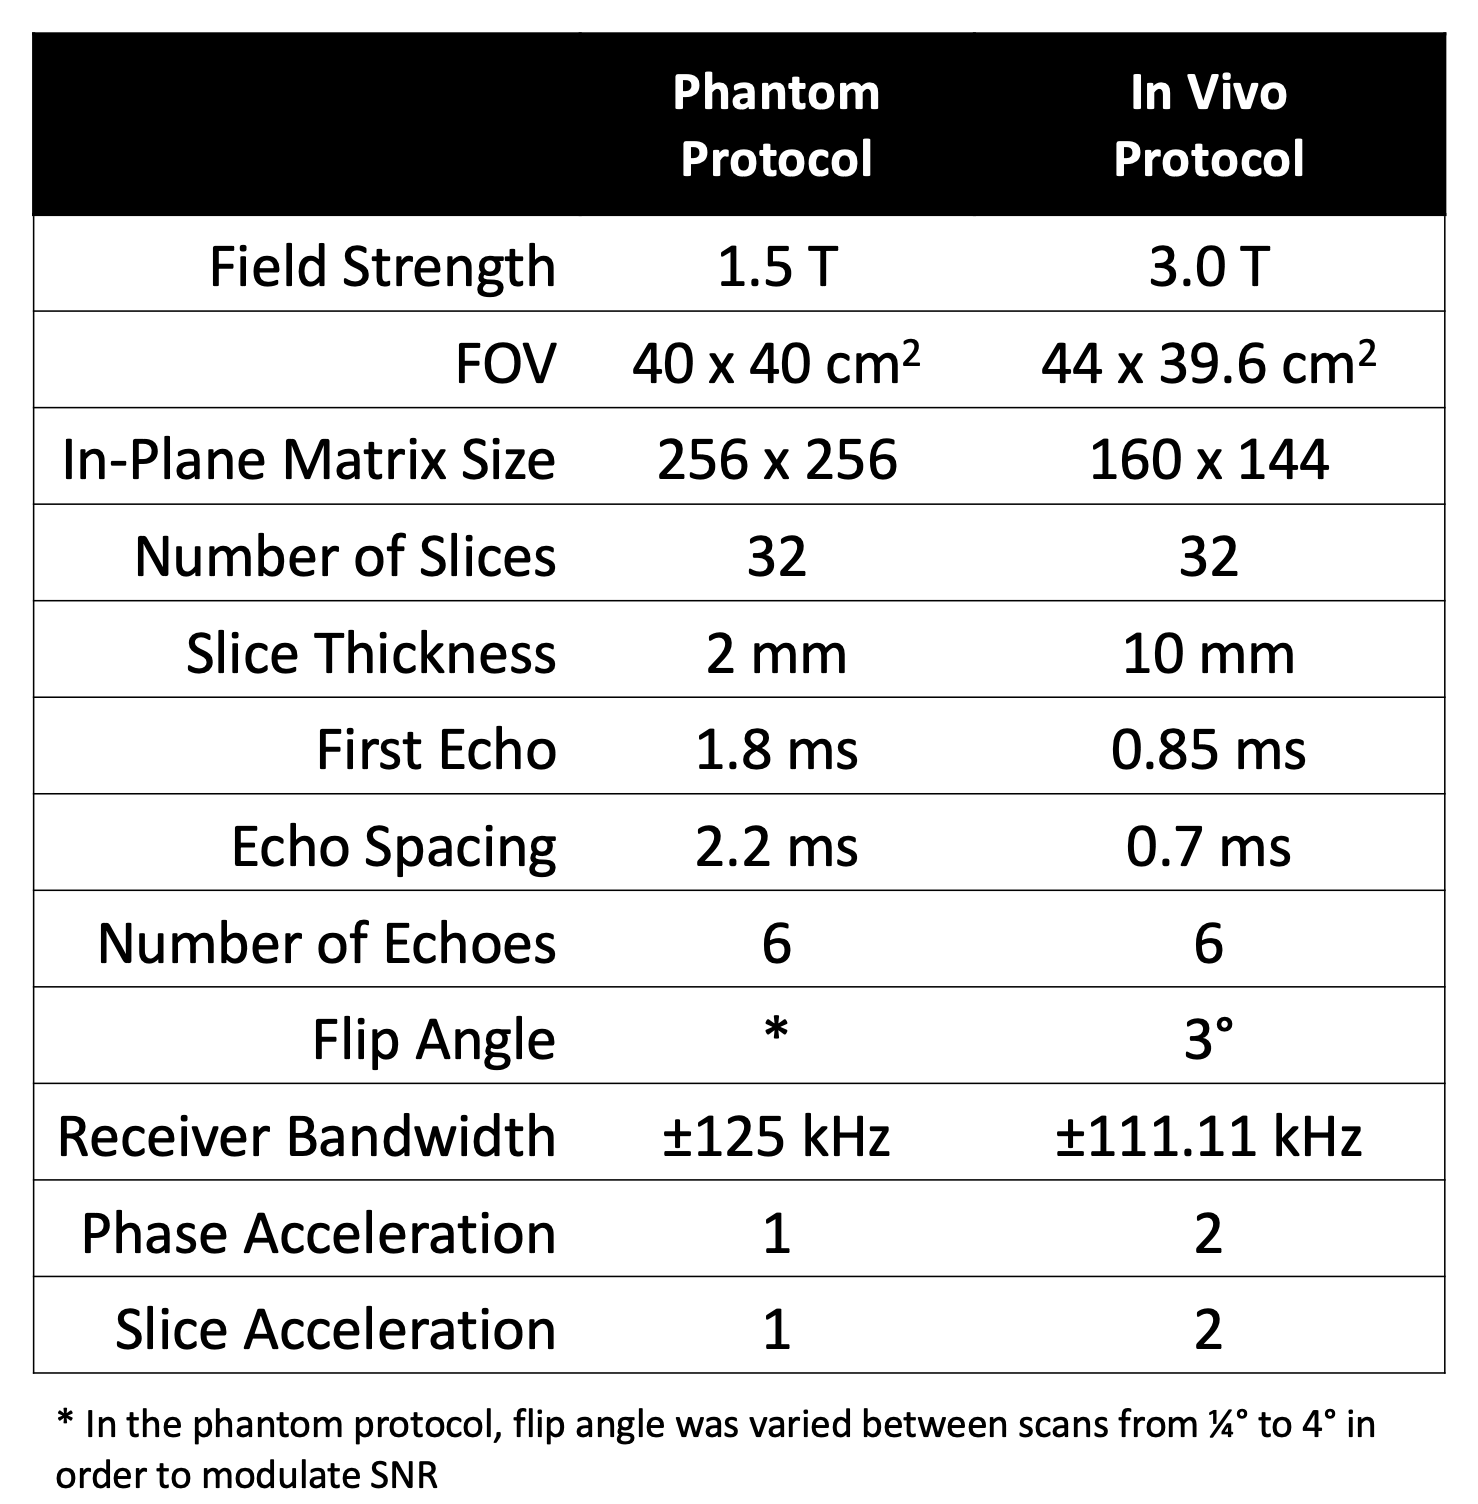
Table 1. Acquisition parameters for the phantom and in vivo protocols. Phantom acquisitions were acquired prospectively, while in vivo data were collected retrospectively.
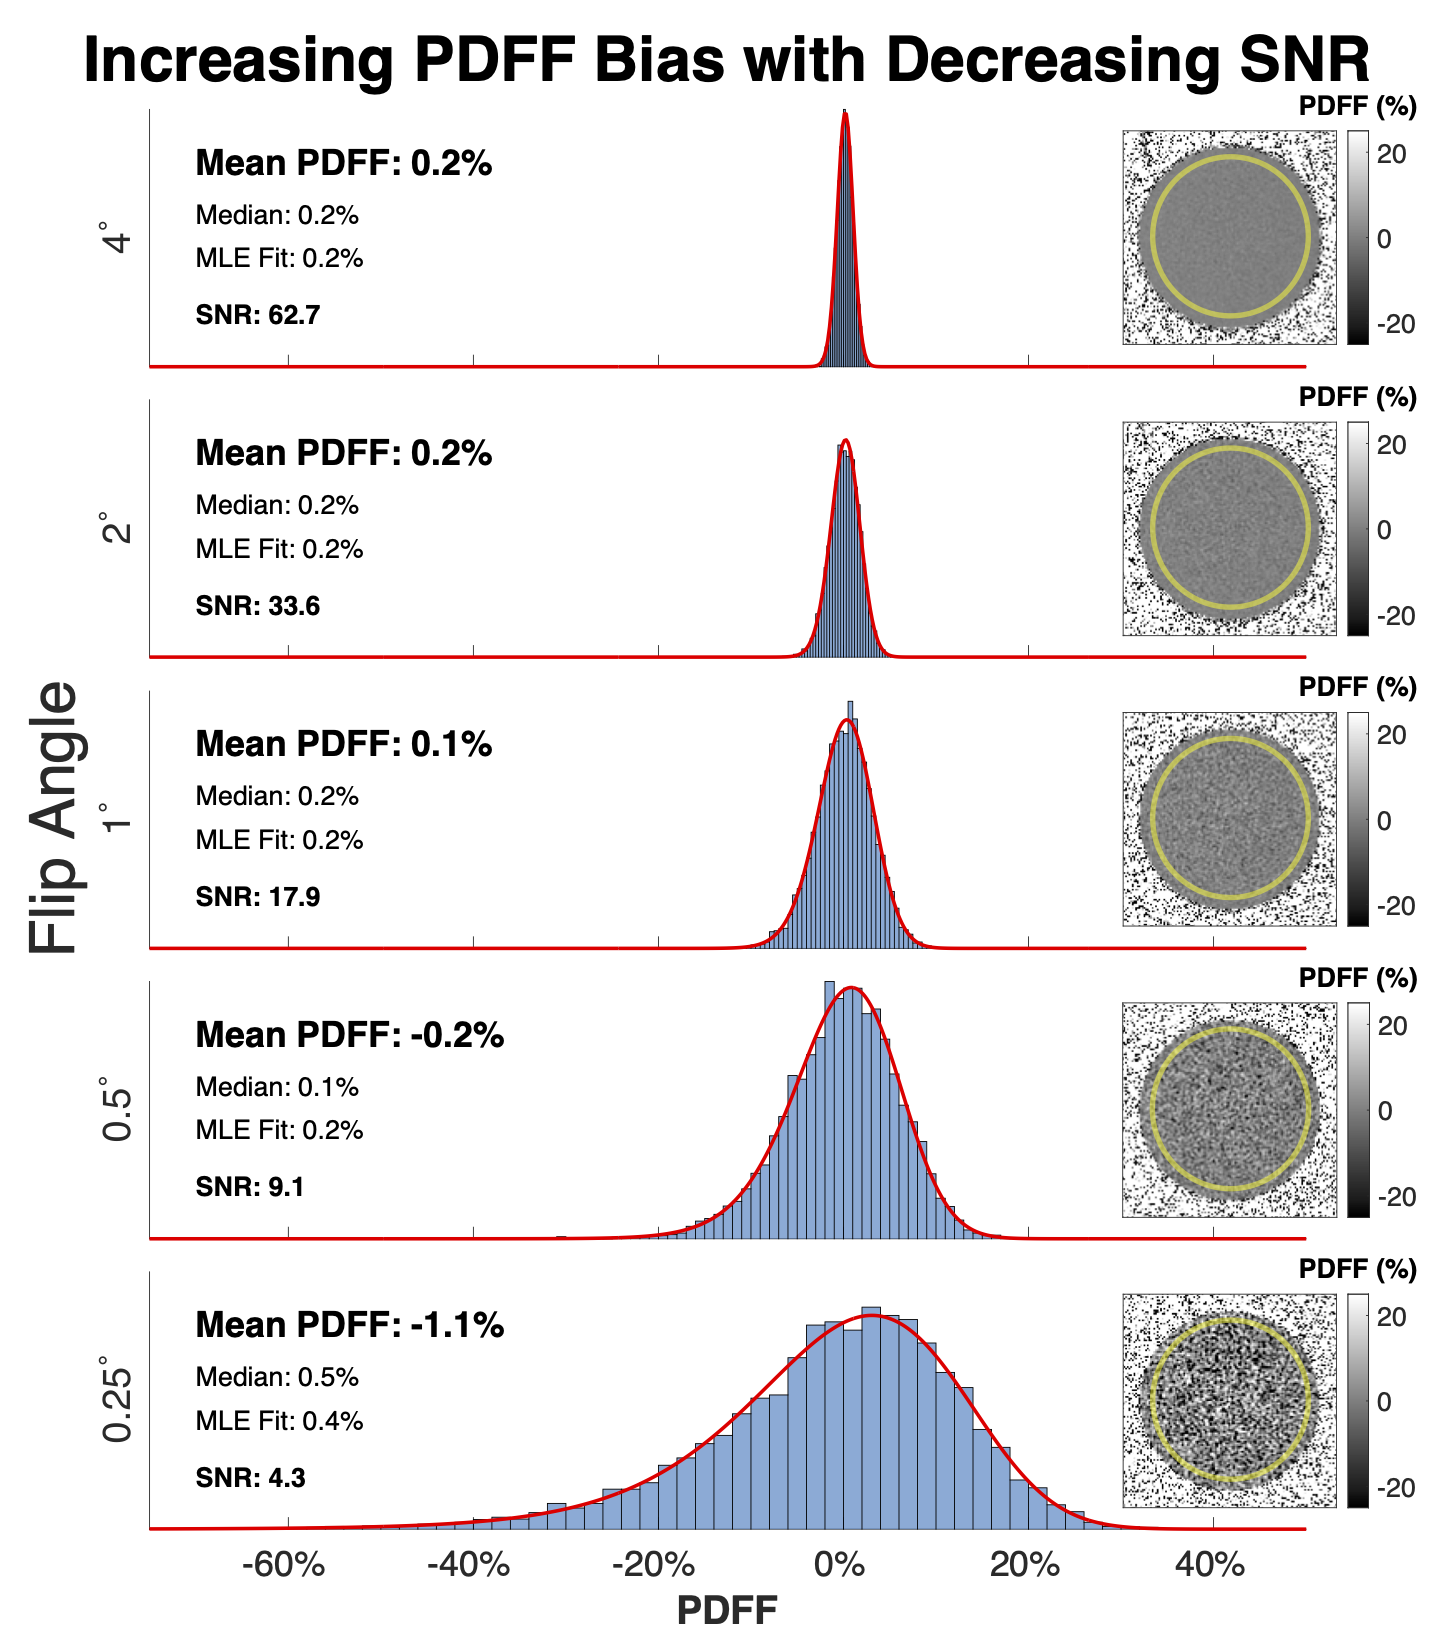
Figure 1. Average PDFF becomes increasingly biased, and noise distribution increasingly asymmetric, as SNR decreases. Shown are ROI histograms and PDFF maps from 5 datasets acquired in a pure water phantom with decreasing SNR, controlled by reducing the excitation flip angle. The red curve shows the maximum likelihood estimation (MLE) fit to the previously derived PDFF noise distribution. Note that the PDFF of water is 0% and thus systematic deviation from 0% can be considered bias.
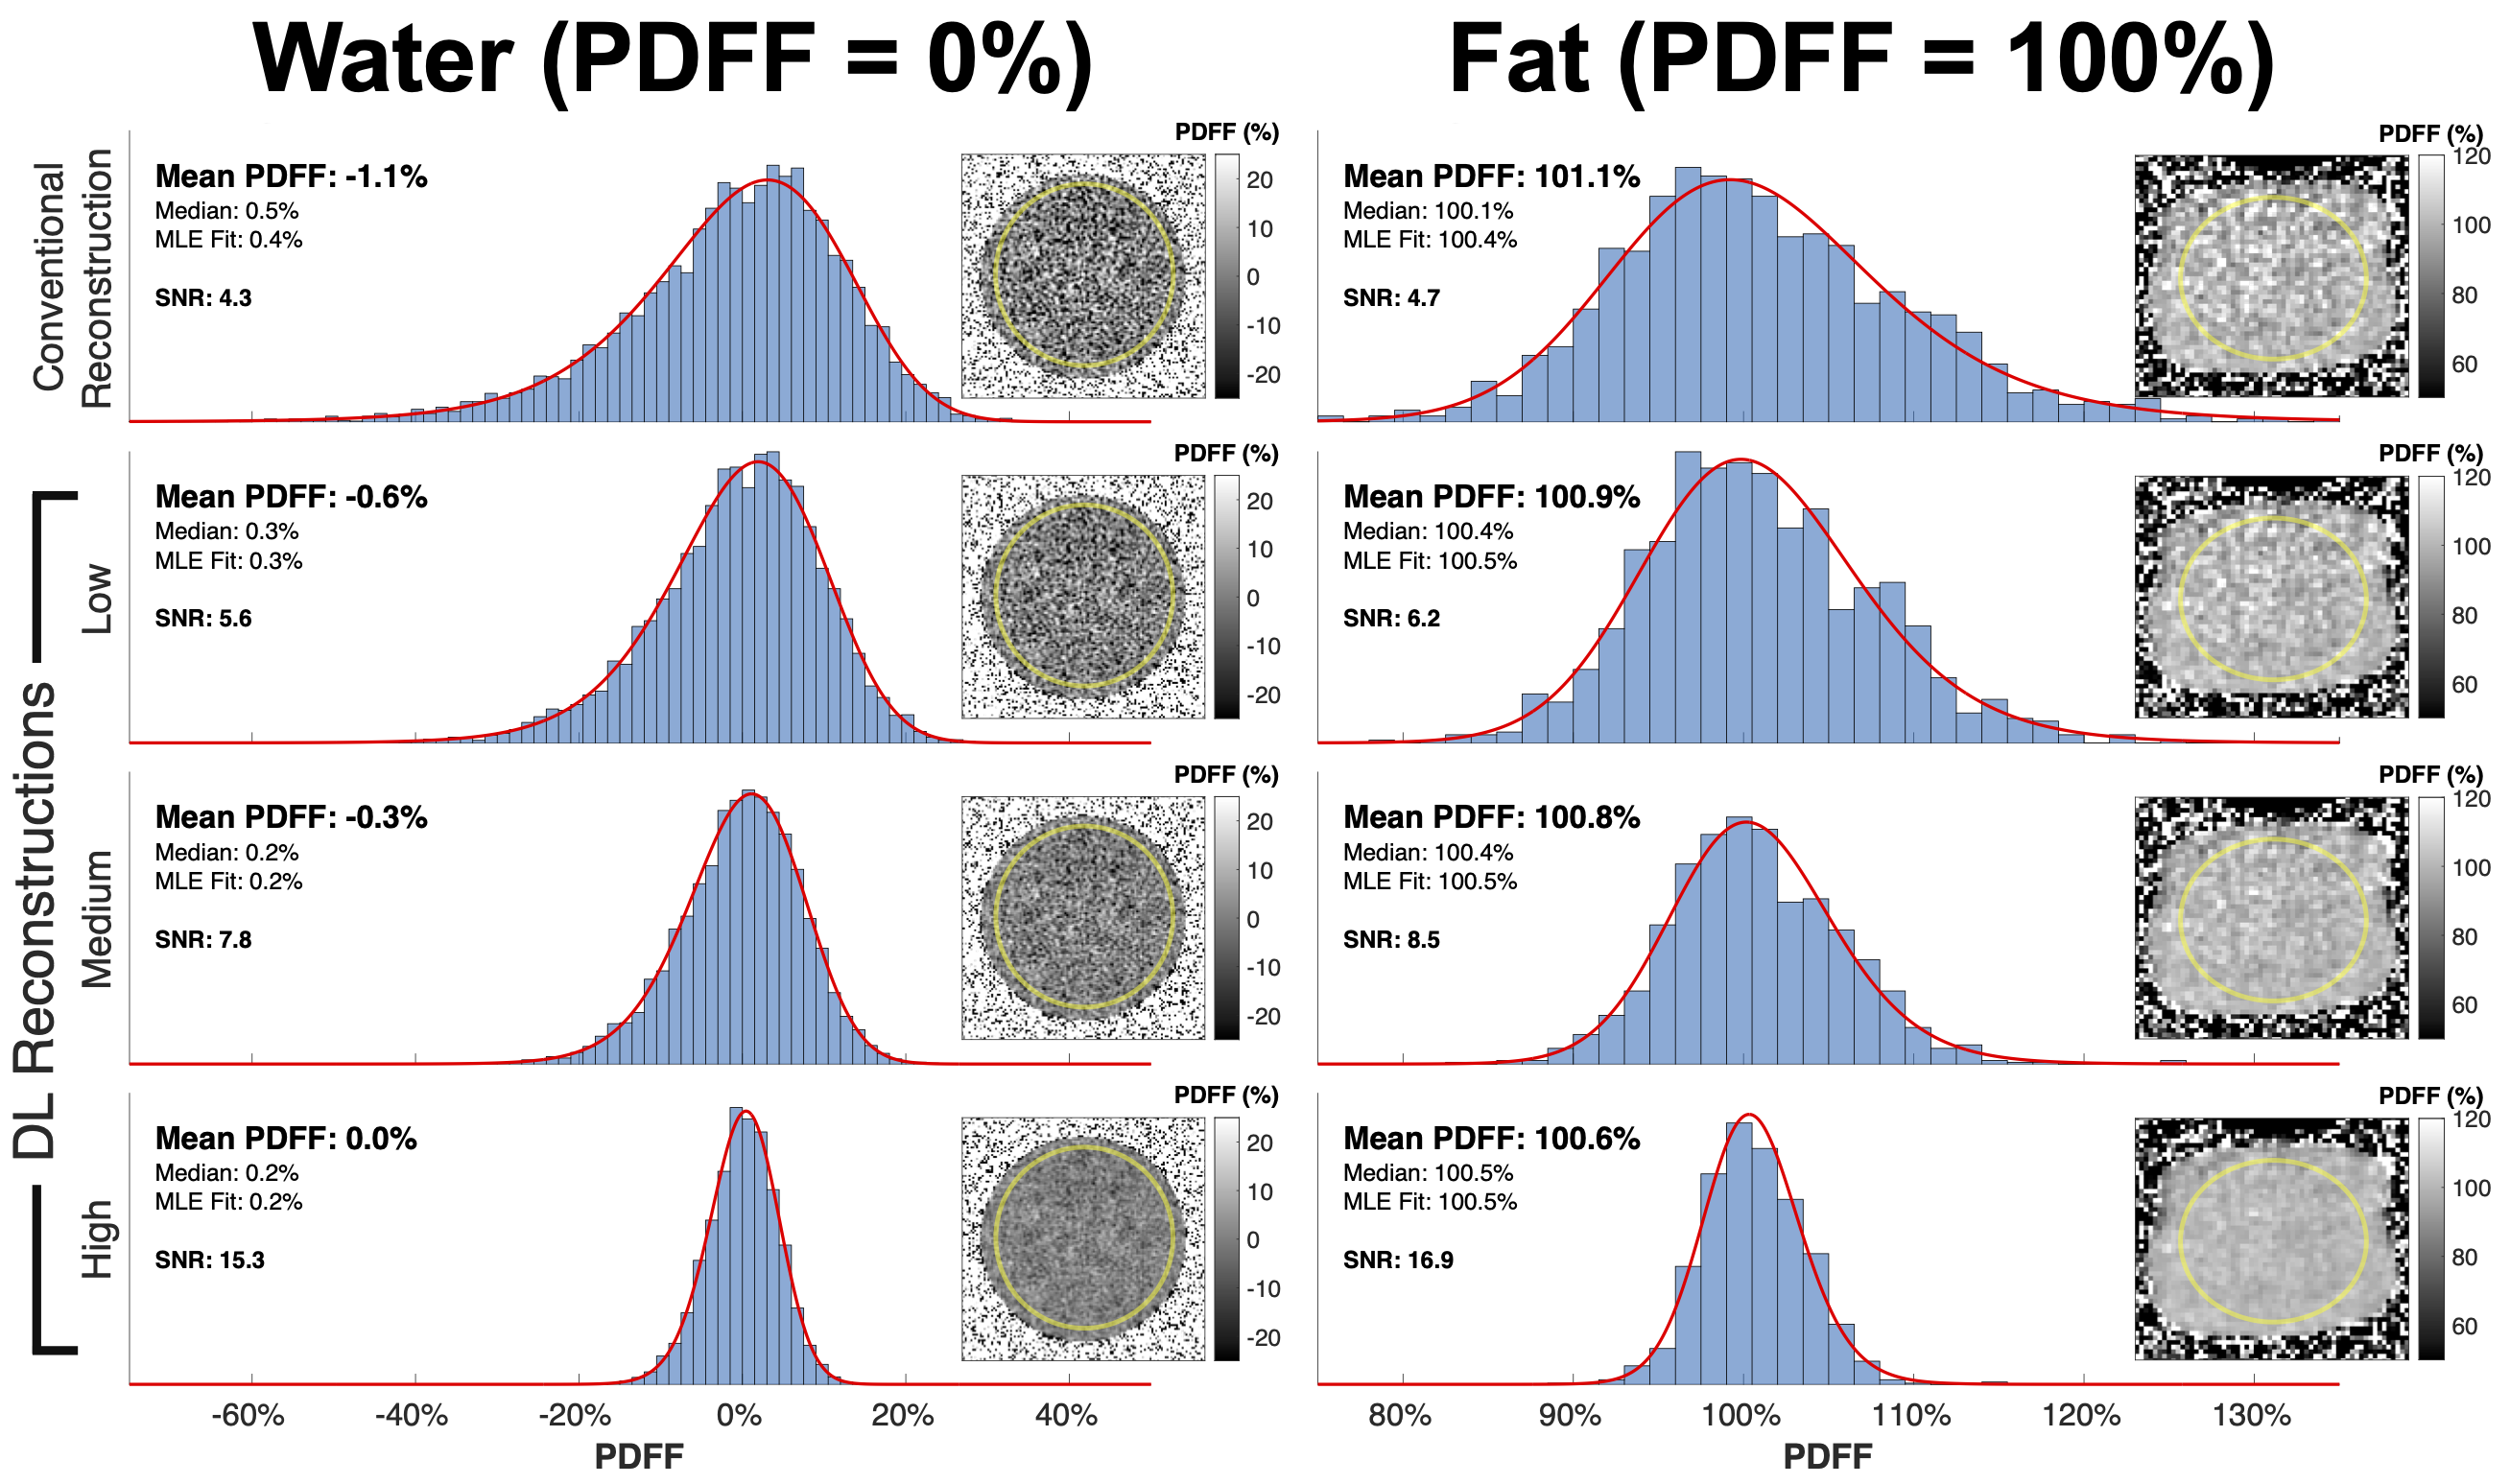
Figure 2. In both pure water and pure fat phantom acquisitions, DL reconstruction reduced PDFF estimation bias and resulted in a ~3.5 factor improvement of effective SNR. Within the water (left) and fat (right) columns shown above, each row contains ROI histograms and PDFF maps from independent reconstructions of the same data (lowest SNR acquisition, flip angle=0.25°) using the conventional reconstruction and varying degrees of DLR de-noising (low, medium, and high). The red curve shows the MLE fit to the previously derived PDFF noise distribution.
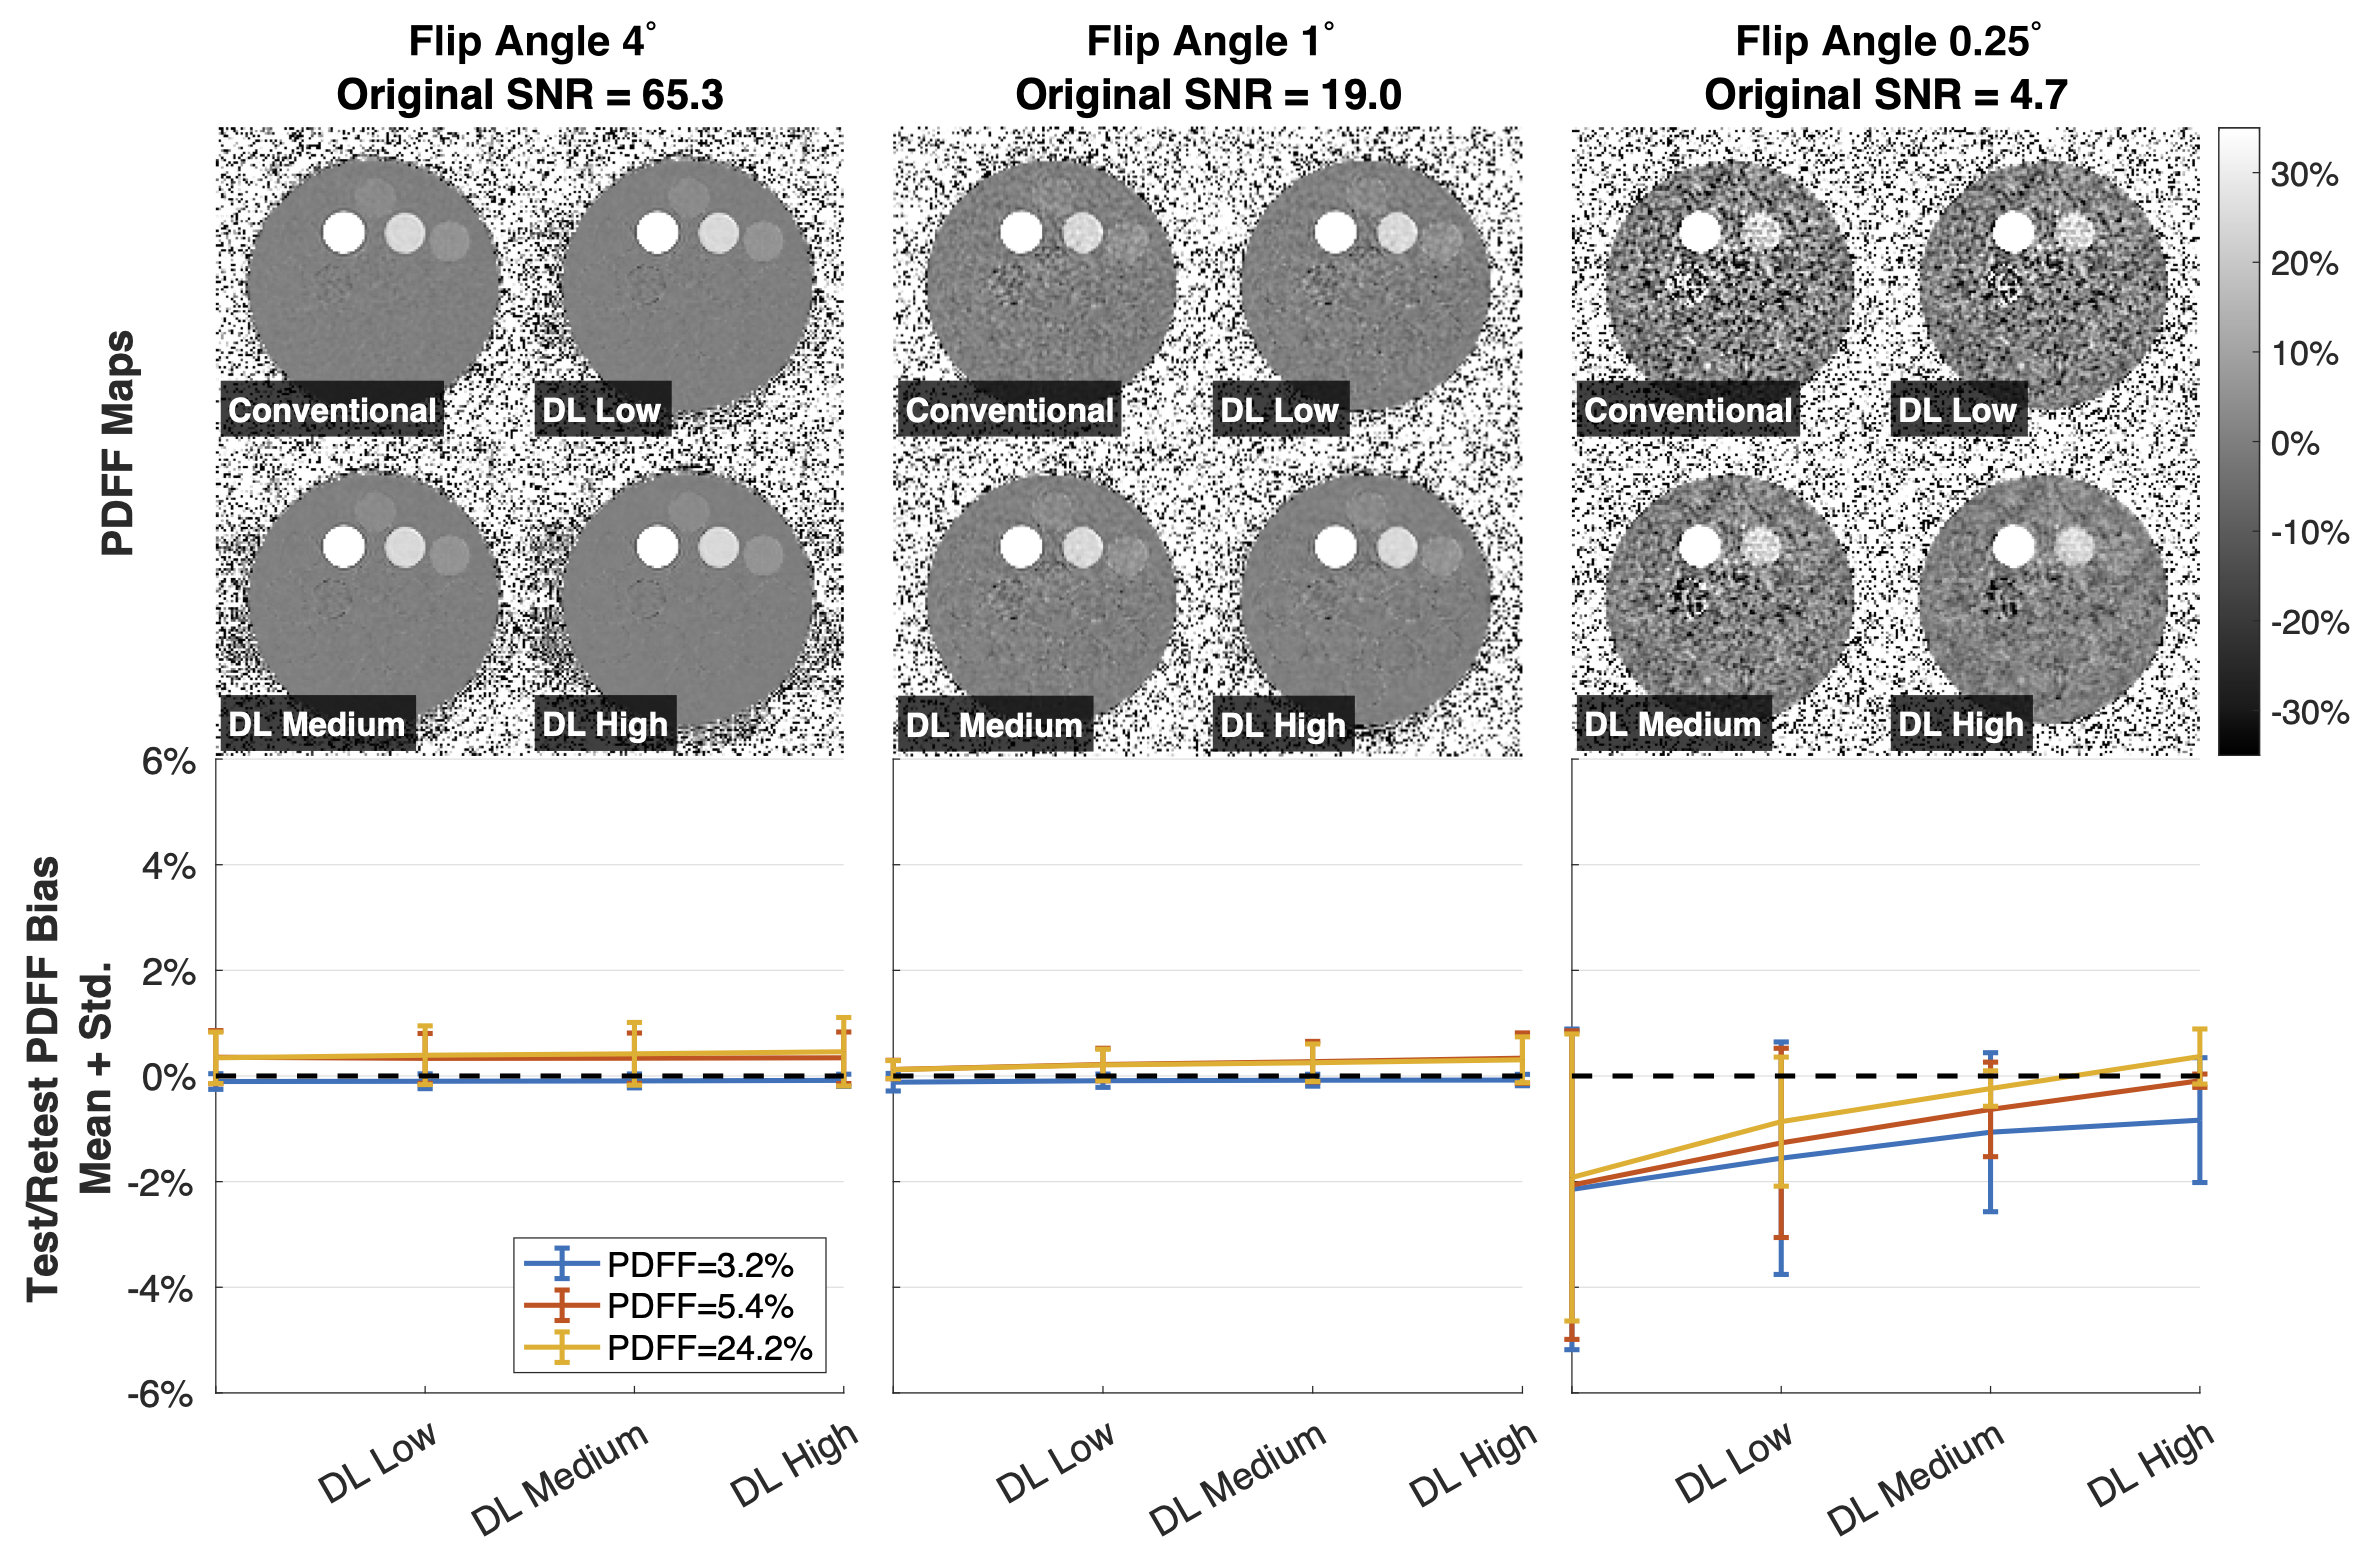
Figure 3. DLR reduces low-SNR PDFF bias in a fat/water gel phantom, particularly in low SNR acquisitions. Shown are reconstructed PDFF maps from four independent reconstructions (conventional and using varying degrees – low, medium, and high – of DLR de-noising) and plots showing the test/retest average bias (sold line) and standard deviation (error bars) in each measured vial between two repeated scans in an agar gel fat/water phantom (Calimetrix, Madison, WI). PDFF bias was determined against the nominal PDFF values calibrated by Calimetrix (3.2%, 5.4%, and 24.2%).
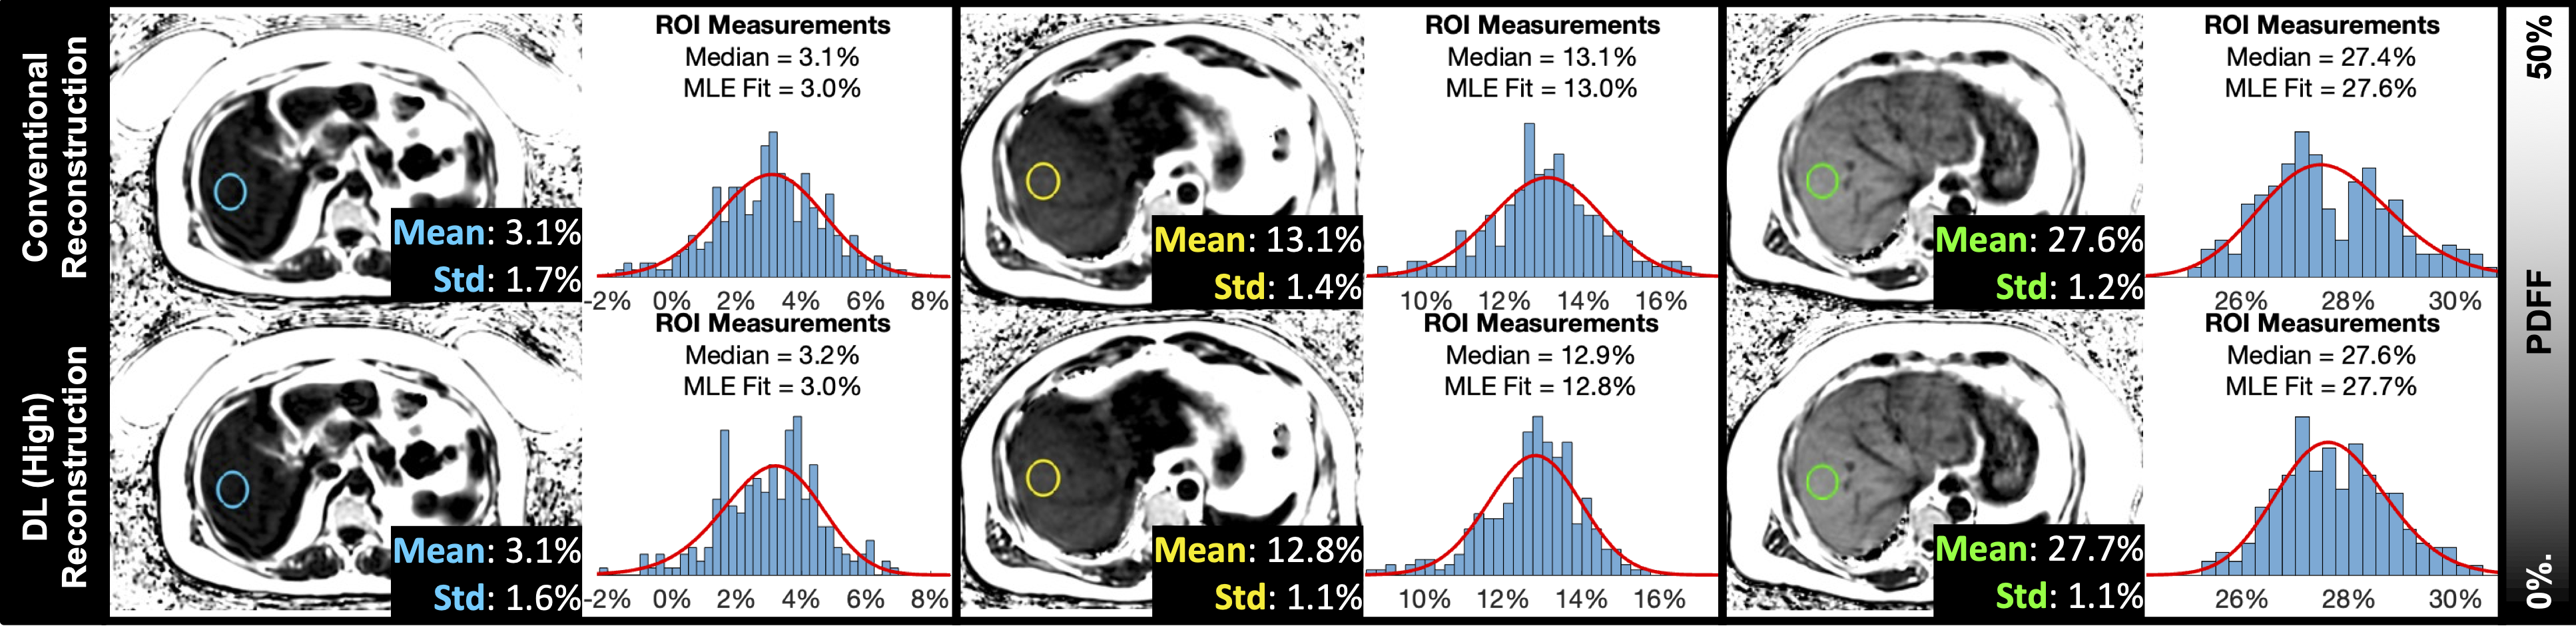
Figure 4. DLR reduced the standard deviation of estimated PDFF in three in vivo volunteer datasets and may, subjectively, improve PDFF map image quality without adversely affecting quantitative PDFF measurements. Shown are liver PDFF maps acquired in three volunteers with varying levels of liver fat content. The top row shows the conventional reconstruction with ROI histogram; the bottom row shows the same for the DL High reconstruction. The red curves show the maximum likelihood estimation (MLE) fit to the previously derived PDFF noise distribution.