1810
PDFF and R2* Reconstruction Error Mapping using Cramér-Rao Lower Bounds for Quality Assessment In-Vivo1University of Oxford, Oxford, United Kingdom, 2Perspectum Ltd, Oxford, United Kingdom
Synopsis
Keywords: Quantitative Imaging, Relaxometry
Image analysts would welcome a measure of proton density fat fraction (PDFF) and R2* mapping error for image quality assessment in-vivo. This work adopts prior methodology using Cramér-Rao lower bound formulation and applies it to PDFF and R2* precision mapping in-vivo. The method is demonstrated in a software phantom and on one subject with fatty liver. The calculated maps agree with the ground truth and are informative in regions where the reconstruction signal model holds. The method should be extended to calculation of PDFF error maps.INTRODUCTION
Fatty liver and other chronic conditions motivate non-invasive quantification of fat and iron using MRI. Chemical shift-encoded (CSE-MRI) methods are established techniques for proton density fat fraction (PDFF) and R2* mapping, but are affected by the MRI acquisition, namely the number of echo times and Signal-to-Noise Ratio (SNR).Image analysts would welcome a measure of precision bound to the estimated parameters for image quality assessment in-vivo. Error maps are also useful to gauge real change, whether it be spatial heterogeneity or longitudinal effects. Metrics like R-Squared and Normalised Residual Sum of Squares (NRSS) have been proposed1, but have co-dependencies with the estimated parameters, may need to be re-calibrated, and have uninterpretable units.
The Cramér-Rao lower bound (CRLB) has been used in the context of PDFF and R2* reconstruction for theoretical design of optimal acquisition protocols2 and reconstruction algorithms3. This work adopts prior methodology developed for T1 and T2* (1/R2*) precision mapping in the myocardium4 based on the CRLB formulation and applies it to PDFF and R2* precision mapping in-vivo.
METHODS
Parameter mapping (water, fat, R2*) assumed a phase-constrained water-fat signal model (i.e., common initial phase for water and fat)5,6, single-R2* and a six-peak liver fat spectrum7. Fitting was performed using a complex nonlinear least-squares solver (lsqcurvefit in MATLAB, MathWorks, Inc) initialised using a graph-cut method with an unconstrained-phase signal model8,9. Real and imaginary parts of the signal were split during fitting.The aim was to derive, at each voxel, the standard deviation (SD) of the water, fat and R2* by computing the (square root of the diagonal of the) covariance matrix, which is obtained by inverting the Fisher Information Matrix (FIM) under Gaussian noise10. The raw data noise variance estimated from the complex-valued fitting residuals4. The Jacobian was analytically derived for the signal model and was evaluated at the estimated parameters.
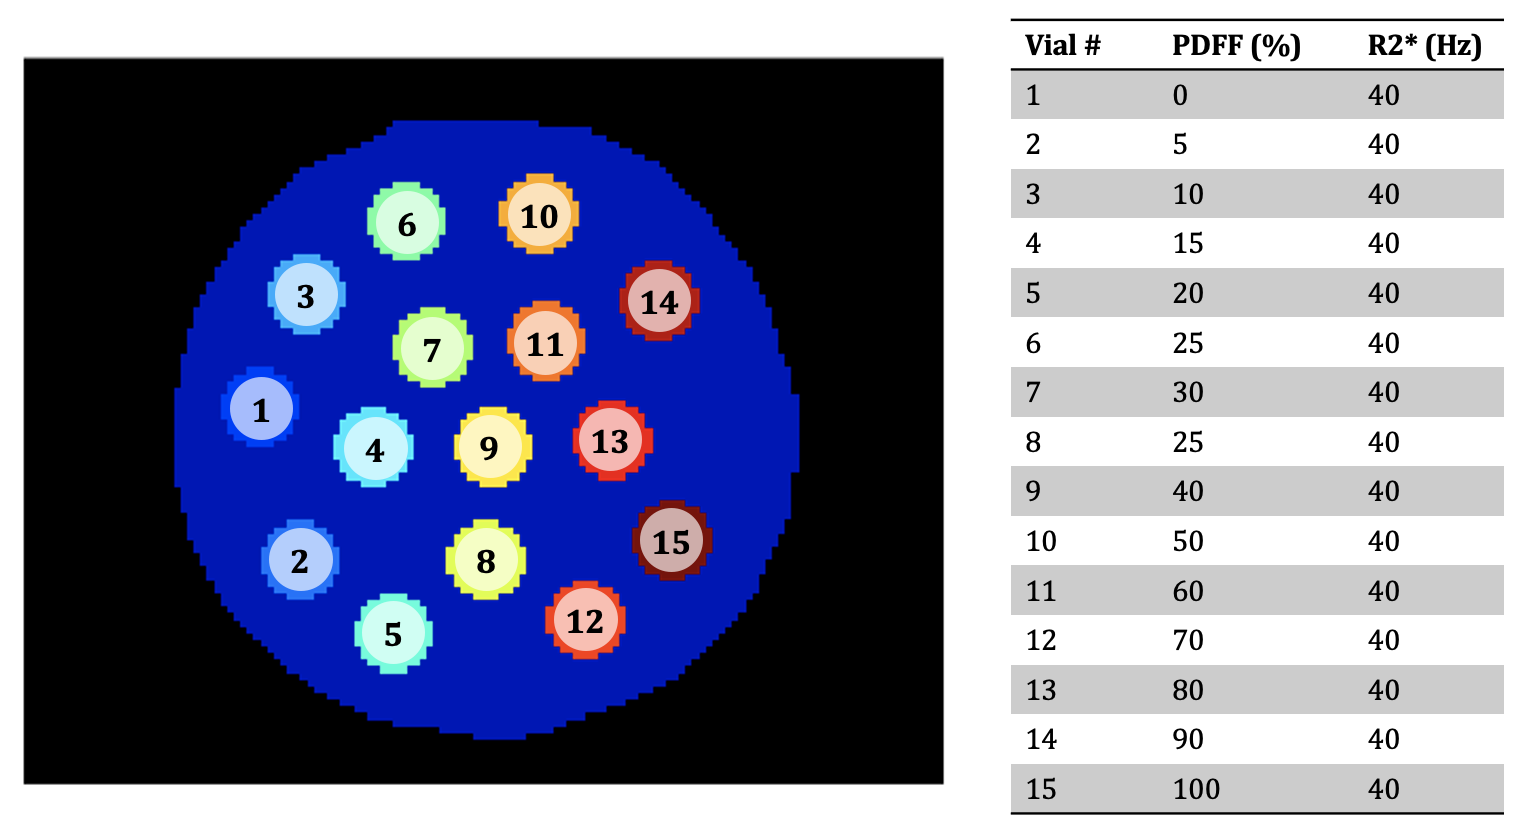
A software phantom was created to test error mapping under simulated conditions. The phantom was flood-filled and had vials with multiple combinations of PDFF and R2* (Figure 1). Field map = 25 Hz and phase offset = π/4 rad were set throughout. Each vial had 112 pixels. A multi-echo image set was simulated at 3 T using 6 echo times, TE1 = 1 ms, DTE = 1.2 ms. Gaussian noise was added to give SNR=30. 30 repeats were simulated so that the true standard deviation could be obtained for comparison.
The method is also demonstrated in-vivo on a subject with fatty liver, scanned using a multi-echo gradient echo protocol with 8 echo times, TE1 = 2.4 ms, DTE = 2.4 ms, flip angle = 15 deg, at 1.5 T (Siemens Healthineers). 7 repeats were acquired so that the true standard deviation could be obtained for comparison.
RESULTS
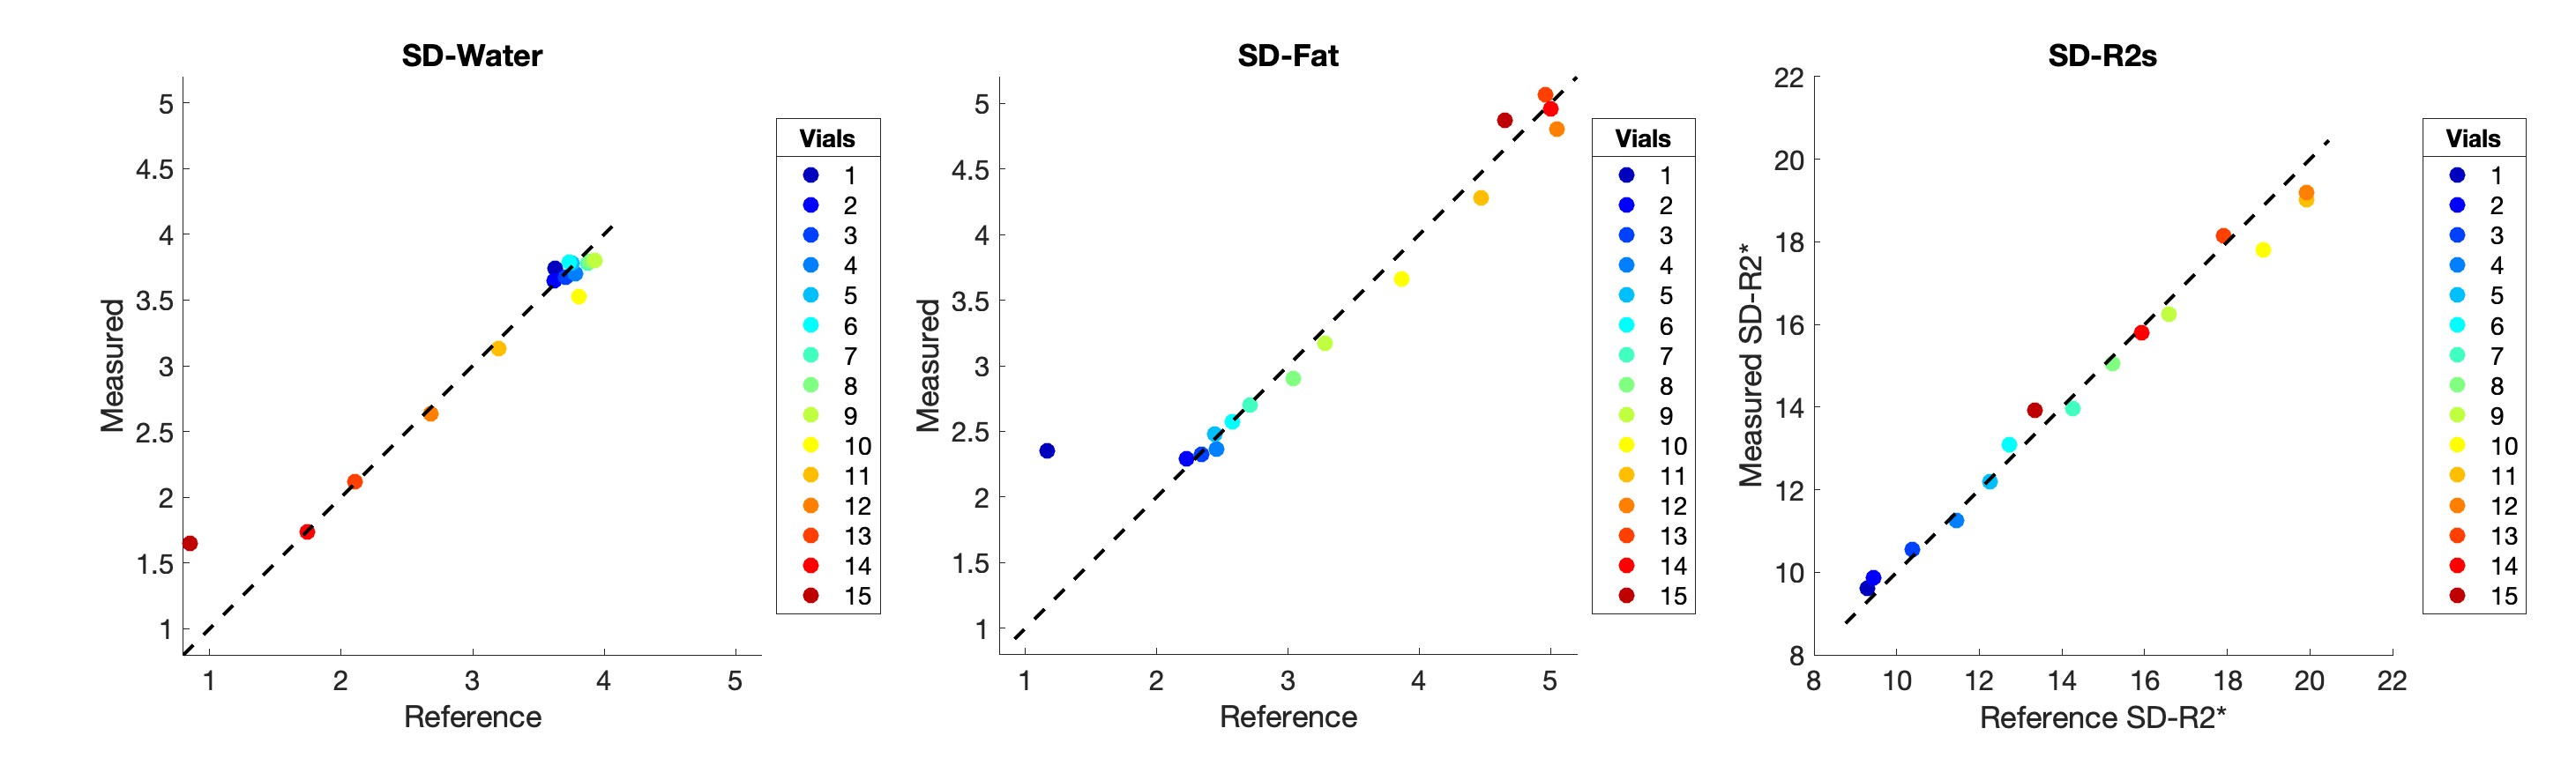
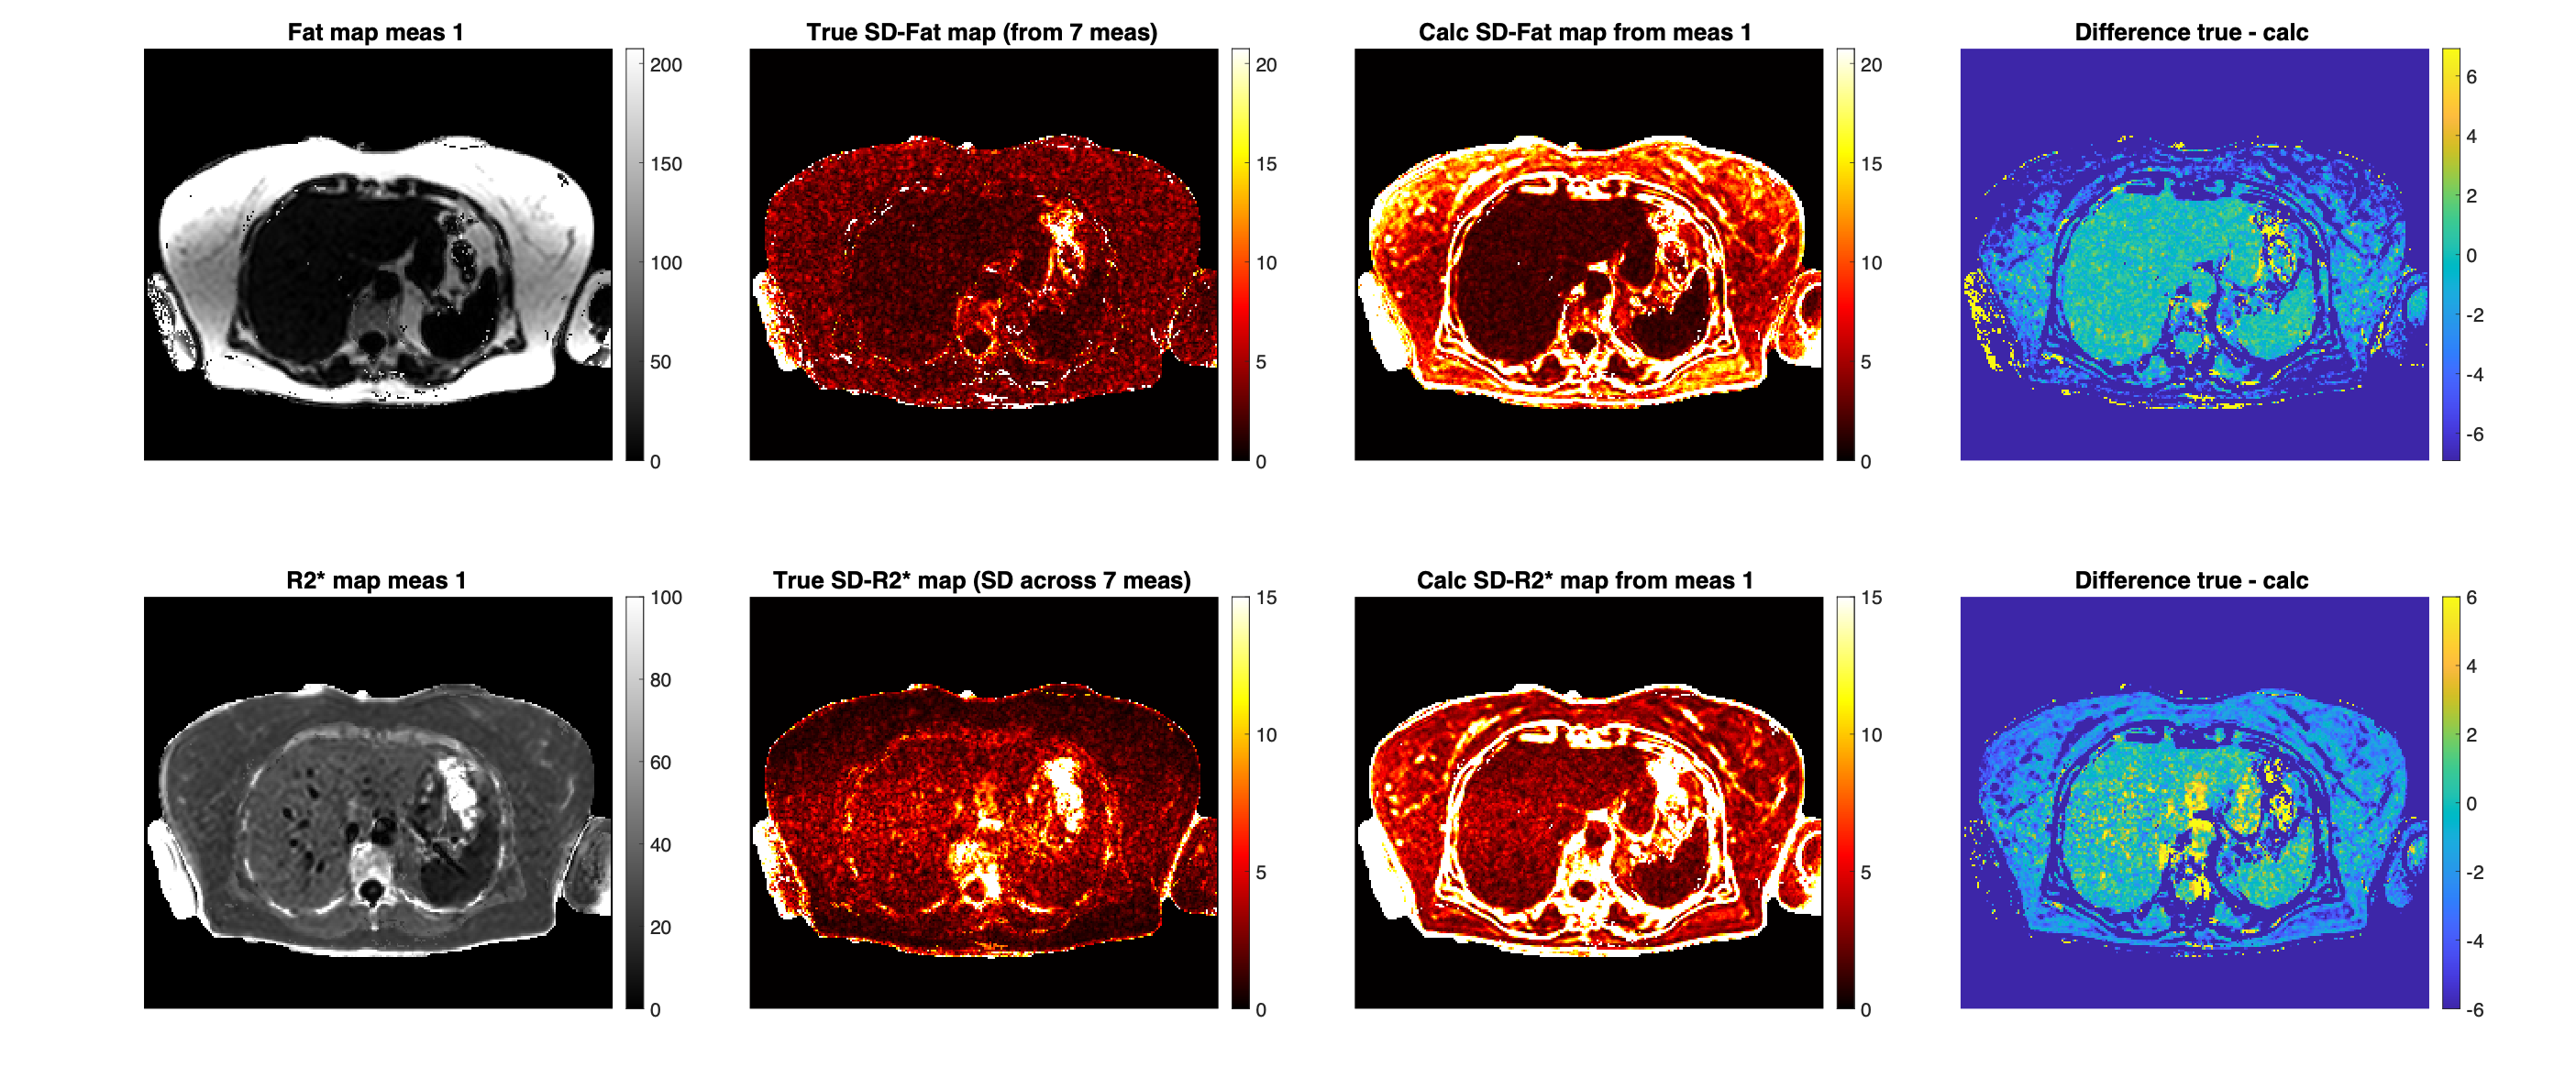
Figure 2 shows for SNR=30 the true SD over repeats vs calculated SD values. The mean values within each vial were computed. The calculated SD values show agreement with the reference SD values computed across 30 repeats.Figure 3 shows precision maps in-vivo for a subject with 7 repeat acquisitions. True SD maps are shown, as well as calculated SD maps using measurement 1. The values show agreement in the liver and other structures containing no fat like the spleen.
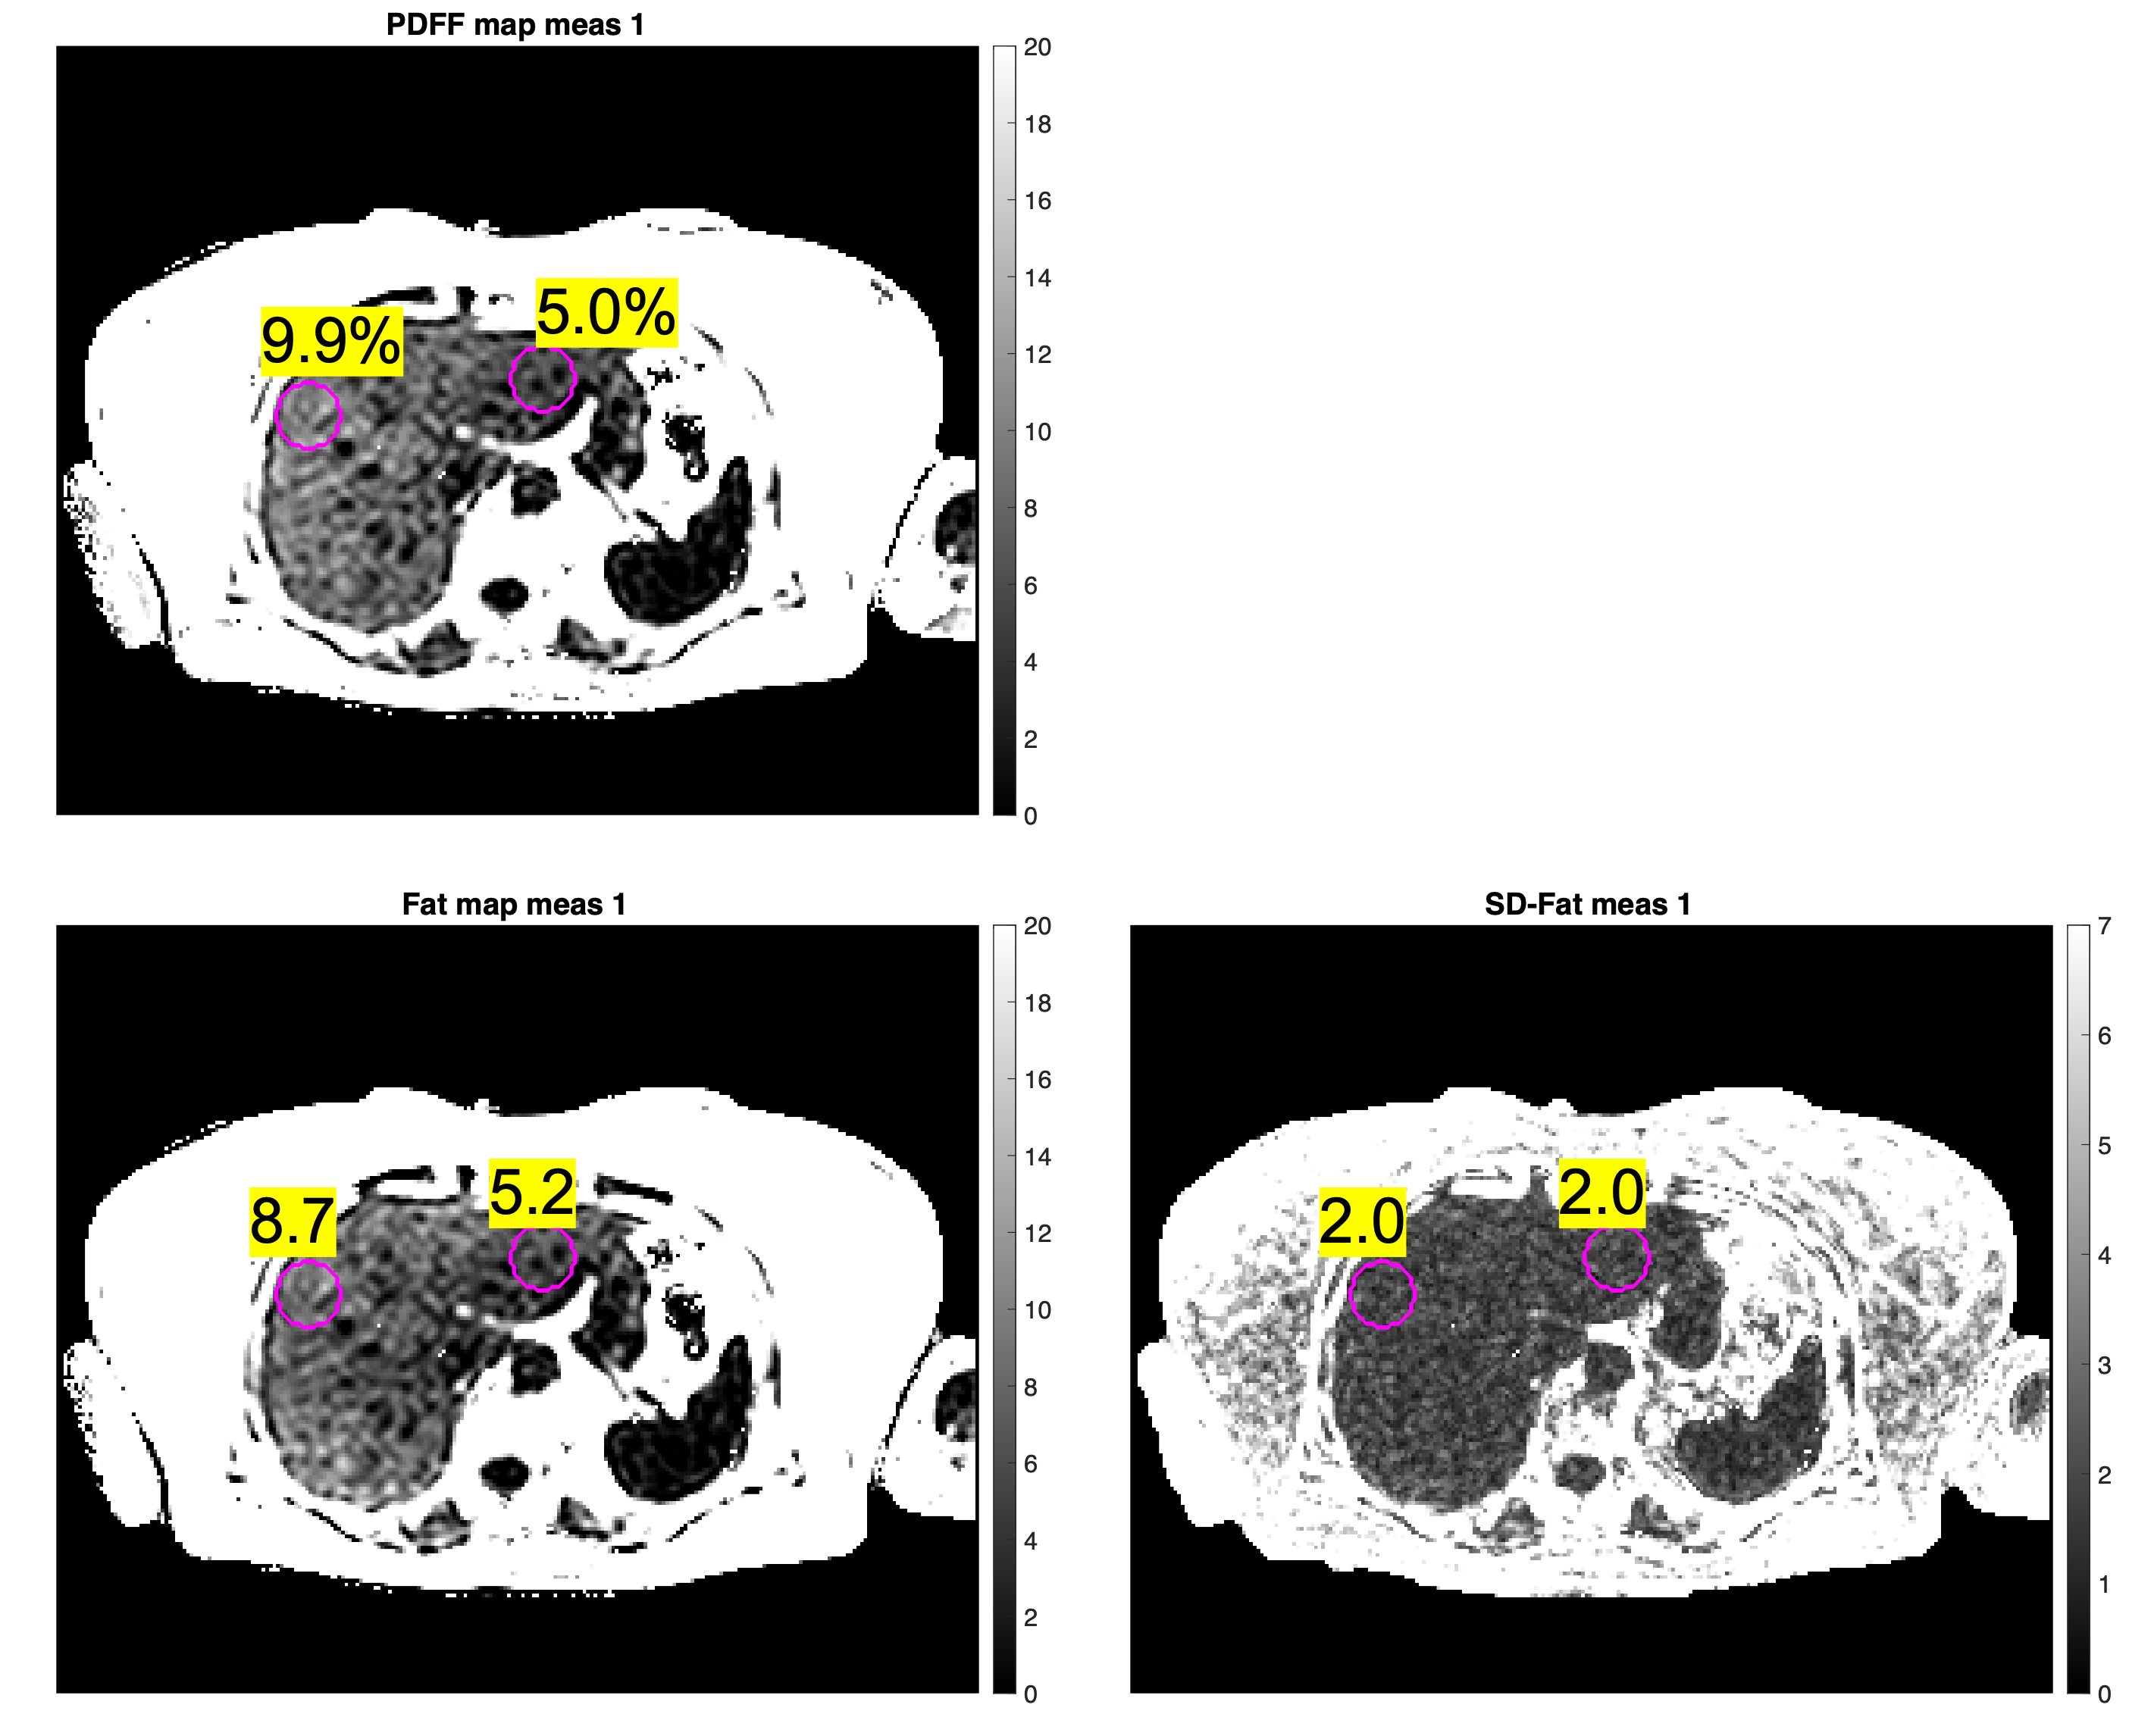
Figure 4 shows heterogeneity assessment in the liver using the PDFF map and the calculated SD-Fat map from measurement 1. The right lobe shows 9.9% PDFF while the left lobe shows 5.0% PDFF. The SD-Fat values at those locations suggests that real heterogeneity is more likely than artefactual heterogeneity caused by the noise in the raw data.
DISCUSSION
One assumption used was that our estimator is minimum variance and unbiased. For any biases, for instance a discrepancy between the fat model used and the true fat spectrum of the voxel, or any remaining PDFF noise bias near 0% and 100%, or other unaccounted phase effects, the method may overestimate the noise, as seen in Figure 2 in the 0% and 100% PDFF vials, and in Figure 3 in the difference between the true SD and calculated SD maps in subcutaneous fat.The method will be extended to SD-PDFF estimation to better inform image analysts. This may be achieved by either numerical error propagation or by reformulation of the signal model as function of PDFF11. In this work we chose to explore base parameters, i.e. water and fat.
The assumption of Gaussian noise simplifies the expression of the FIM. While the method could be extended to magnitude fitting, Rician noise distribution should be accounted for in the FIM for low SNR and magnitude fitting12.
Measurements taken over region-of-interest (ROI) increase confidence in the measurements. SD should decrease accordingly, proportionally to the square root of the number of voxels in the ROI to a first approximation4.
CONCLUSION
Error mapping is demonstrated for PDFF/R2* reconstruction and has the potential to help image analysts to assess the quality of maps.Acknowledgements
The authors thank the Engineering and Physical Sciences Research Council (EPSRC) for funding via a doctoral studentship (project reference 2280970).References
1. Weaver JM, Roberts, Nathan T., Hernando D, Reeder SB. Confidence Maps for Reliable Proton Density Fat-Fraction Estimation in the Presence of Low SNR. In: ; 2022:2285. Accessed October 7, 2022. https://archive.ismrm.org/2022/2285.html
2. Pineda AR, Reeder SB, Wen Z, Pelc NJ. Cramér-Rao bounds for three-point decomposition of water and fat. Magn Reson Med. 2005;54(3):625-635. doi:10.1002/mrm.20623
3. Hernando D, Kramer JH, Reeder SB. Multipeak fat-corrected complex R2* relaxometry: Theory, optimization, and clinical validation: R2* Relaxometry Using Complex Reconstruction. Magn Reson Med. 2013;70(5):1319-1331. doi:10.1002/mrm.24593
4. Kellman P, Arai AE, Xue H. T1 and extracellular volume mapping in the heart: estimation of error maps and the influence of noise on precision. J Cardiovasc Magn Reson. 2013;15(1):56. doi:10.1186/1532-429X-15-56
5. Liu CY, McKenzie CA, Yu H, Brittain JH, Reeder SB. Fat quantification with IDEAL gradient echo imaging: Correction of bias fromT1 and noise. Magn Reson Med. 2007;58(2):354-364. doi:10.1002/mrm.21301
6. Yu H, Reeder SB, McKenzie CA, et al. Single acquisition water-fat separation: Feasibility study for dynamic imaging. Magn Reson Med. 2006;55(2):413-422. doi:10.1002/mrm.20771
7. Hamilton G, Yokoo T, Bydder M, et al. In vivo characterization of the liver fat 1 H MR spectrum. NMR Biomed. 2011;24(7):784-790. doi:10.1002/nbm.1622
8. Hernando D, Haldar JP, Sutton BP, Ma J, Kellman P, Liang ZP. Joint estimation of water/fat images and field inhomogeneity map. Magn Reson Med. 2008;59(3):571-580. doi:10.1002/mrm.21522
9. Hernando D, Kellman P, Haldar JP, Liang ZP. Robust water/fat separation in the presence of large field inhomogeneities using a graph cut algorithm. Magn Reson Med. Published online 2009:NA-NA. doi:10.1002/mrm.22177
10. Diefenbach MN, Liu C, Karampinos DC. Generalized parameter estimation in multi-echo gradient-echo-based chemical species separation. Quant Imaging Med Surg. 2020;10(3):554-567. doi:10.21037/qims.2020.02.07
11. Roberts NT, Hernando D, Panagiotopoulos N, Reeder SB. Addressing concomitant gradient phase errors in time‐interleaved chemical shift‐encoded MRI fat fraction and R 2 * mapping with a pass‐specific phase fitting method. Magn Reson Med. 2022;87(6):2826-2838. doi:10.1002/mrm.29175
12. Karlsen OT, Verhagen R, Bovee WMMJ. Parameter estimation from Rician-distributed data sets using a maximum likelihood estimator: Application to t1 and perfusion measurements. Magn Reson Med. 1999;41(3):614-623. doi:10.1002/(SICI)1522-2594(199903)41:3<614::AID-MRM26>3.0.CO;2-1
Figures