1803
A Machine Learning based Preoperatively Grading Rectal Method with Continue Time Random Walk DWI Model.
Zhijun Geng1, Shaolei Li2, Yunfei Zhang2, Yongming Dai2, and Chuanmiao Xie1
1Sun Yat-sen University Cancer Center, Guangzhou, China, 2MR Collaboration, Central Research Institute, United Imaging Healthcare, Shanghai, China
1Sun Yat-sen University Cancer Center, Guangzhou, China, 2MR Collaboration, Central Research Institute, United Imaging Healthcare, Shanghai, China
Synopsis
Keywords: Quantitative Imaging, Machine Learning/Artificial Intelligence
Machine learning offers a principled approach for developing automatic algorithms for analysis of high-dimensional biomedical data. The continuous-time random-walk model (CTRW) is novel non-Gaussian diffusion model that provides promising evidence indicating a possible link between voxel-level spatiotemporal diffusion heterogeneity and microscopic intravoxel tissue heterogeneity giving the model advantages in diagnosing many diseases1. In this study, we apply a machine-learning algorithm, the principal component analysis (PCA), for quantitative automatic diagnosis to grade rectal cancer using parameters from CTRW model. Our study shows that PCA has the potential to grade rectal cancer with higher accuracy than the original parameters.Introduction
The CTRW is a relatively new and advanced DWI technique which recognizes intravoxel diffusion heterogeneity in both time and space1. By probing the underlying microstructural and topological features of biological tissue, the CTRW model offers substantial advantage in differentiating low- versus high-grade tumors. Recent development in decision-support systems based on machine learning (ML) algorithms have shown the potential to performing complex tasks that are currently assigned to specialists to improve diagnostic accuracy. Principal Component Analysis (PCA) is a popular tool for data dimensionality reduction in the presence of complex correlation structure by creating new summary variables, principal components (PCs), the optimal, uncorrelated linear combinations of the original variables, maximizing possible variance among all linear combinations of the original variables. In this study, we evaluate the diagnostic performance of machine learning algorithms of Principal Component Analysis (PCA) in grading rectal cancer based on CTRW model parameters.Methods
A total of 27 patients with 14 low-grade (grade 1 and 2) and 13 high-grade (grade 3) were recruited into this prospective study. All patients received the MRI examination with a 3.0 T scanner (uMR 780, United-Imaging Healthcare, Shanghai, China). The parameters (D, α, and β) of the CTRW model were estimated by fitting,$$S(b) = S_0 E_{\alpha}(-(bD)^{\beta})$$
where Eα is a Mittag-Leffler function of the α order, β corresponds to spatial diffusion heterogeneity, and both α and β are bounded in the range of 0 and 1. Principal component analysis with single and double principal components (PCs) were applied to both low- and high-grade groups with all three parameters with Python's Scikit-Learn machine-learning package was employed. The support vector machines (SVM) and receiver operating characteristic (ROC) analysis were performed for evaluating the diagnostic performance. The statistical differences between the two categories in the mean of principal component of the patches were evaluated by Pearson correlation analysis.
Results
The maps of parameters are calculated in the region of both low- and high-grade tumor as shown in Figure 1. The color maps are created using a jet colorbar from Matlab. Figure 2 displays the PCA results of both low- and high-grade with both principal components. It can be seen that first principal component is responsible for 68.55% variance and the second principal component causes 29.81% variance in the dataset. A linear SVM is used to classify low- and high-grade group and results in diagnostic accuracy (96.3%), sensitivity (100%) and specificity (92.9%). The same linear SVM is applied with original parameters and results in diagnostic accuracy (92.6%), sensitivity (100%) and specificity (85.7%). The performance of the PCA with single principal component and ROC analysis based on all four combinations of the CTRW parameters [(D,α,β), (D,α), (D,β), (α,β)] are computed. The results of PCA of four combinations in low- and high-grade groups (p-values < 0.05) are shown in Figure 3. The ROC analysis suggests that the combinations of (D,α,β) and (D,β) yield the largest AUC (0.978). The ROC analysis results are shown in Figure 4.Discussion
From the PCA with double principal components, collectively we can say that (68.55 + 29.81) 98.36% of the classification information contained in the feature set is captured by the first two principal components. This result agrees with the single principal analysis, since the combination of (D,β) gives the same AUC(0.978) as all three parameters ensemble. This can be interpreted as the α values of low- and high-graded tumors are not significantly different and therefore make almost no contribution to the total covariance. The CTRW model has only 3 parameters, and the advantage of PCA would be more significant when using more complicate models with more parameters as PCA can project the original data onto lower-dimensional space while preserving as much of the data's variation as possible.Conclusion
Using machine-learning algorithms for classification with the CTRW model parameters, we have been able to well-differentiate low- and high-grade rectal cancer with an accuracy increased from 92.6% to 96.3%. With further validation, the machine learning algorithms are expected to enhance the capability of multi-parameters diffusion model such as CTRW model for non-invasive in vivo rectal cancer grading.Acknowledgements
No acknowledgement.References
1. Karaman MM, Sui Y, Wang H, et al. Differentiating low- and high-grade pediatric brain tumors using a continuous-time randomwalk diffusion model at high b-values. Magn Reson Med. 2016;76(4):1149-1157.Figures
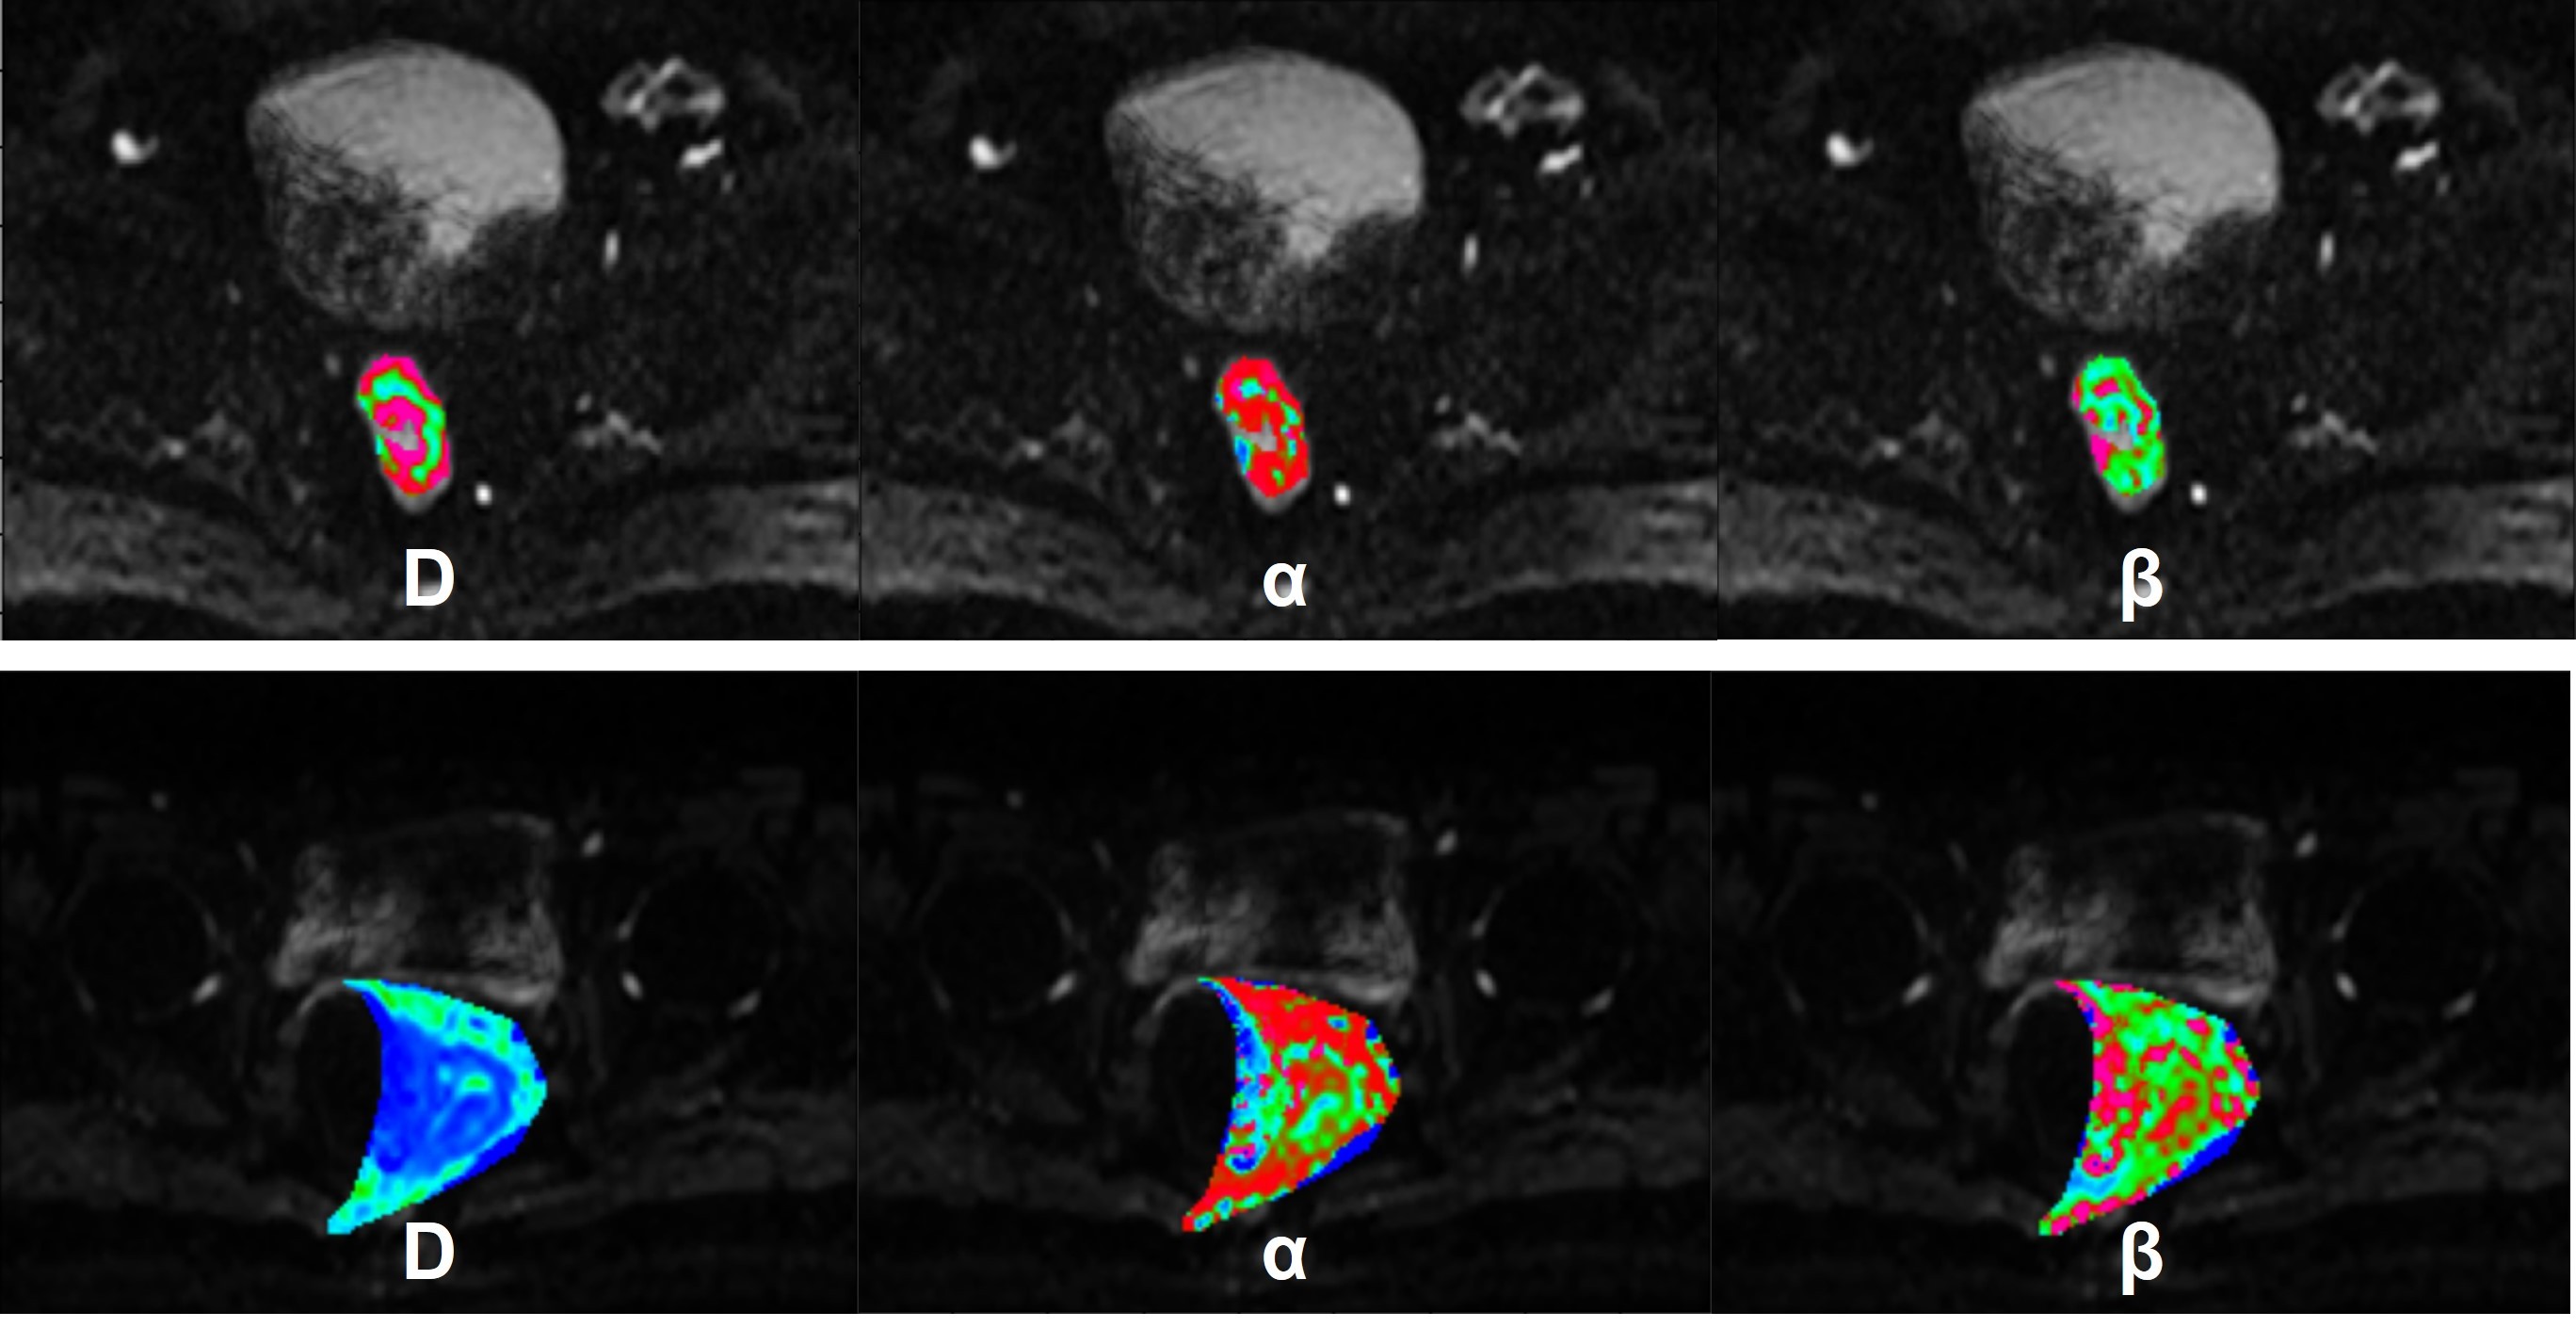
Figure 1: Examples of DWI image of low-grade (top row) and high-grade (bottom row) with b = 500 s/mm2. Maps of D, α, and β from a CTRW model are demonstrated by color in the tumor region are overlapped in DWI images.
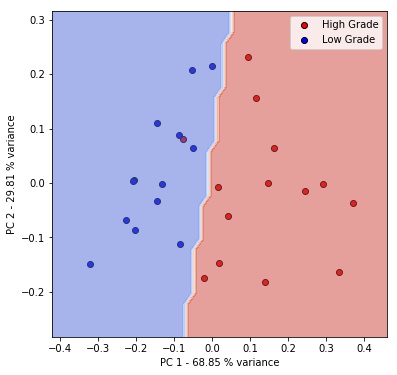
Figure 2: 2D scatter plots of the first and second principal components (PC1 and PC2) of low-grade (blue) or high-grade patients (red). The SVM decision boundary separates space into low-grade region (blue) and high-grade region (red).
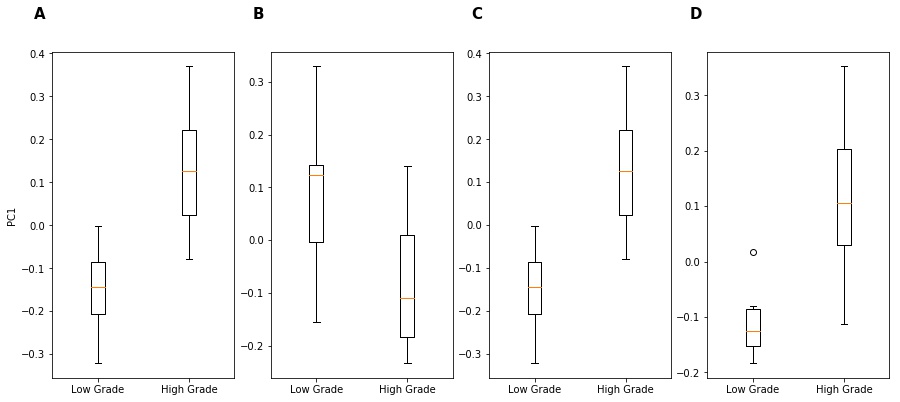
Figure 3: Box plots of first principal component (PC1) from PCA (A) D, α, and β (B) D and α (C) D and β (D) α and β.
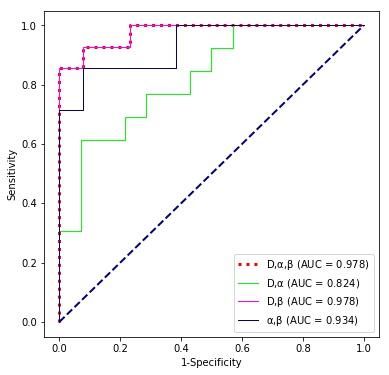
Figure 4: ROC curves of different combinations of parameters, (D,α,β), (D,α), (D,β), and (α,β), for discriminating low- and high-graded tumors.
DOI: https://doi.org/10.58530/2023/1803