1802
Multiparametric MRI Based Habitat Imaging for Differentiating Lymph Node Metastasis in Lung Adenocarcinoma
Gaofeng Shi1, Qi Wang1, Hui Feng1, Hui Liu1, Mengyu Song1, Xinyue Liang2, and Yongming Dai2
1Department of Radiology, Fourth Hospital of Hebei Medical University, Shijiazhuang, China, 2Central Research Institute, United Imaging Healthcare, Shanghai, China
1Department of Radiology, Fourth Hospital of Hebei Medical University, Shijiazhuang, China, 2Central Research Institute, United Imaging Healthcare, Shanghai, China
Synopsis
Keywords: Quantitative Imaging, Cancer
Analysis of lymph node metastasis (LNM) in lung cancer is vital for disease detection and treatment planning optimization. Multi-parametric MRI was widely used not only to characterize tumor size and anatomy, but also to assess the tissue metabolism and physiology. Conventionally, these are evaluated independently and/or are combined into an average parameter for the entire tumor, while the spatial information within the lesions was discarded. Habitat imaging allows to capture these subtle differences in tumors. In this context, a multi-parametric MRI based habitat analysis was approved to predict the LNM status.Introduction
It has been well documented that lung adenocarcinoma (LUAD) is highly invasive, metastatic and heterogenous.1 LNM is associated with poor prognosis of tumor patients. The prognosis of patients with LNM is poorer than those of patients without such metastases (NLM). A key determinant of appropriate therapy for lung cancer patients depends on the LNM status. Therefore, accurate assessment of LNM would prove extremely useful in assessing prognosis and decisive for treatment planning optimization in lung cancer. Computed tomography (CT) and magnetic resonance imaging (MRI) are commonly used for the LNM identification. However, conventional CT and MRI focus on the morphological criteria, consensus diagnose could sometimes be challenging. Positron emission tomography (PET) is used for nodal staging assessment of NSCLC, while it is not widely available. Recently, a data-driven habitat analysis as mapping subregions of the tumor with differential imaging parameters has showed great potential in the detection of lung cancer and the response to therapy. MRI offers a multidimensional characterization of lung cancer and yields insight into biophysical properties. However, to the best of our knowledge, the multi-parametric radiation-free MRI based habitats analysis for predicting the LNM status remains unclear. The aim of this study is to predict LNM in LUAD patients using habitat analysis based on multi-parametric MR imaging.Methods
This retrospectively study examined LUAD patients who underwent chest MRI (3T, uMR780, United Imaging Healthcare, Shanghai, China) with intravoxel incoherent motion diffusion-weighted imaging (IVIM-DWI) (b = 0, 10, 20, 30, 50, 80, 100, 200, 400 and 800 s/mm2) and oxygen-enhanced MRI with ultrashort echo time (OE-UTE). Based on the presence or absence of LNM, patients were divided into the LNM group (n=13) and NLM group (n=38). IVIM data were processed according to the following equation:2Sb/S0 = (1-f)e-bD+fe-bD*(1)
where D was the true diffusion coefficient; D* was the pseudodiffusion coefficient representing perfusion-related diffusion; f was the perfusion fraction.
The percent signal enhancement (PSE) map from OE-MRI of each patient was obtained with the voxel-wise approach approved in Liu et al.3 Tumor volumes of interest (VOIs) were manually drawn slice by slice by a radiologist with 10-years’ experience on T2W images. The voxels in the VOIs from f maps and PSE maps were aggregated into different clusters using the K-means clustering algorithm in Scikit-Learn python package. The tumor volume and volume fraction of every habitat were calculated and recorded as mean value with standard deviation (SD). Mann-Whitney U test were used to assess the differences in fraction of the subregions between different groups. The classification performance was compared using the receiver operating characteristic (ROC) analysis with the area under the curve (AUC).
Results
Four habitats were identified within the lesion: the normoxia habitat with high f and high PSE (habitat 1), inflammatory habitat with low f and high PSE (habitat 2), the hypoxia habitat with high f and low PSE (habitat 3), and the necrosis habitat with low f and low PSE (habitat 4), respectively. The volume fraction of the hypoxia habitat was higher in LNM group compared with NLM group ( and , P = 0.024). The AUC of the volume fraction of hypoxia habitat (AUC = 0.834) was significantly higher than that of necrosis habitat (AUC = 0.686), normoxia habitat (AUC = 0.789) and inflammatory habitat (AUC = 0.653) for LNM predicting.Discussion
Hypoxia and ischemia appear to be key elements in the tumor progression, especially in metastasizing masses.4 Habitat analysis reflects subtly differences within a tumor rather than the conventional approaches that average MRI parameter for an entire lesion. With this study, the clinical relevance of the volume fraction in hypoxia subregion using the multi-parametric MRI based habitat analysis was demonstrated to identify the LNM status in LUAD. Some limitations of this study are needed to be addressed. First, patient population is relatively small. Besides, the accuracy of the habitat’s segmentation by biopsy or pathologic sampling was missing, however, unnecessary surgery should be avoided.Conclusion
In conclusion, a data-driven clustering approach is proposed to identify tumor hypoxia subregion within LUAD tumors based on f maps and PSE maps from multi-parametric MRI. The fraction of identified hypoxia habitat is a significant predictor of the presence or absence of LNM in LUAD.Acknowledgements
None.References
1.Chen, Z., Fillmore, C. M., Hammerman, P. S., Kim, C. F. & Wong, K. K. Non-small-cell lung cancers: a heterogeneous set of diseases. Nat Rev Cancer 14, 535-546, doi:10.1038/nrc3775 (2014).
2.Le Bihan, D. et al. Separation of diffusion and perfusion in intravoxel incoherent motion MR imaging. Radiology 168, 497-505, doi:10.1148/radiology.168.2.3393671 (1988).
3.Liu, H. et al. Pulmonary Functional Imaging for Lung Adenocarcinoma: Combined MRI Assessment Based on IVIM-DWI and OE-UTE-MRI. Front Oncol 11, 677942, doi:10.3389/fonc.2021.677942 (2021).
4.Rundqvist, H. & Johnson, R. S. Hypoxia and metastasis in breast cancer. Curr Top Microbiol Immunol 345, 121-139, doi:10.1007/82_2010_77 (2010).
Figures
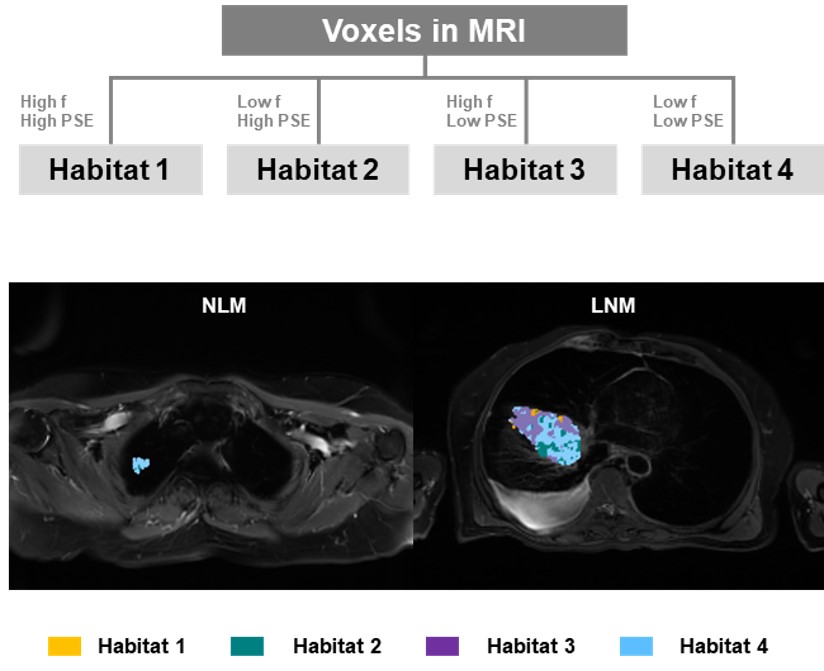
The
workflow diagram and the representative examples of the spatial habitat maps from
two patients in NLM group and LNM group.
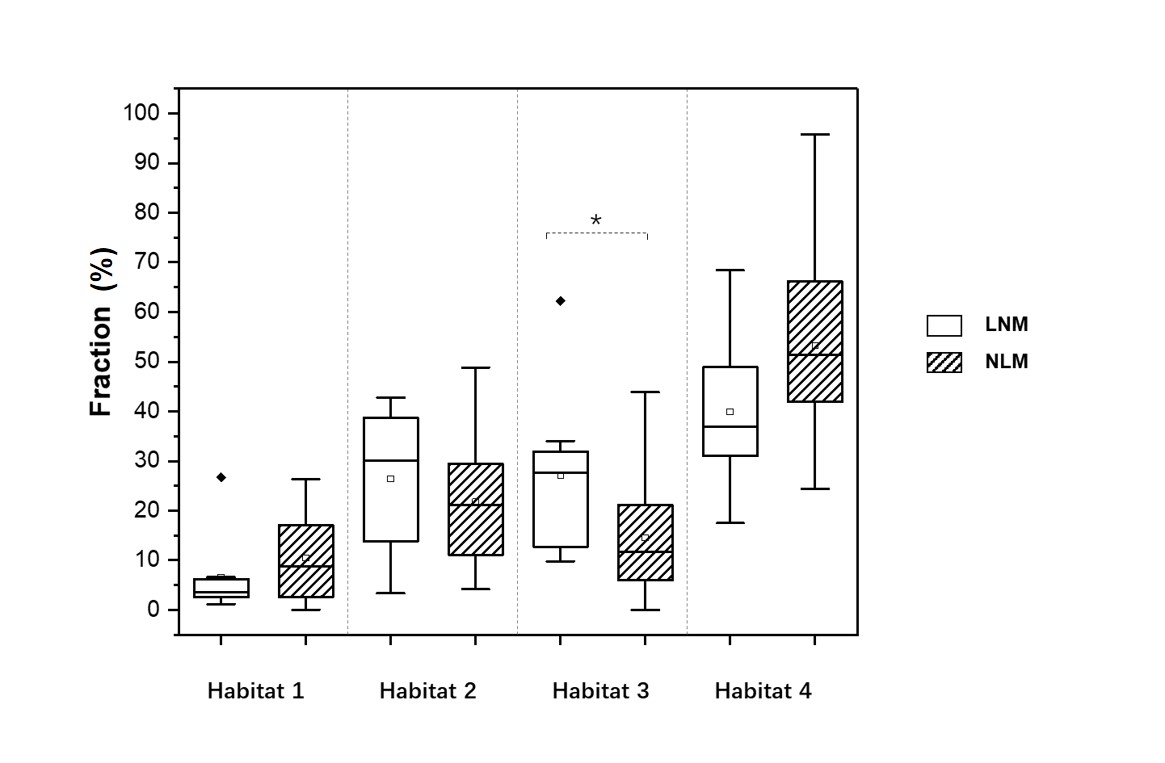
Box-and-whisker
plot shows distribution of the volume fraction in habitats of patients with or without
LNM. P values were obtained with
Mann-Whitney U test. ∗ = P <0.05.
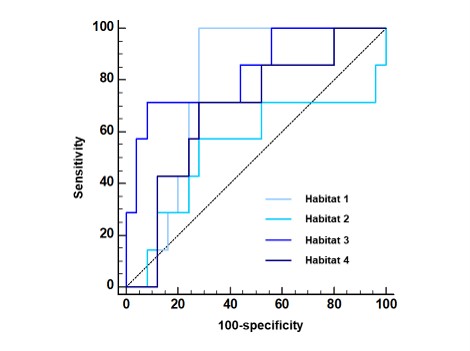
ROC
curves for discrimination of LNM status between four habitats in LUAD.
DOI: https://doi.org/10.58530/2023/1802