1800
Correlation of T1/T2/PD map and apparent diffusion coefficient for neoadjuvant therapy response evaluation in three breast cancer subtypes1Department of Radiology, The First Hospital of China Medical University, shenyang, China, 2GE Healthcare, Beijing, China, 3Guangzhou institute of technology, Xidian University, Guangzhou, China
Synopsis
Keywords: MR Fingerprinting/Synthetic MR, Breast
In this study, we evaluated and analyzed the potential correlation of first-order feature pairs from T1/T2/PD and ADC maps within different treatment response groups in locally advanced breast cancer patients undergoing neoadjuvant chemotherapy (NAC). In TNBC subtype, multiple features on ADC and PD maps strongly correlated only in pCR group, which may indicate PD map as complements to ADC for monitoring NAC response.Purpose
To evaluate the potential correlation of first-order feature pairs from T1/T2/PD and ADC maps, and analyze the correlation within different treatment response groups in locally advanced breast cancer patients undergoing neoadjuvant chemotherapy (NAC).Materials and Methods
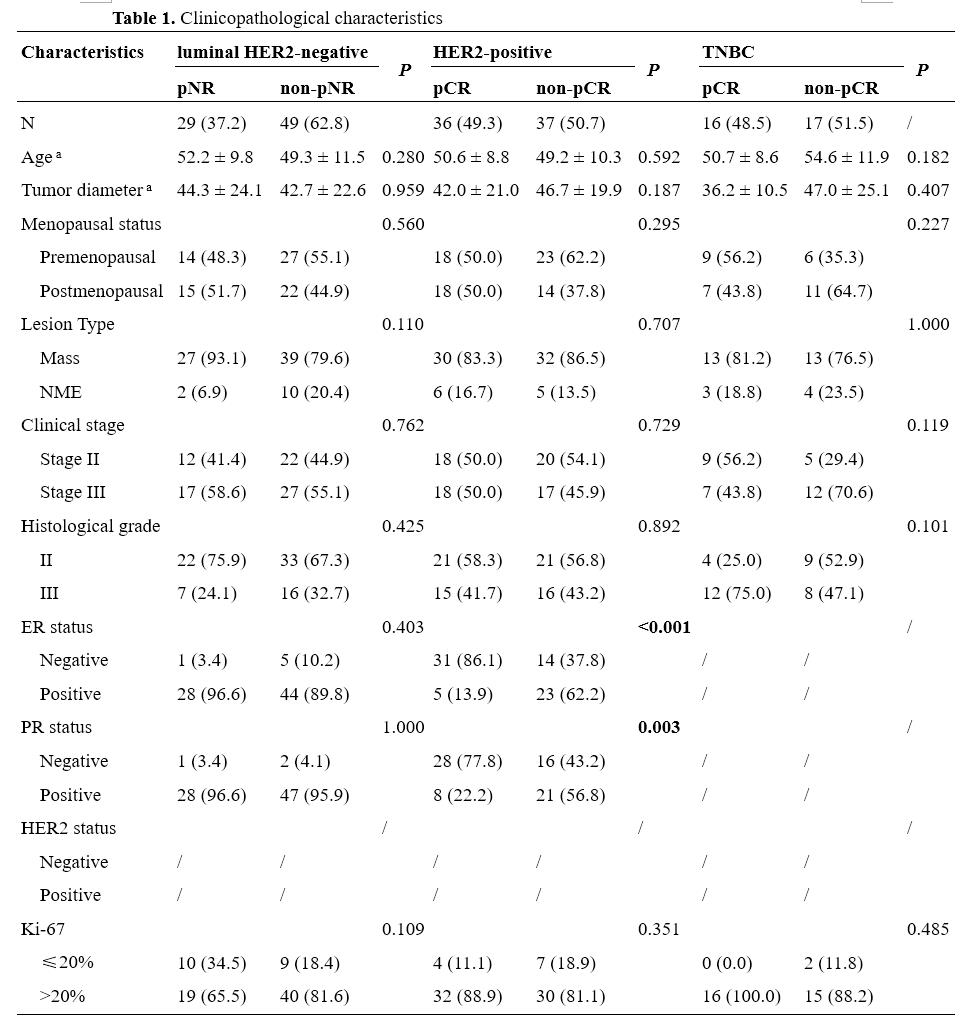
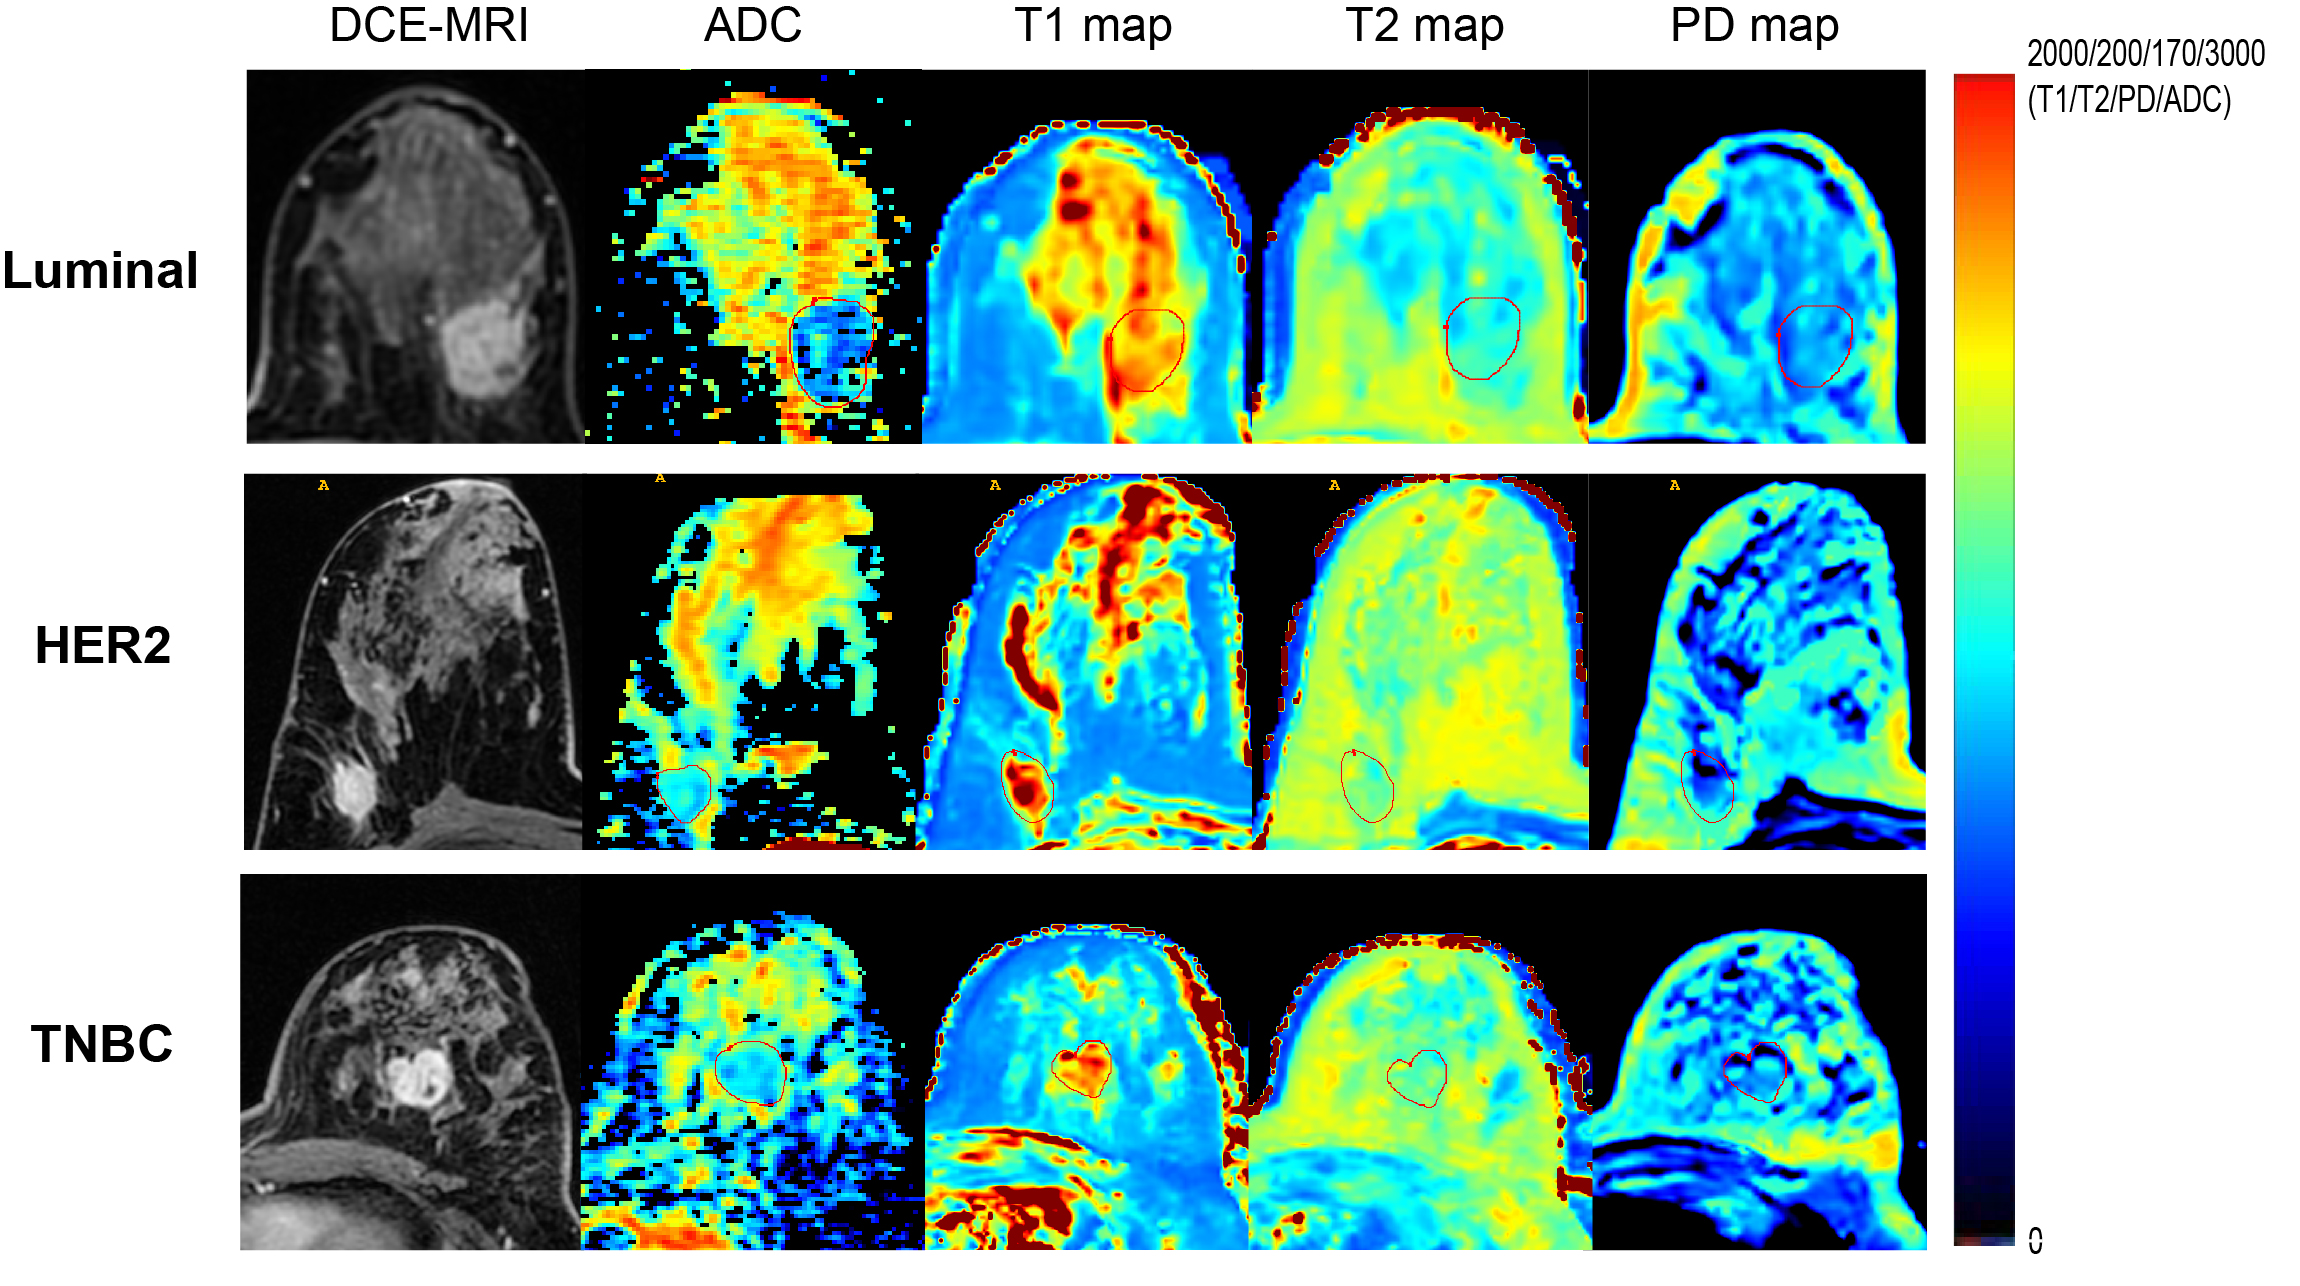
Between March 2019 and December 2021, 205 NAC-treated breast cancer patients with baseline MRI were enrolled. Patients were classified into two groups by the Miller-Payne–grade 1-2 indicated pNR and 5 pCR. Regarding clinical practice, we applied pNR and non-pNR to evaluate the response of luminal HER2-negative group for the low pCR rate of this subtype. HER2-positive and TNBC patients were subdivided into pCR and non-pCR groups [1]. MRI examinations were performed using a 3-T MRI scanner (Signa Pioneer, GE Healthcare, Milwaukee, USA) with a dedicated 8-channel bilateral breast coil, including T1WI, T2WI, synthetic MRI, diffusion-weighted imaging (DWI, b = 0, 50, 400, 800 s/mm2), and dynamic contrast-enhanced (DCE) sequences. Using ITK-SNAP (version 3.8.0, http://www.itksnap.org), regions of interest (ROIs) of tumor were manually segmented along the lesion on T1/T2/PD and ADC maps slice by slice respectively by one reviewer and then reviewed by another reviewer. An example of the ROI delineation on axial images is shown in Fig. 1. For each patient's MRI data, 11 first-order features were extracted from T1/T2/PD and ADC maps respectively. Spearman’s rank correlation coefficients were computed among each pair of identical radiomic features calculated on ADC and T1/T2/PD maps. Features were compared between different NAC treatment response groups, and their discriminatory power was evaluated by the receiver operating characteristic curves.Results
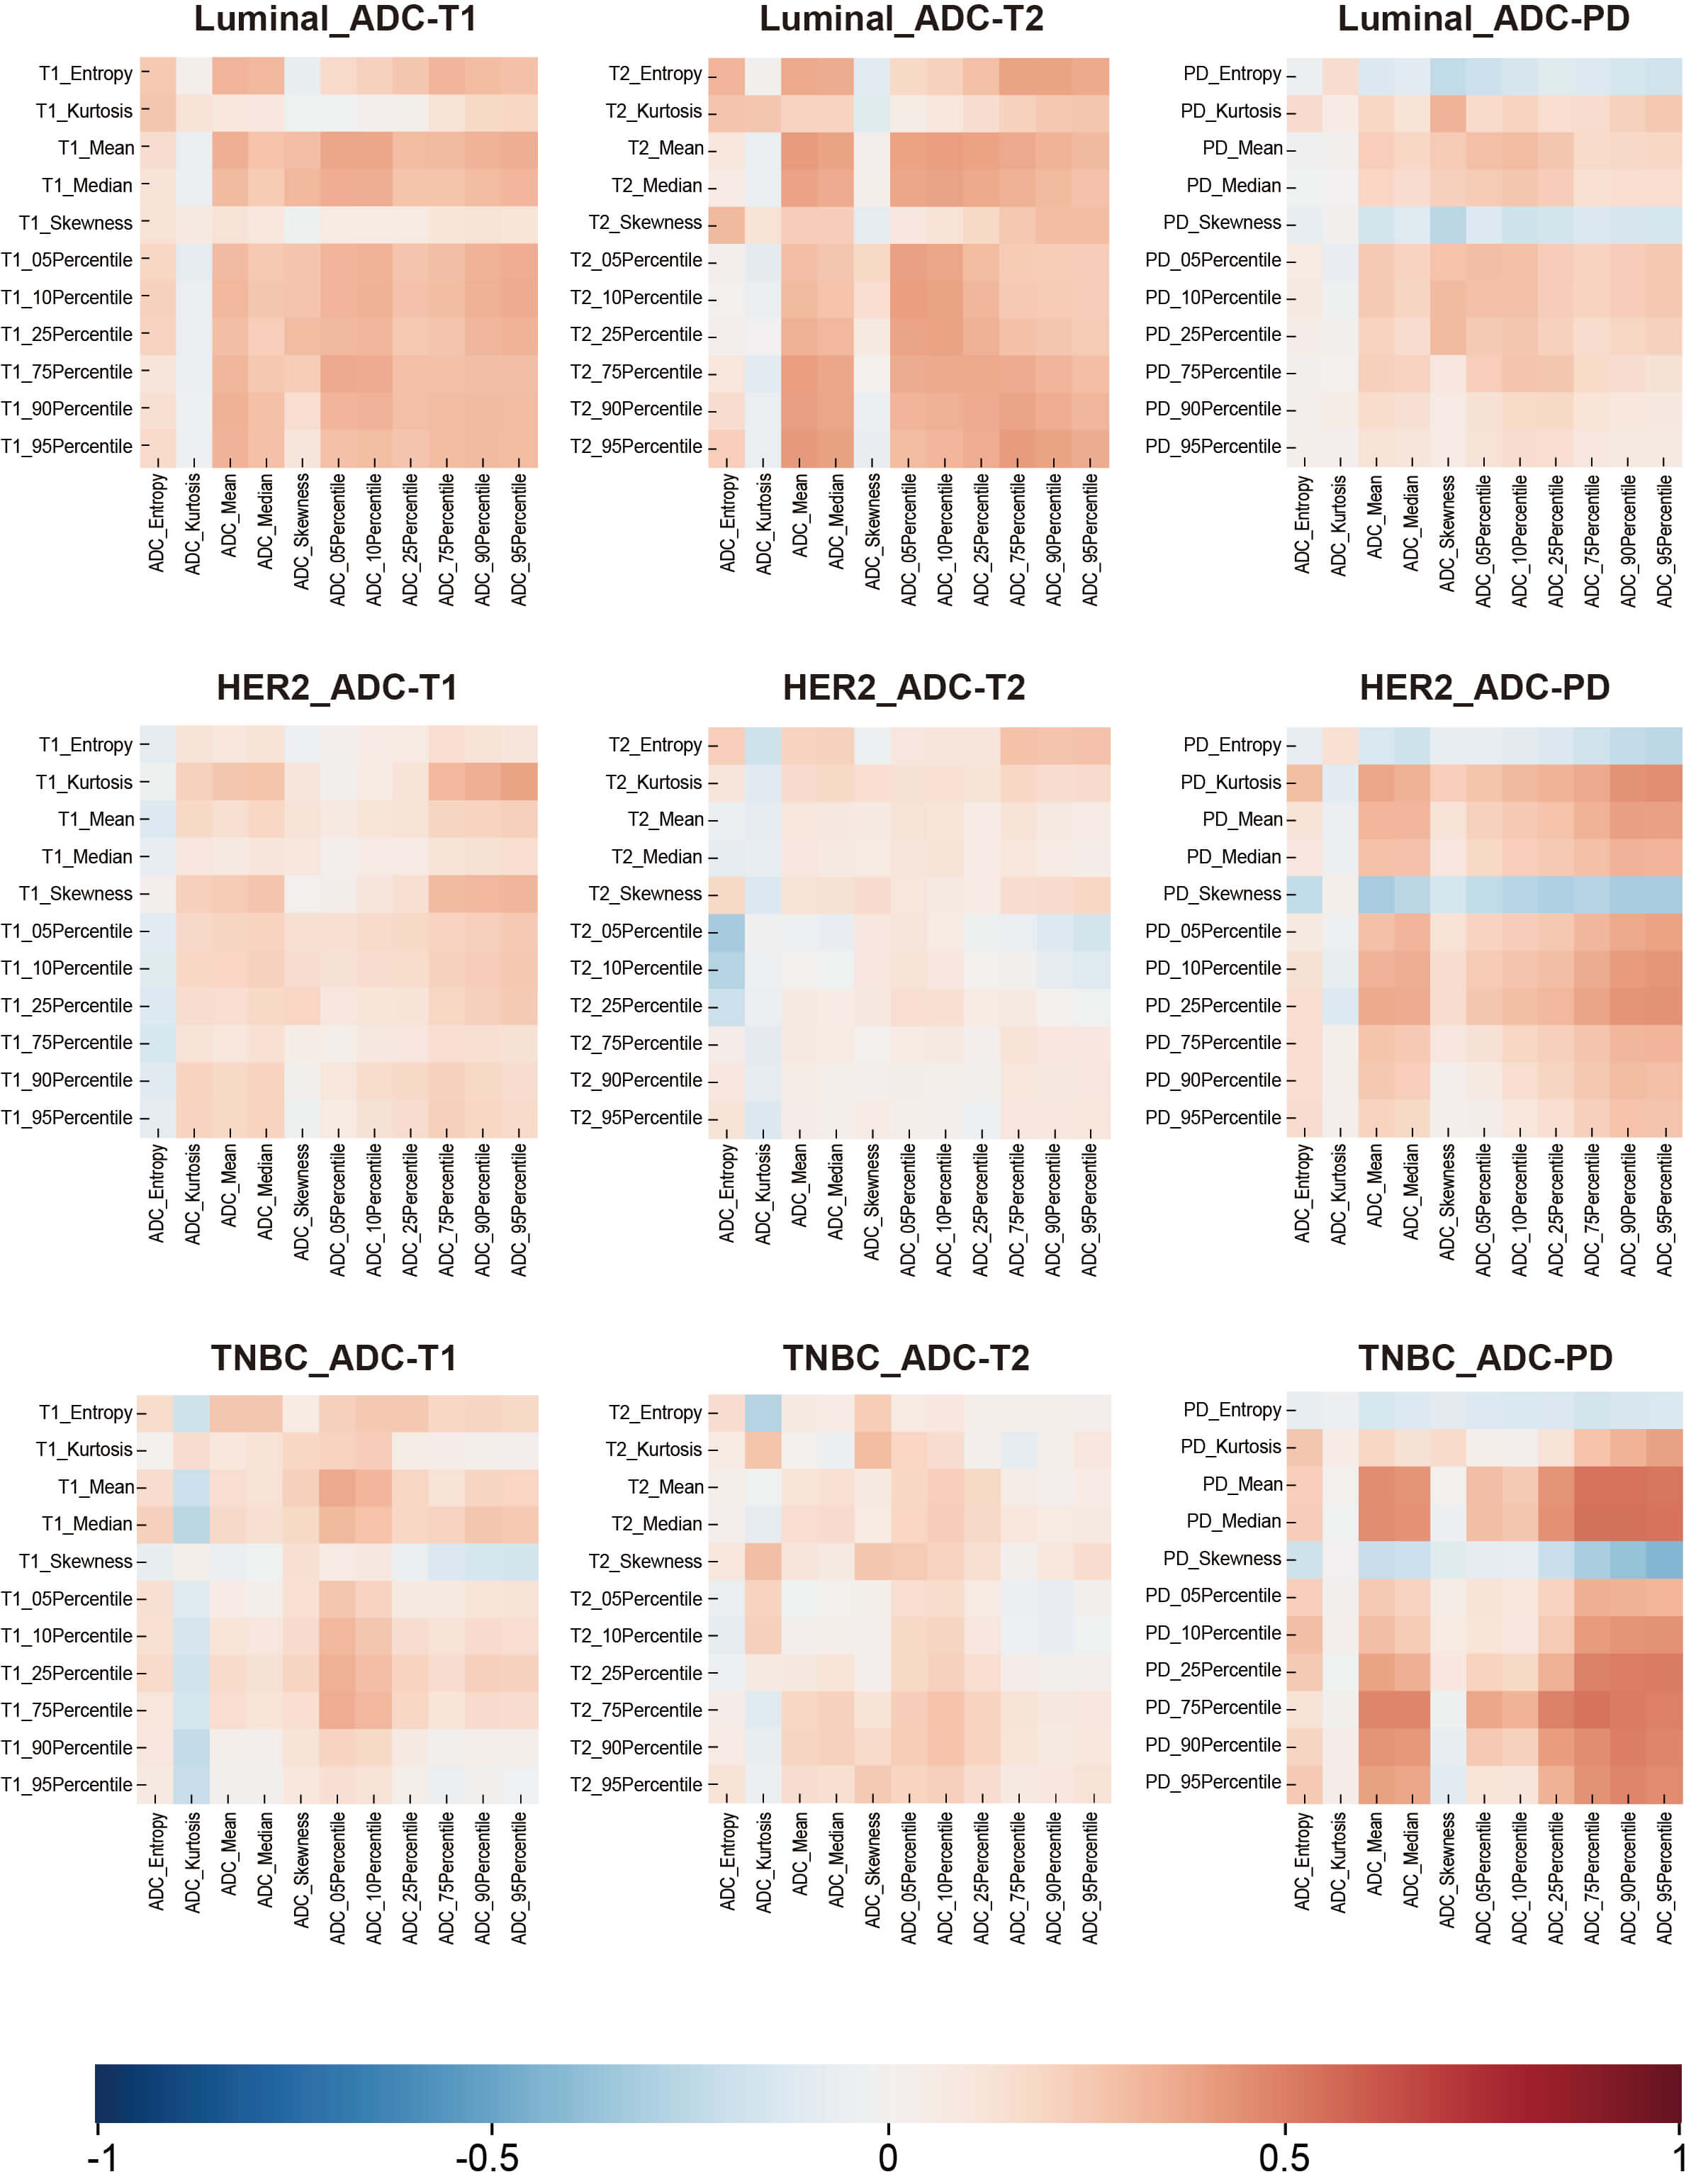
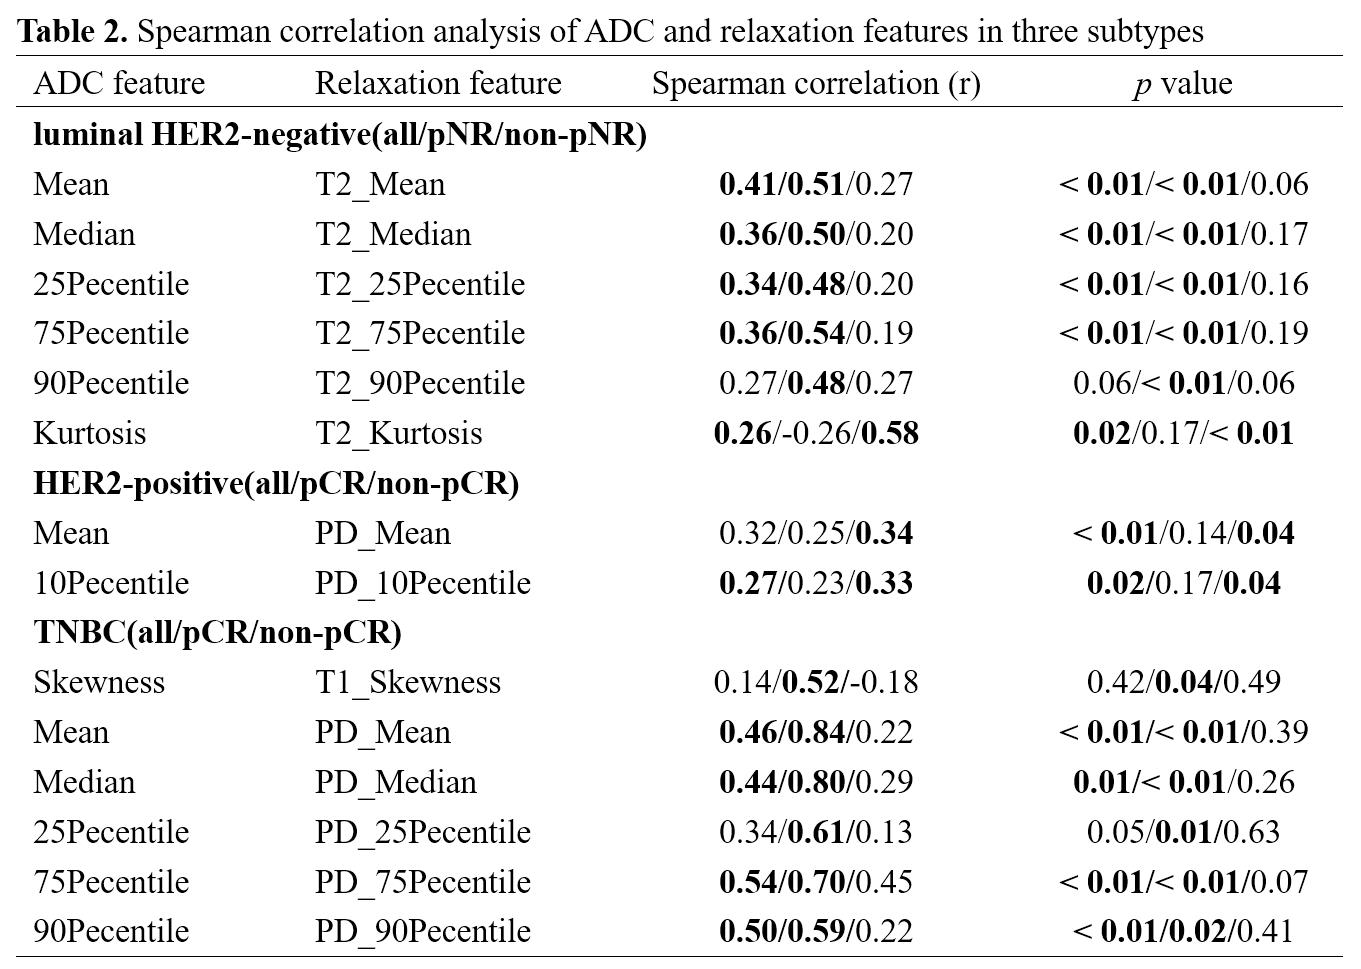
Of the 184 enrolled patients, 78 were luminal HER2-negative (42.4%), 73 were HER2-positive (39.7%) and 33 were TNBC (17.9%). The baseline characteristics of patients were summarized in Table 1. For all patients, 27 pairs of radiomic features presented a fairly weak correlation (r = -0.17 – 0.29, p < 0.05) out of 33 correlations, with Mean on ADC and PD map showing the highest correlation (r = 0.29, p < 0.01). Fig. 2 depicted the correlogram corresponding to the cross-correlation matrix for each subtype's 11 first-order radiomic features. For luminal HER2-negative subtype, the overall correlation was slightly higher than that of the whole population, regardless of whether in pNR or non-pNR group. There were no major differences between the two groups. As such, features between ADC and T2 map including Mean, Median, 75Percentile showed a moderate positive correlation in pNR group (r = 0.50 – 0.54, p < 0.05). However, in non-pNR group, only Kurtosis on ADC and T2 map demonstrated a moderate positive correlation (r = 0.58, p < 0.01). For HER2-positive subtype, there was no correlation in pCR group. On the contrary, in non-pCR group, we found a weak positive correlation in Mean and 10Pecentile on ADC and PD map (r = 0.34/0.33, p = 0.04/0.04). For TNBC subtype, no correlation was observed in non-pCR group. 5 out of 11 pairs of features on ADC and PD map were significantly correlated (r = 0.59 – 0.84, p < 0.05), including Mean, Median, 25Pecentile, 75Pecentile and 90Pecentile (Table 2). Fig. 3 illustrated representative fitted linear regression models between Mean and Median of ADC and PD map in pCR group (r = 0.84/0.80, p < 0.01), highlighting a strong direct correlation between this subgroup. Also, significant differences were seen in 4 features between each group in luminal-HER2 negative and HER2-positive subtypes, yielding moderate AUC (0.634 – 0.692).Discussion
Our study demonstrated weak or no correlation among T1, T2 and ADC maps of the primary breast cancer. In all patients, there is a consistently weak correlation between T1/T2/PD and ADC maps, indicating the overlap of the functions of T1, T2 and PD mapping. Weak correlation is caused by tumor heterogeneity. Considering that most heterogeneity of tumors comes from the difference of molecular subtypes [2], we further stratified analysis in three subtypes. The correlation between T1/T2/PD and ADC maps varies with molecular subtypes due to the homogenization of luminal subtype and pNR patients, while HER2-positive and TNBC are more invasive and heterogeneous [3]. Another possible explanation of inconsistency between T1, T2 and ADC is intratumoral hemorrhage, which is common in highly malignant lesion. Unlike T1 and T2, PD is a measure of proton density [4]. We found that quantitative features on ADC and PD maps were highly correlated in TNBC, which suggested that there was functional overlap between these sequences. Finally, the weak or no correlation between T1/T2 and ADC mapping indicates that there are differences in the ability to reflect the characteristics of tumor water molecules. So it can be used as a promising complementary technique for evaluating tumor imaging microenvironment without contrast agent, especially for HER2-positive and TNBC. In addition, we found that the baseline low T2 percentile could significantly distinguish pNR in luminal HER2-negative subtype, and skewness of T1 can significantly distinguish pCR in HER2-positive subtype.Conclusion
The diverse correlation between ADC and relaxation maps in different subtypes may indicate T1/T2/PD maps as complements to ADC for monitoring NAC response, especially for HER2-positive and TNBC, and its physiological significance needs to be further explored.Acknowledgements
No.References
[1] Haque W, Verma V, Hatch S, et al. Response rates and pathologic complete response by breast cancer molecular subtype following neoadjuvant chemotherapy [J]. Breast Cancer Res Treat, 2018, 170(3): 559-67.
[2] Yates L R. Intratumoral heterogeneity and subclonal diversification of early breast cancer [J]. Breast (Edinburgh, Scotland), 2017, 34 Suppl 1: S36-S42.
[3] Fallahpour S, Navaneelan T, De P, et al. Breast cancer survival by molecular subtype: a population-based analysis of cancer registry data [J]. CMAJ Open, 2017, 5(3): E734-e9.
[4] Li Q, Xiao Q, Yang M, et al. Histogram analysis of quantitative parameters from synthetic MRI: Correlations with prognostic factors and molecular subtypes in invasive ductal breast cancer [J]. Eur J Radiol, 2021, 139: 109697.
Figures