1795
Feasibility of R2*-based cerebral venous oxygenation mapping using a clinical susceptibility-weighted imaging protocol1Department of Neuroscience, Imaging and Clinical Sciences, 'G. d’Annunzio University' of Chieti-Pescara, Chieti, Italy, 2Institute for Advanced Biomedical Technologies (ITAB), 'G. d’Annunzio University' of Chieti-Pescara, Chieti, Italy, 3Department of Radiology, 'SS. Annunziata' University Hospital, Chieti, Italy, 4MS Centre, Department of Clinical Neurology, 'SS. Annunziata' University Hospital, Chieti, Italy, 5Cardiff University Brain Research Imaging Centre (CUBRIC), School of Psychology, Cardiff University, Cardiff, United Kingdom
Synopsis
Keywords: Quantitative Imaging, Oxygenation
The brain’s oxygen extraction fraction (OEF) is a key parameter in assessing cerebrovascular function and brain oxygen consumption. We investigated the feasibility of measuring cerebral venous oxygenation (SvO2), the key determinant of OEF, based on R2* estimated from a clinical susceptibility weighted imaging protocol and vessel segmentation aided by gadolinium administration, in a cohort of patients with Multiple Sclerosis. We were able to estimate venous oxygenation in the superior sagittal sinus, straight sinus, transverse sinuses and internal cerebral veins. The global median SvO2 ranged between 0.60 and 0.68, within the range of values expected in the human brain.
Introduction
The measurement of cerebral venous oxygen saturation (SvO2) is necessary for quantifying the brain’s oxygen extraction fraction and, therefore, the assessment of the cerebral metabolic rate of oxygen consumption. Particularly, three-dimensional (3D) mapping of cerebral SvO2 would allow investigation of regional oxygenation in health and its alteration in disease. Recently, it was shown that a map of SvO2 in large veins could be calculated based on voxel-wise R2* values of venous blood1. This method relied on a multi-echo gradient-echo, incorporating flow compensation and velocity encoding (phase contrast) gradients. However, this sequence is not currently readily available in a clinical setting.On the other hand, susceptibility-weighted imaging protocols (SWIp) are increasingly used in the clinic to calculate SWI images, for which multi-echo gradient-echo data are intrinsically acquired. Hence, this study aimed to assess whether the multi-echo signal magnitude from a clinical SWIp sequence could be used to calculate 3D maps of SvO2 based on R2*, in large veins, in a clinical cohort of Multiple Sclerosis patients. In addition to using the SWIp sequence, we exploited the administration of gadolinium concentration to permit us to segment the large cerebral veins from T1-weighted images.
Methods
Thirty-one subjects with relapsing-remitting Multiple Sclerosis (age: 36.4 ± 12.4 years, 14/16 M/F, disease duration: 12.0 ± 10.1 years, Expanded Disability Status Scale (EDSS) score = 3.3 ± 1.9) underwent MRI on a Philips Achieva 3 T system using a 32-channel receive-only head coil. As part of the imaging protocol, the following sequences were used: 3D T1-weighted before and after gadolinium-based contrast injection and 3D T2*-weighted multi-echo susceptibility-weighted imaging (SWIp) before contrast injection. The acquisition parameters are shown in Table 1. For the SWIp acquisition, the raw complex images were obtained via delayed reconstruction.Images from each subject were processed as follows. First, a parametric map of the transverse relaxation rate (R2*) was calculated by voxel-wise linearly fitting the log-linearised signal magnitude over echo times (TEs) according to:
$$ln(S) = ln(S_0) - TE\cdot R2^* \quad (1)$$
Second, a preliminary segmentation of the cerebral vessels was calculated by rigidly aligning (FSL FLIRT2,3) the T1-weighted image acquired before contrast injection to the one acquired after contrast injection, and then subtracting the images. The resulting difference image was thresholded empirically and binarised. The resulting vessel mask was then rigidly aligned to the first-echo SWIp magnitude image using FSL FLIRT. Based on this preliminary segmentation in SWIp space, the superior sagittal sinus, straight sinus, transverse sinuses, and internal cerebral veins were delineated using the manual segmentation tool in ITK-SNAP4.
For each subject and in each venous region of interest (ROI), voxel-wise venous oxygen saturation (SvO2) values were calculated based on the R2* map and the following calibration relation1:
$$R2^* = A^*+C^*(1-SvO_2)^2 \quad (2)$$
Here, A* = 12.7 Hz and C* = 101.1 Hz assuming a haematocrit value of 0.391. Median and standard deviation values of SvO2 were also calculated in each venous ROI both globally and across subjects.
Results and Discussion
A representative segmentation of the major veins is shown in Figure 1, overlaid on the first-echo magnitude image from the SWIp protocol. These results indicate that combining the pre-contrast and post-contrast T1-weighted images enables segmentation of the main cerebral veins. A representative SvO2 map is shown in Figure 2, overlaid on the corresponding R2* map. Here, most venous ROIs exhibited a fractional SvO2 in the range 0.5-0.7. Histograms of all voxels of all subjects and histograms of the median values in all subjects are respectively shown in Figures 3 and 4, providing a quantitative summary of SvO2 in this cohort. In the venous ROIs, the global median SvO2 ranged between 0.60 and 0.68 (Figure 3). Similarly, the median SvO2 calculated in individual subjects ranged between 0.58 and 0.68 (Figure 4). These results were in agreement with SvO2 values previously reported in the literature, including those measured by Mao et al.1 This simple approach remains to be validated against dedicated SvO2 measurements such as those provided by T2-Relaxation-Under-Spin-Tagging (TRUST)5.Conclusions
Clinical protocols acquiring SWIp and pre-contrast and post-contrast T1-weighted images may enable calculating parametric maps of venous oxygenation in the major cerebral veins without adding a dedicated sequence. This approach may open the way to a more widespread evaluation of cerebral oxygen extraction and cerebral oxygen metabolism for clinical research.Acknowledgements
This work was partially conducted under the framework of the Departments of Excellence 2018–2022 initiative of the Italian Ministry of Education, University and Research for the Department of Neuroscience, Imaging and Clinical Sciences (DNISC) of the University of Chieti-Pescara, Italy.References
- Mao, D., Li, Y., Liu, P., Peng, S.-L., Pillai, J. J., & Lu, H. (2018). Three-dimensional mapping of brain venous oxygenation using R2* oximetry. Magnetic Resonance in Medicine, 79(3), 1304–1313.
- Jenkinson, M., & Smith, S. (2001). A global optimisation method for robust affine registration of brain images. Medical Image Analysis, 5(2), 143–156.
- Jenkinson, M., Bannister, P., Brady, M., & Smith, S. (2002). Improved Optimization for the Robust and Accurate Linear Registration and Motion Correction of Brain Images. NeuroImage, 17(2), 825–841.
- Yushkevich, P. A., Piven, J., Hazlett, H. C., Smith, R. G., Ho, S., Gee, J. C., & Gerig, G. (2006). User-guided 3D active contour segmentation of anatomical structures: Significantly improved efficiency and reliability. NeuroImage, 31(3), 1116–1128.
- Lu, H., Xu, F., Grgac, K., Liu, P., Qin, Q., & Van Zijl, P. (2012). Calibration and validation of TRUST MRI for the estimation of cerebral blood oxygenation. Magnetic Resonance in Medicine, 67(1), 42–49.
Figures
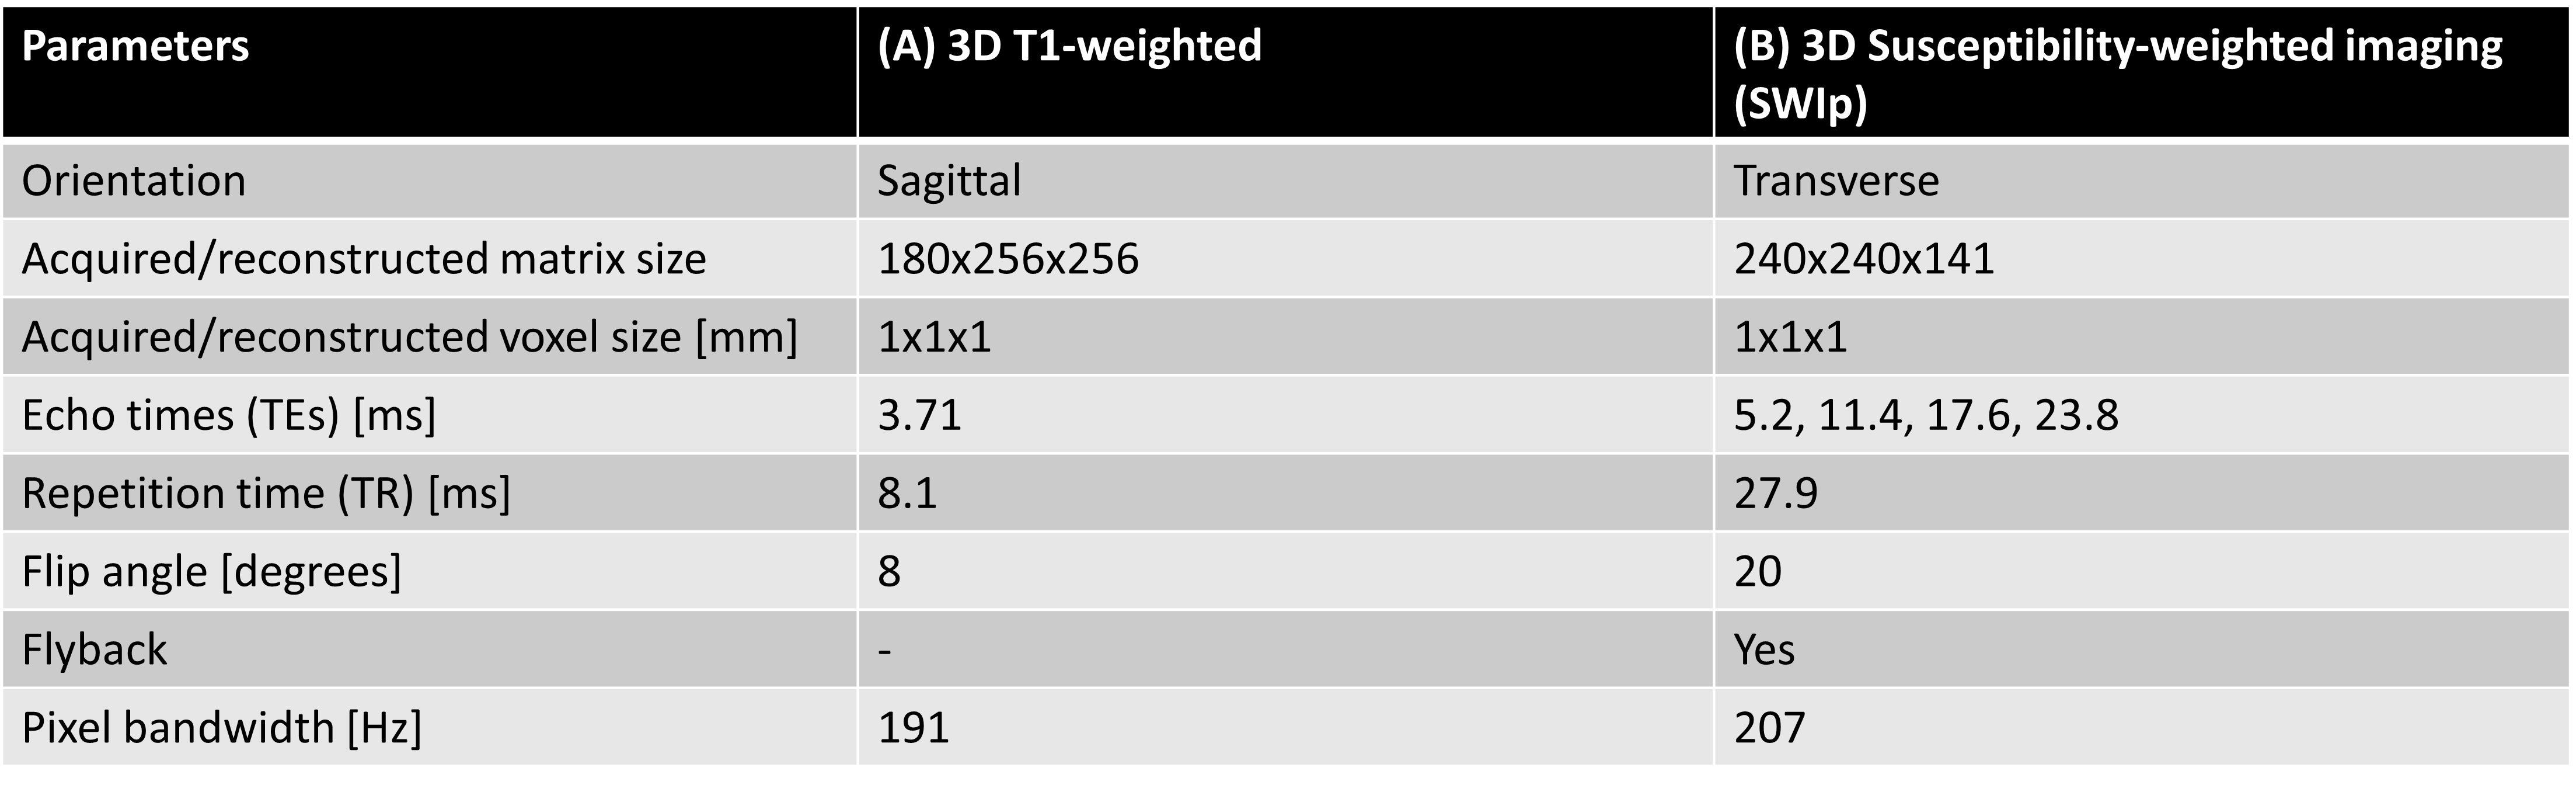
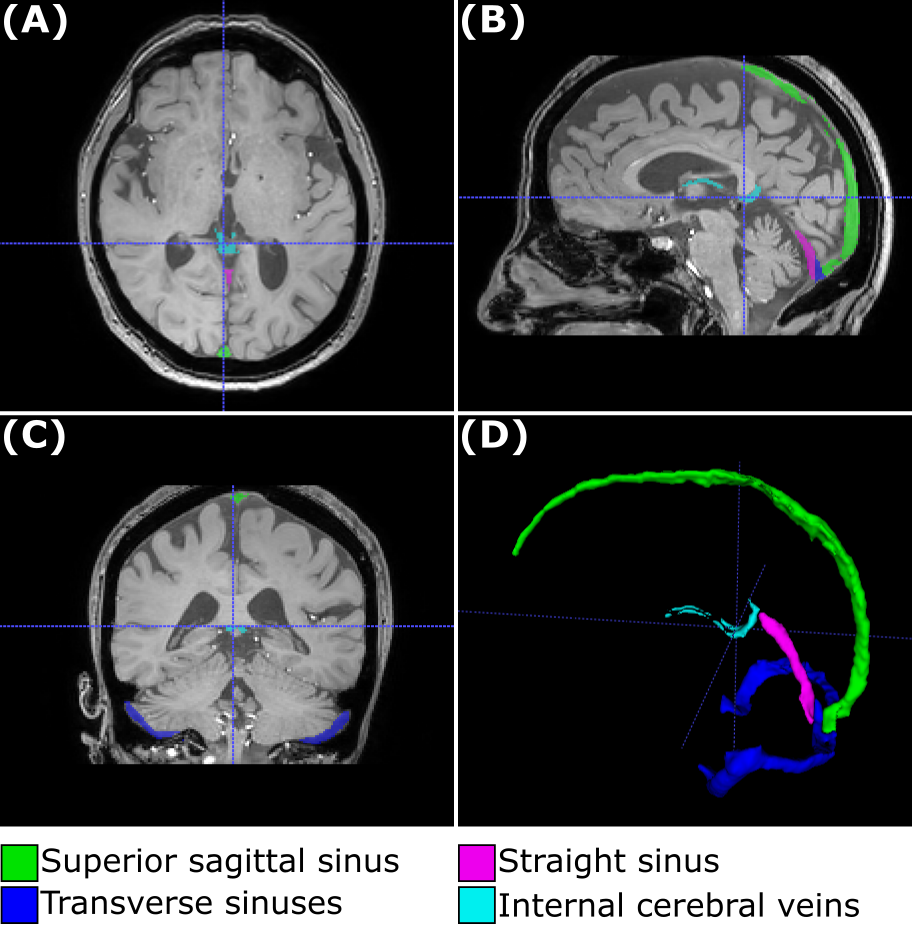
Figure 1. Venous segmentation in a representative subject. The venous segmentation image, including the superior sagittal sinus, straight sinus, transverse sinuses and internal cerebral veins, is overlaid on the first-echo magnitude image from the SWIp sequence (A-C) and rendered as a 3D image (D).
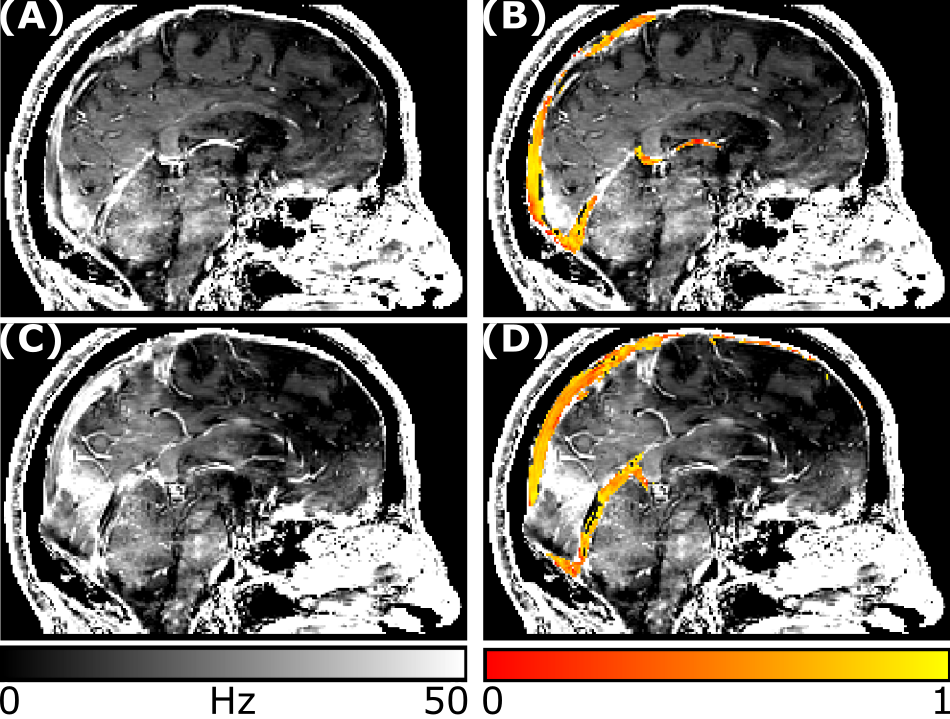
Figure 2. R2* and venous oxygenation maps. For the same subject as in Figure 1, two representative sagittal slices are shown for the R2* map (A, C) and the SvO2 oxygenation map overlaid on the R2* map (B, D).
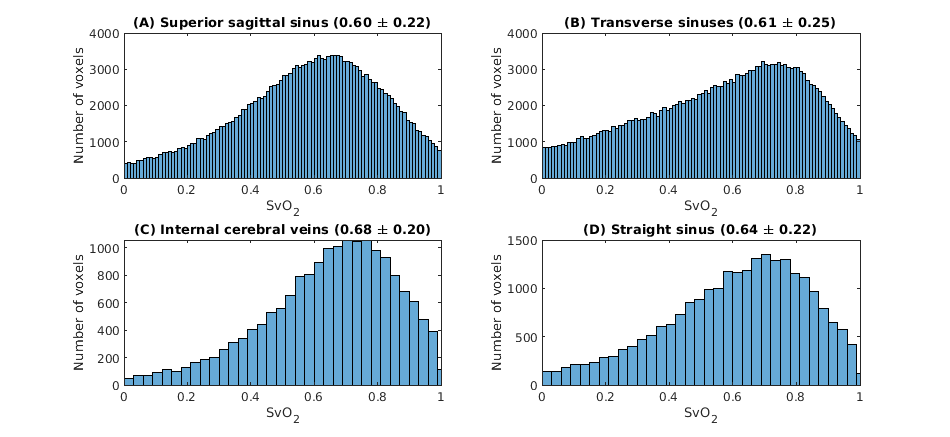
Figure 3. Distribution of venous oxygenation values (SvO2 as a fraction) in the four venous ROIs. For all voxels of all subjects, the figure shows the distribution of SvO2 values in all venous ROIs. In addition, the title of each panel reports the global median and standard deviation values.
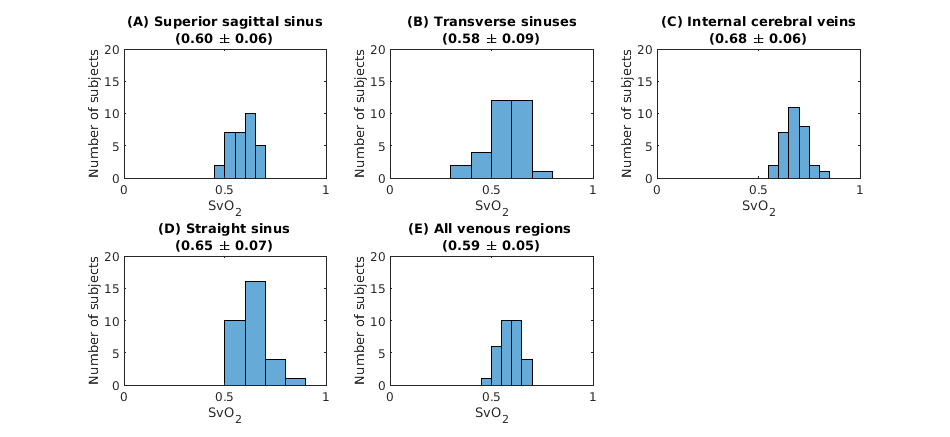
Figure 4. Distribution of median venous oxygenation values (SvO2 as a fraction) in the four venous ROIs. For each venous ROI (A-D) and all ROIs grouped together (E), the figure shows the distribution of SvO2 values. In addition, the title of each panel reports the median and standard deviation values across subjects.