1794
T2* Mapping to Assess Hashimoto's Thyroiditis vs Healthy Thyroid at 3.0T: Feasibility
Nathan Ooms1, Humberto Monsevais1, and Ulrike Dydak1
1School of Health Sciences, Purdue University, West Lafayette, IN, United States
1School of Health Sciences, Purdue University, West Lafayette, IN, United States
Synopsis
Keywords: Quantitative Imaging, Body
Hashimoto Thyroiditis is an autoimmune disease that largely effects women, and can cause fatigue, unexplained weight loss or gain, enlargement of the thyroid gland, and other symptoms. We are proposing utilizing T2* mapping to quantify the thyroid gland in the presence and absence of Hashimoto's Thyroiditis. Very little has been studied using T2* techniques in the thyroid gland, and what has been studies has focused on evaluating for nodules and cancer. We hope to broaden the capabilities to establish normal ranges and evaluate the effects of Hashimoto's Thyroiditis.Introduction
Hashimoto’s Thyroiditis is an autoimmune disease effecting women ~4x more than men.1 T2* mapping has been explored as an option for differentiation of thyroid nodules from thyroid carcinoma2, but there is limited work available for the evaluation of normal thyroid and Hashimoto’s Thyroiditis (HT) utilizing T2* mapping, which could be a useful, non-invasive, high resolution imaging option.Method
5 subjects of two different age groups were images (n=5, 3 20-30 years old, 2 50-60 years old). Subject T01 was recently diagnosed as having Hashimoto Thyroiditis and had not yet started a pharmaceutical treatment nor undergone any intervention. Subject T03 had been diagnosed with HT at a younger age and has been pharmaceutically treated for multiple years. Of note, subject T02 had recently experienced illness was found to have an incidental finding in the thyroid. For the purposes of this abstract, subject T02 was excluded. MR images were acquired on a 3T Magnetom Prisma (Siemens, Germany). Transverse T1 Weighted and Transverse T2 Weighted Turbo Spin Echo images as well as 3-Dimensional T1 Weighted VIBE Dixon images were first acquired for anatomical visualization. Following the anatomical images, 2 vendor supplied T2* mapping sequences were run using two different resolutions and compared to T2* images produced by a Quantitative Susceptibility Mapping sequence. One of the vendor supplied sequences was not modified, the other was modified to have a higher resolution. A table with relevant parameters is displayed in Table 2. T2* maps were generated inline via the sequence utilized. Regions of interest (ROIs) were drawn and analyzed on the Siemens Z420 workstation. Circular ROIs were consistently drawn at approximately 0.6 mm2 to encompass a portion of the thyroid tissue on every subject’s right lobe, verified by anatomical landmark images to avoid the nearby blood vessels, muscle tissue, and trachea.Results
T2* values were higher in the subject with HT than in those without HT or who had been successfully treated medicinally. T2* values were 40% to 65% lower in all other subjects. Dealing with such a small sample size, it would be difficult to declare a statistical significance but there is enough evidence to suggest a correlation as it regards to the T2* value of the thyroid with and without untreated Hashimoto’s Thyroiditis. There does not appear to be a significant difference regarding the effects of aging on the values derived from the thyroid gland. Further data acquisition would be beneficial to investigating the effects of aging in the thyroid. In comparing the values vendor supplied sequences to the QSM T2* mapped values, we find that the vendor T2* values were more similar to each other, where we found that the QSM sequence displayed values comparatively lower in each subject. Differences can be attributed to different echo times, echo spacing, in-plane resolution and flow compensation. The biggest benefit of utilizing the QSM sequence is in the acquisition time. In order to acquire similar data with regards to signal to noise ratio (SNR), both vendor supplied sequences require more than 5 and a half minutes of acquisition time, whereas the QSM sequence only required slightly more than 3 minutes.Conclusion
T2* mapping, regardless of sequence utilized, showed a marked increase in T2* values in newly diagnosed, untreated Hashimoto’s Thyroiditis as compared to healthy or treated subjects. Further investigation into the correlation between T2* values and thyroid pathology would be a valuable tool in the diagnostic capabilities of MRI.Acknowledgements
Data acquisition was supported in part by NIH grant S10 OD012336. 3T MRI Scanner dedicated to Life Sciences Research PI: Ulrike Dydak
References
Mincer DL, Jialal I. Hashimoto Thyroiditis. [Updated 2022 Jun 21]. In: StatPearls [Internet]. Treasure Island (FL): StatPearls Publishing; 2022 Jan-. Available from: https://www.ncbi.nlm.nih.gov/books/NBK459262/ Ruoyang Shi, MD, Qiuying Yao, BS, Lianming Wu, PhD, Qinyi Zhou, MD, Qing Lu, PhD, Runlin Gao, MD, Jiani Hu, PhD, Leslie Kao, MD, Ashika Bains, MD, Zhaowen Yan, MD, Yongming Dai, PhD, Jianrong Xu, MD, PhD, and Yan Zhou, MD, PhD. T2* Mapping at 3.0T MRI for Differentiation of Papillary Thyroid Carcinoma From Benign Thyroid Nodules. J. MAGN. RESON. IMAGING 2016;43:956–961.Figures
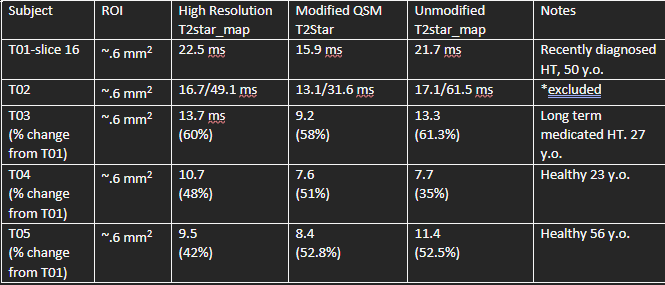
Table 1. Table above shows calculated T2* values of 5 subjects.
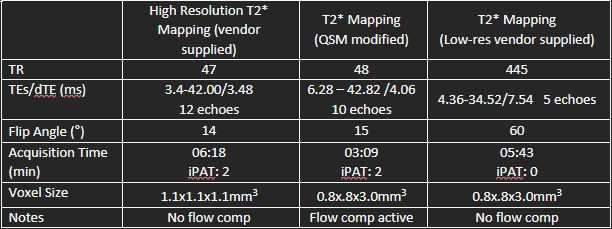
Table 2. Description of sequence parameters used in this study.
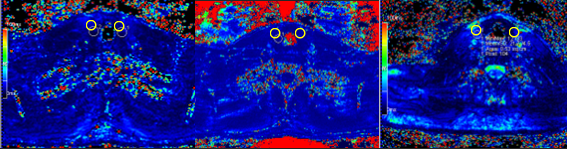
Figure 1. Demonstration of Transverse T2* mapping of the thyroid using vendor supplied high resolution T2* mapping (Left), QSM T2* mapping (middle), and T2* mapping using vendor supplied lower resolution (right). ROIs are shown in yellow circles.
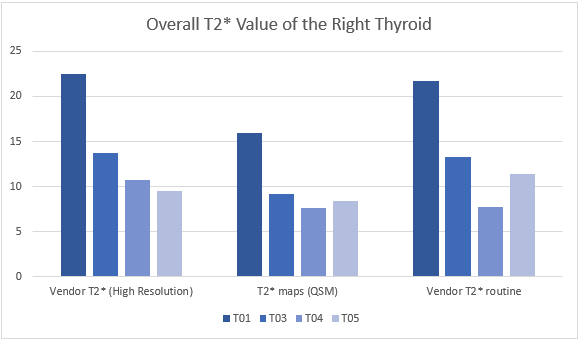
Figure 2. T2* values measured in subject 01 with HT demonstrated significantly higher T2* values regardless of sequence.
DOI: https://doi.org/10.58530/2023/1794