1790
Rapid gradient echo magnitude- and phase-based mapping of T2 and T1 using skipped-CAIPI 3D-EPI at 3T1MR Physics, DZNE, Bonn, Germany, 2Department of Physics and Astronomy, University of Bonn, Bonn, Germany
Synopsis
Keywords: Quantitative Imaging, Modelling, Quantitative imaging, Relaxometry, Neuro
A recent study demonstrated that phase-based T2 mapping with 3D-GRE is feasible. Only two phase images acquired with a small RF spoiling phase increment are needed to generate high-quality T2 maps. Here, we investigated simultaneous T2 and T1 mapping at 3T, by including the magnitude and more phase increments acquired rapidly with a skipped-CAIPI 3D-EPI sequence. This method is able to simultaneously provide T2 and T1 maps within 4-8 minutes. In addition to multiparametric mapping, a phase-based T2 map can be provided in less than 1 minute.Introduction
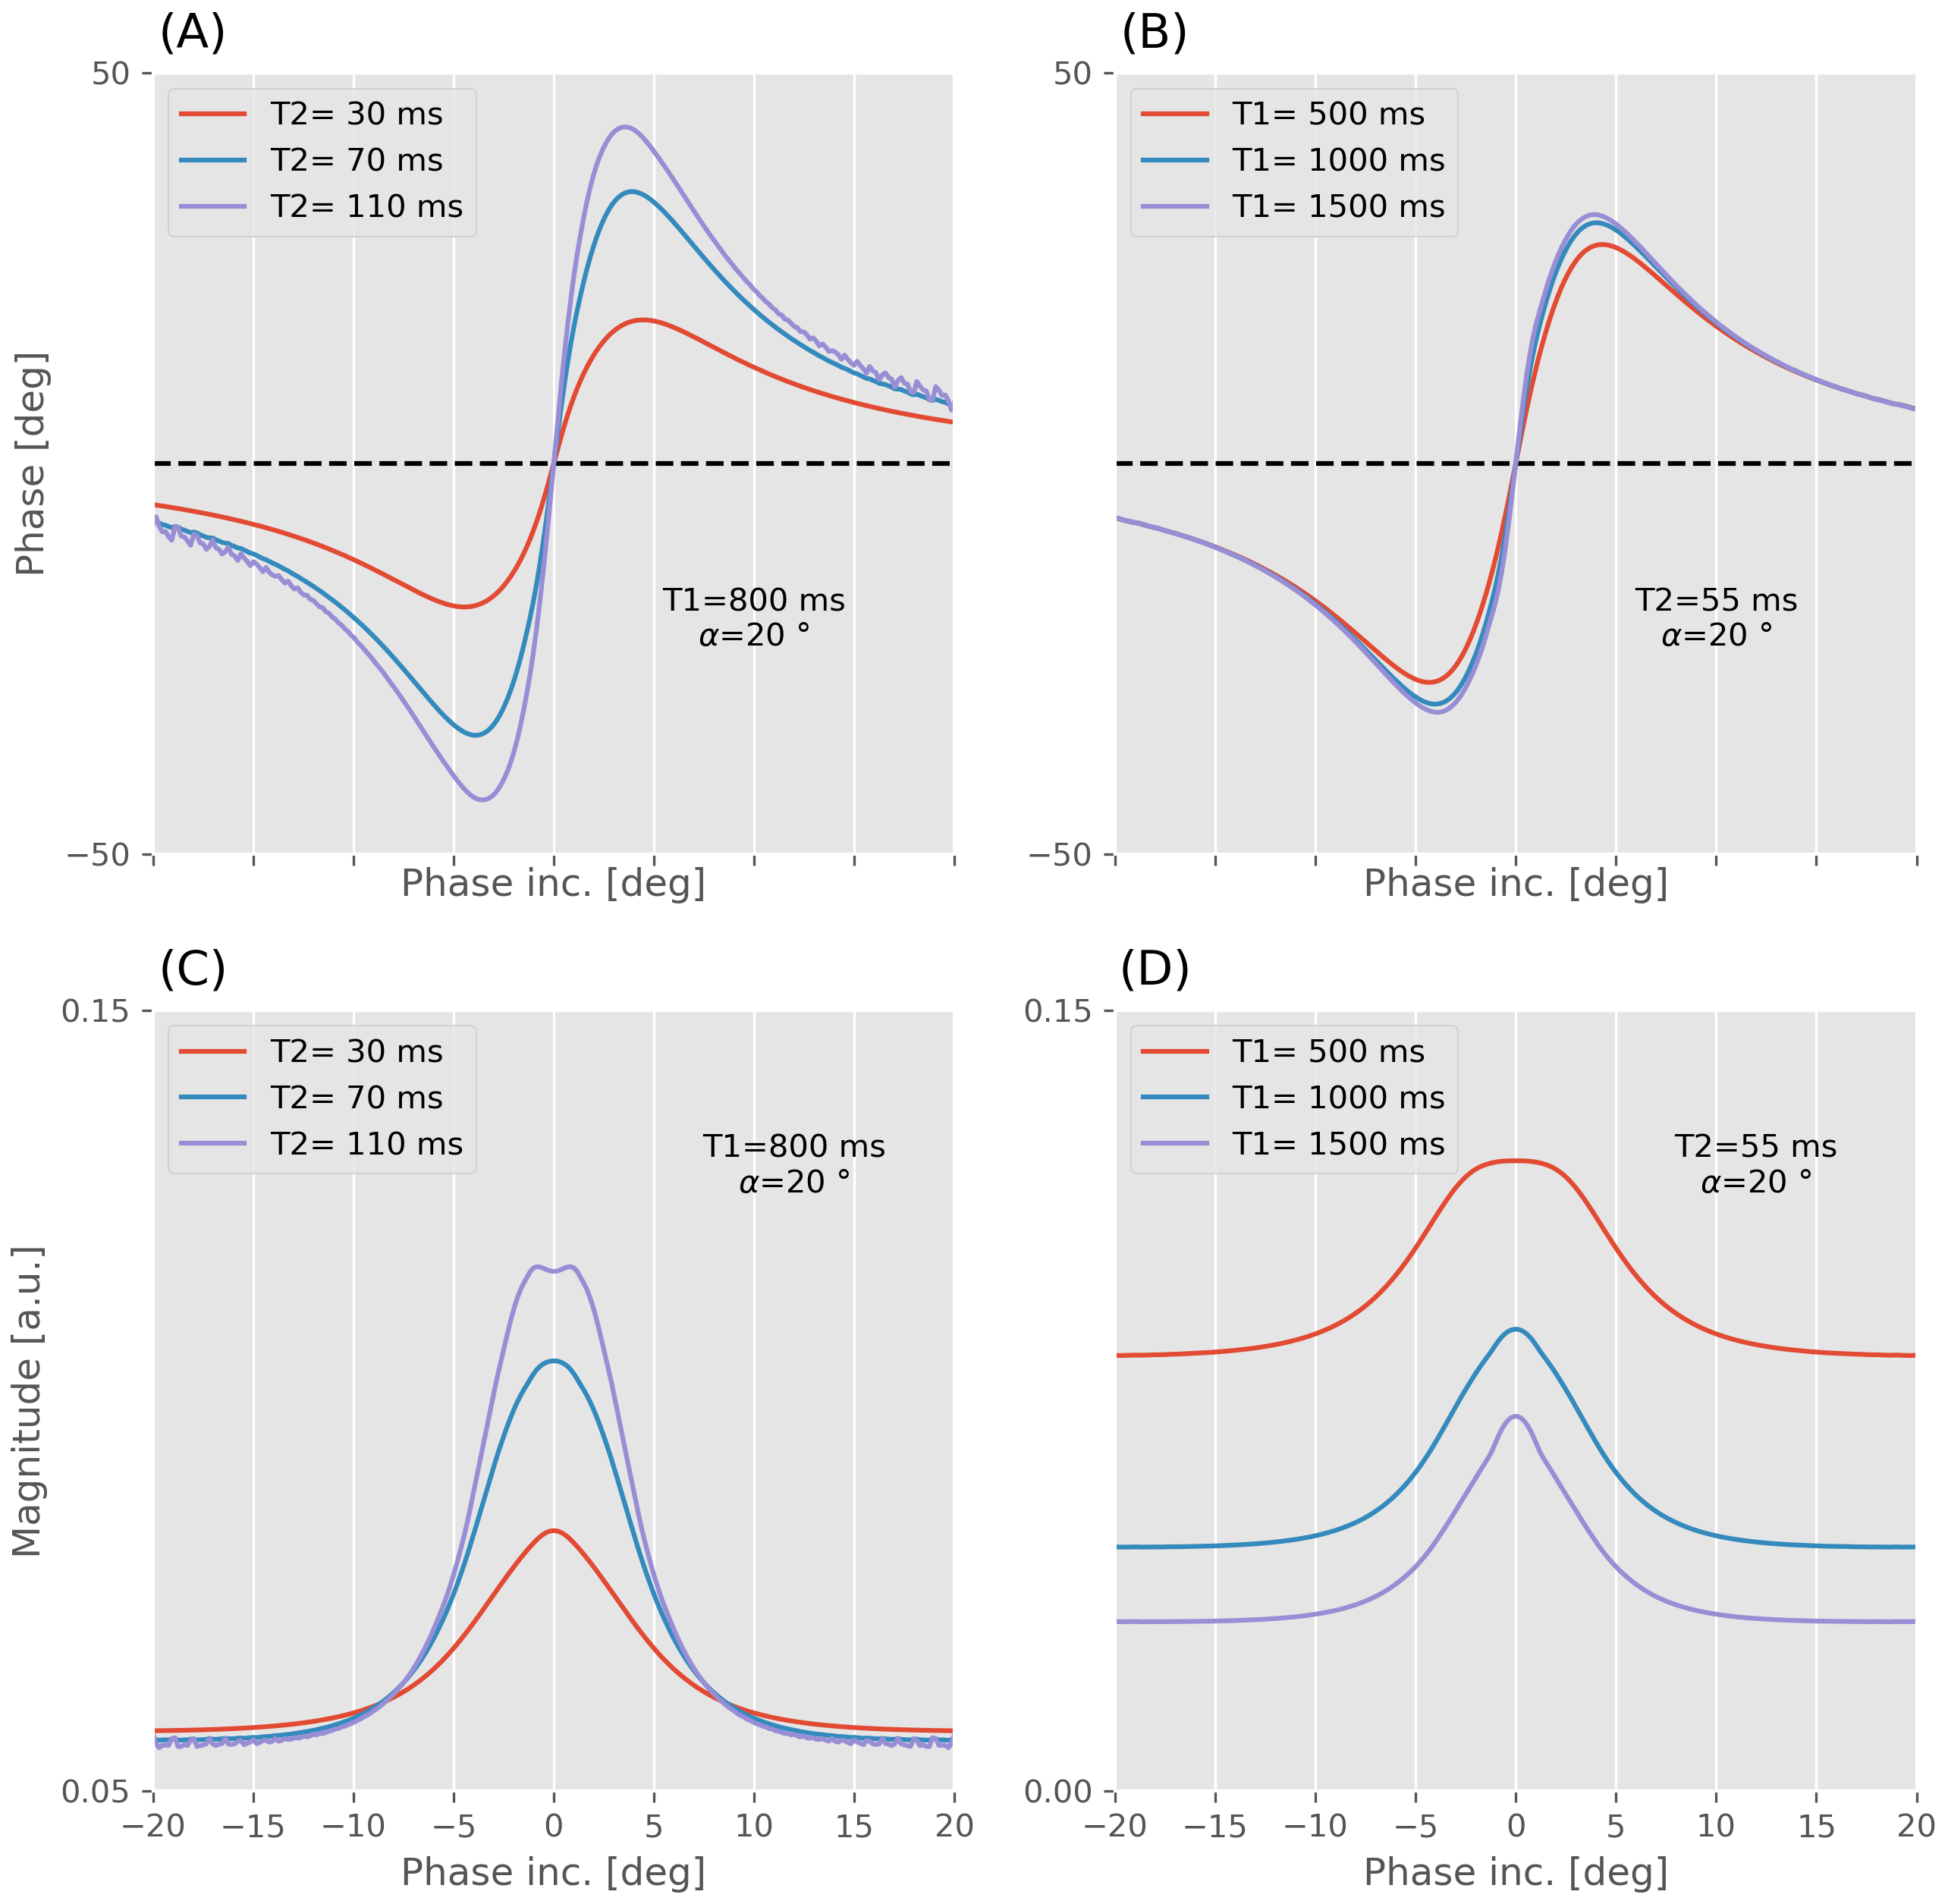
Recent studies show that T2 information is encoded in signal phase at 3T(1) and 7T(2) when using a partially spoiled GRE sequence with small quadratic RF spoiling phase increments. The feasibility of phase-based T2 mapping method was demonstrated at 3T using two phase increments, while assuming a fixed T1 value. This assumption may be violated for T1 values below 1s. In contrast to the phase, the magnitude of the partially spoiled signal depends strongly on T2 and T1 (Fig. [1]). In this study, we investigated a novel magnitude- and phase-based T2 and T1 mapping method based on rapid acquisitions.Methods
The study was conducted on a Siemens (Healthineers) Skyra 3T system using a 32-channel head receive coil. Apart from a 3DREAM B1 map(3), all images were acquired with skipped-CAIPI 3D-EPI(4) at 1.5mm isotropic resolution (FA=20°, TR=9.5ms, FOV = 177×255×255, TE=3.5ms, CAIPI 2x2z1, EPI factor 4). Instead of a standard phase increment for RF spoiling (e.g. 50°), small phase increments were chosen as $$$\Delta\phi = 0,\pm1^{\circ},\pm2^{\circ},\pm3^{\circ},\pm4^{\circ},\pm5^{\circ},\pm6^{\circ},\pm8^{\circ},\pm11^{\circ},\pm15^{\circ},\pm20^{\circ}$$$. 200 “dummy” TRs have been performed before acquisition of two images with the same increment (885 TRs per image). The 42 whole-brain images were acquired in 7:35.Following complex-valued Marchenko-Pastur PCA denoising(5-8) and motion correction(9), the two complex images per increment have been averaged. From the resulting images of pair-wise phase increments,
$$$S_{+\Delta\phi}=\eta(\Delta\phi)e^{i(+\theta(\Delta\phi)+\theta'(0))}+\epsilon_{+\Delta\phi}$$$ and
$$$S_{-\Delta\phi}=\eta(\Delta\phi)e^{i(-\theta(\Delta\phi)+\theta'(0))}+\epsilon_{-\Delta\phi}$$$,
the experimental background-free phase and magnitude were obtained as:
$$$\hat{\theta}(\Delta\phi)=\angle(S_{+\Delta\phi}\cdot(S_{-\Delta\phi})^*)/2$$$ and
$$$\hat{\eta}(\Delta\phi)=\sqrt{|S_{+\Delta\phi}\cdot(S_{-\Delta\phi})^*|}/|S_0|$$$.
$$$\epsilon_{\pm\Delta\phi}$$$ denotes noise or other scan imperfections, $$$\theta'(0)$$$ the background phase and $$$|S_0|$$$ the magnitude for $$$\Delta\phi=0$$$.
As shown in (1), the signal magnitude and phase are a function of phase increment $$$\Delta\phi$$$, $$$\alpha$$$, TR, T1 and T2. The ideal signal can be expressed as $$$S=\eta(T1,T2;TR,\alpha,\Delta\phi)\cdot e^{i[\theta(T1,T2;TR,\alpha,\Delta\phi)]}$$$. A corresponding dictionary of steady-state signals is constructed using the extended phase graph formalism(10) for 509 T1 values from 500 to 4500ms, 189 T2 values from 10 to 200ms, 21 flip angles from 15 to 25°. T2 is estimated voxel-wise by minimizing the squared difference between experimental complex data $$$\hat{S}$$$ or only phase $$$\hat{\theta}$$$ and the dictionary $$$S$$$ or $$$\theta$$$ for given phase increments:
$$$\sum_{\Delta\phi}[\hat{\theta}(T1,T2;TR,\alpha,\Delta\phi) -\theta(T1,T2;TR,\alpha,\Delta\phi)]^2$$$ (phase-based)
$$$\sum_{\Delta\phi}[\hat{S}(T1,T2;TR,\alpha,\Delta\phi) -S(T1,T2;TR,\alpha,\Delta\phi)]^2$$$ (magnitude-phase-based)
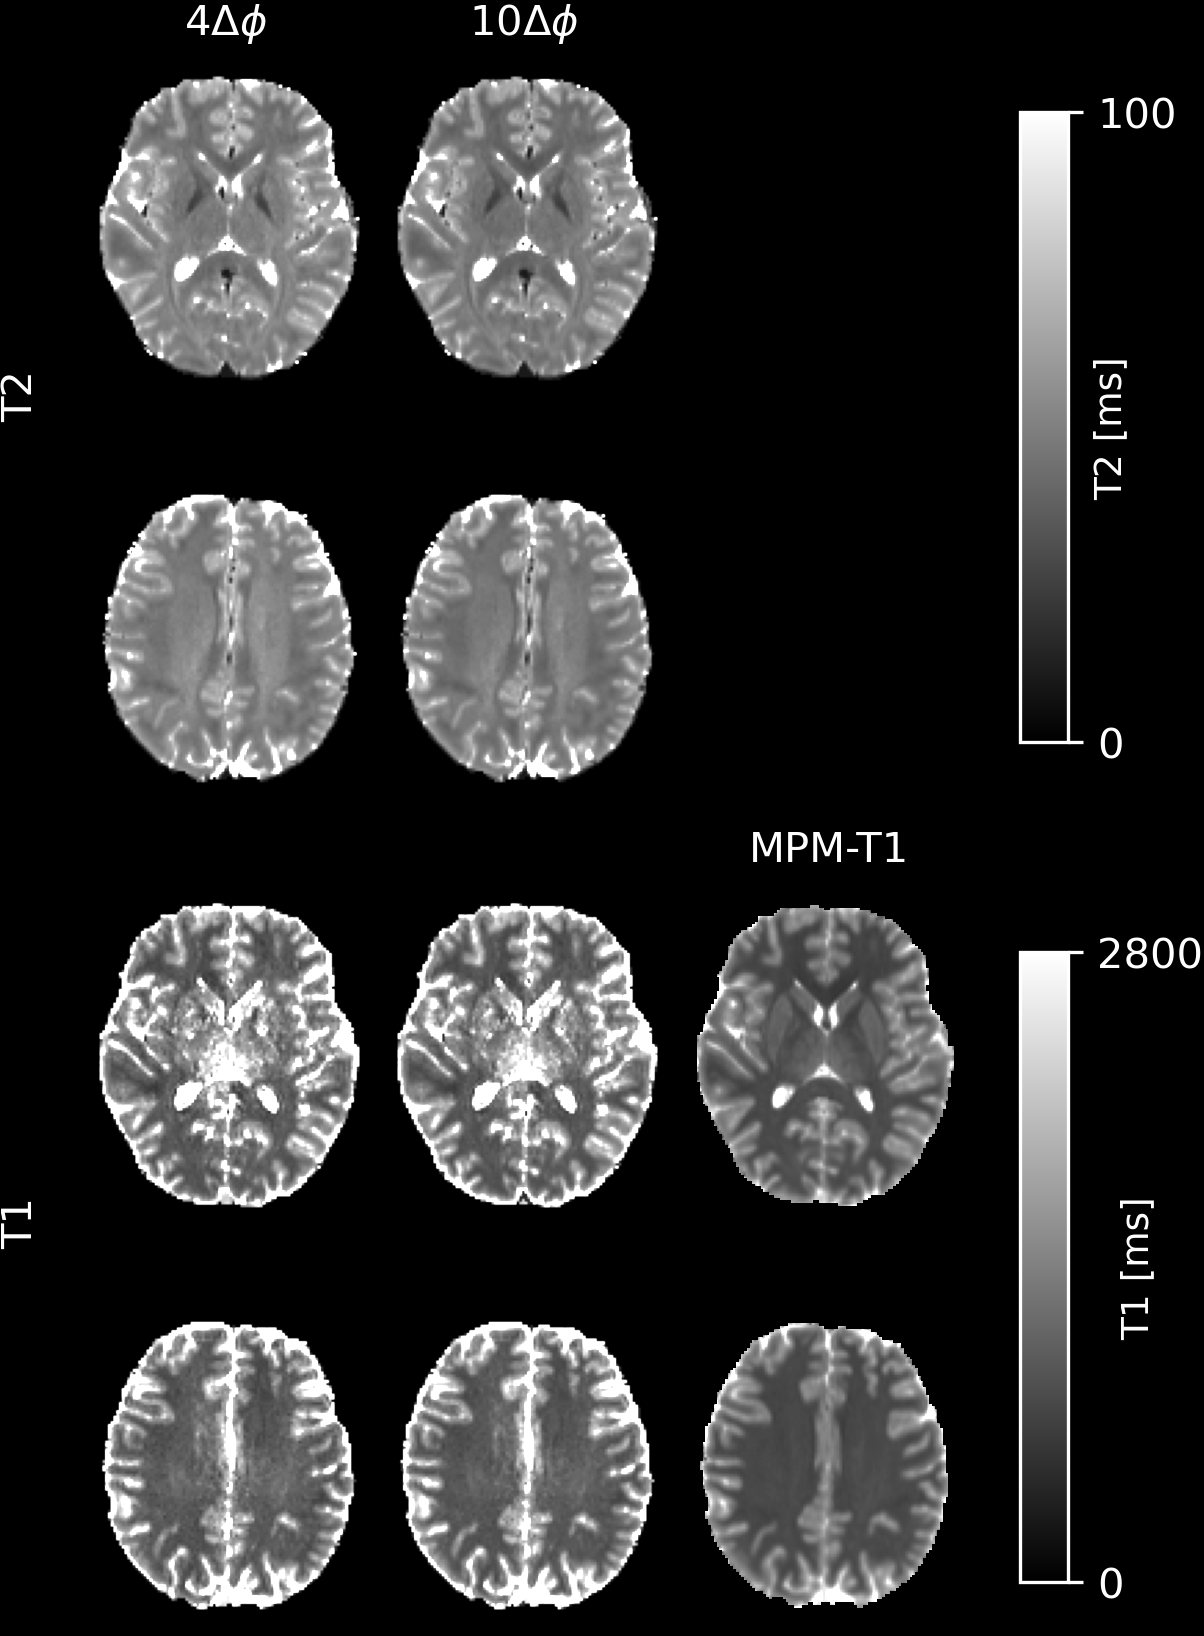
Dictionary interpolation was involved in the fit. An additional T1 map was acquired using the MPM approach(11,12) with an adapted 3D-EPI protocol ($$$\Delta\phi= 50^{\circ}$$$, 6 TEs between 3.5 and 26ms, FA/TR for MT-, PD-, T1-weighted: 6°/46.5ms, 4°/32.0ms, 25°/32.0ms, TA=2:09). For T2 mapping, the MPM-T1 map is treated as input data. For simultaneous T2-T1 mapping, both variables are estimated without the MPM-T1 map. The flip angle of each voxel, taken from the B1 map, is also treated as input data.
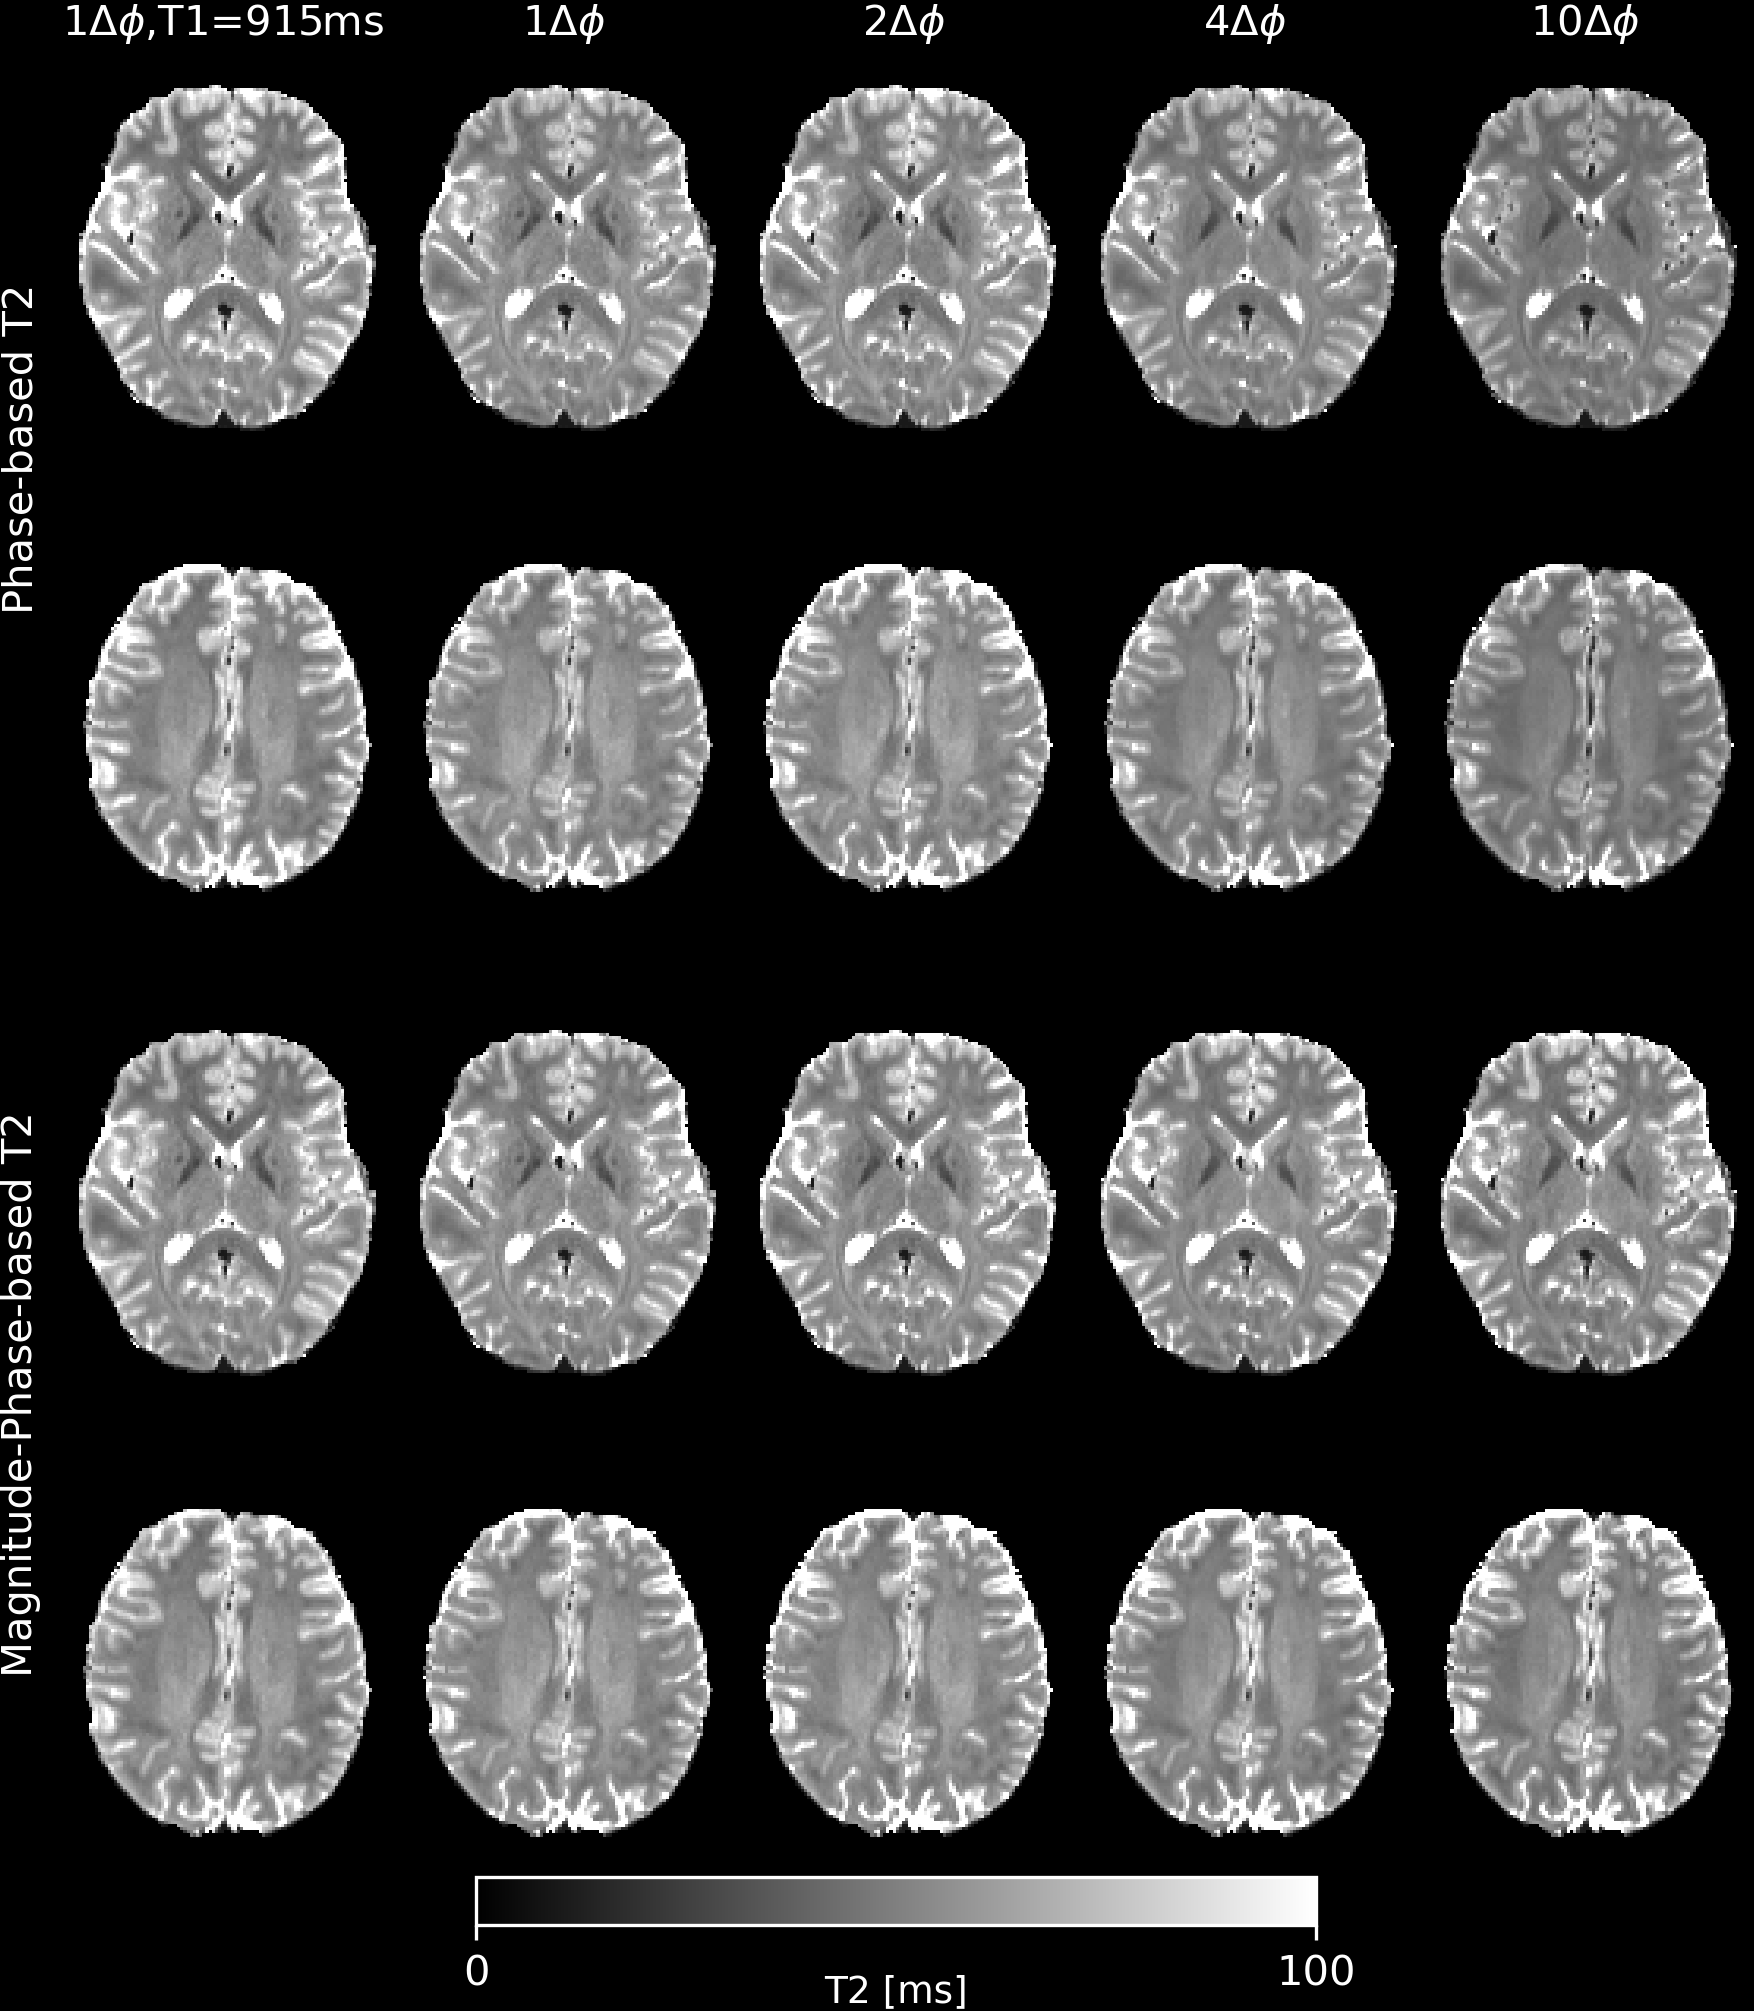
The phase-based and magnitude-phase-based T2 mapping methods were performed for varying numbers of increments: (a) 1$$$\Delta\phi\in\pm[2]^{\circ}$$$; (b) 2$$$\Delta\phi\in\pm[1,2]^{\circ}$$$; (c) 4$$$\Delta\phi\in\pm[1,2,3,4]^{\circ}$$$; (d) 10$$$\Delta\phi\in\pm[1,2,3,4,5,6,8,11,15,20]^{\circ}$$$. The magnitude-phase-based T2-T1 mapping method was performed for the cases (c) and (d).
Results
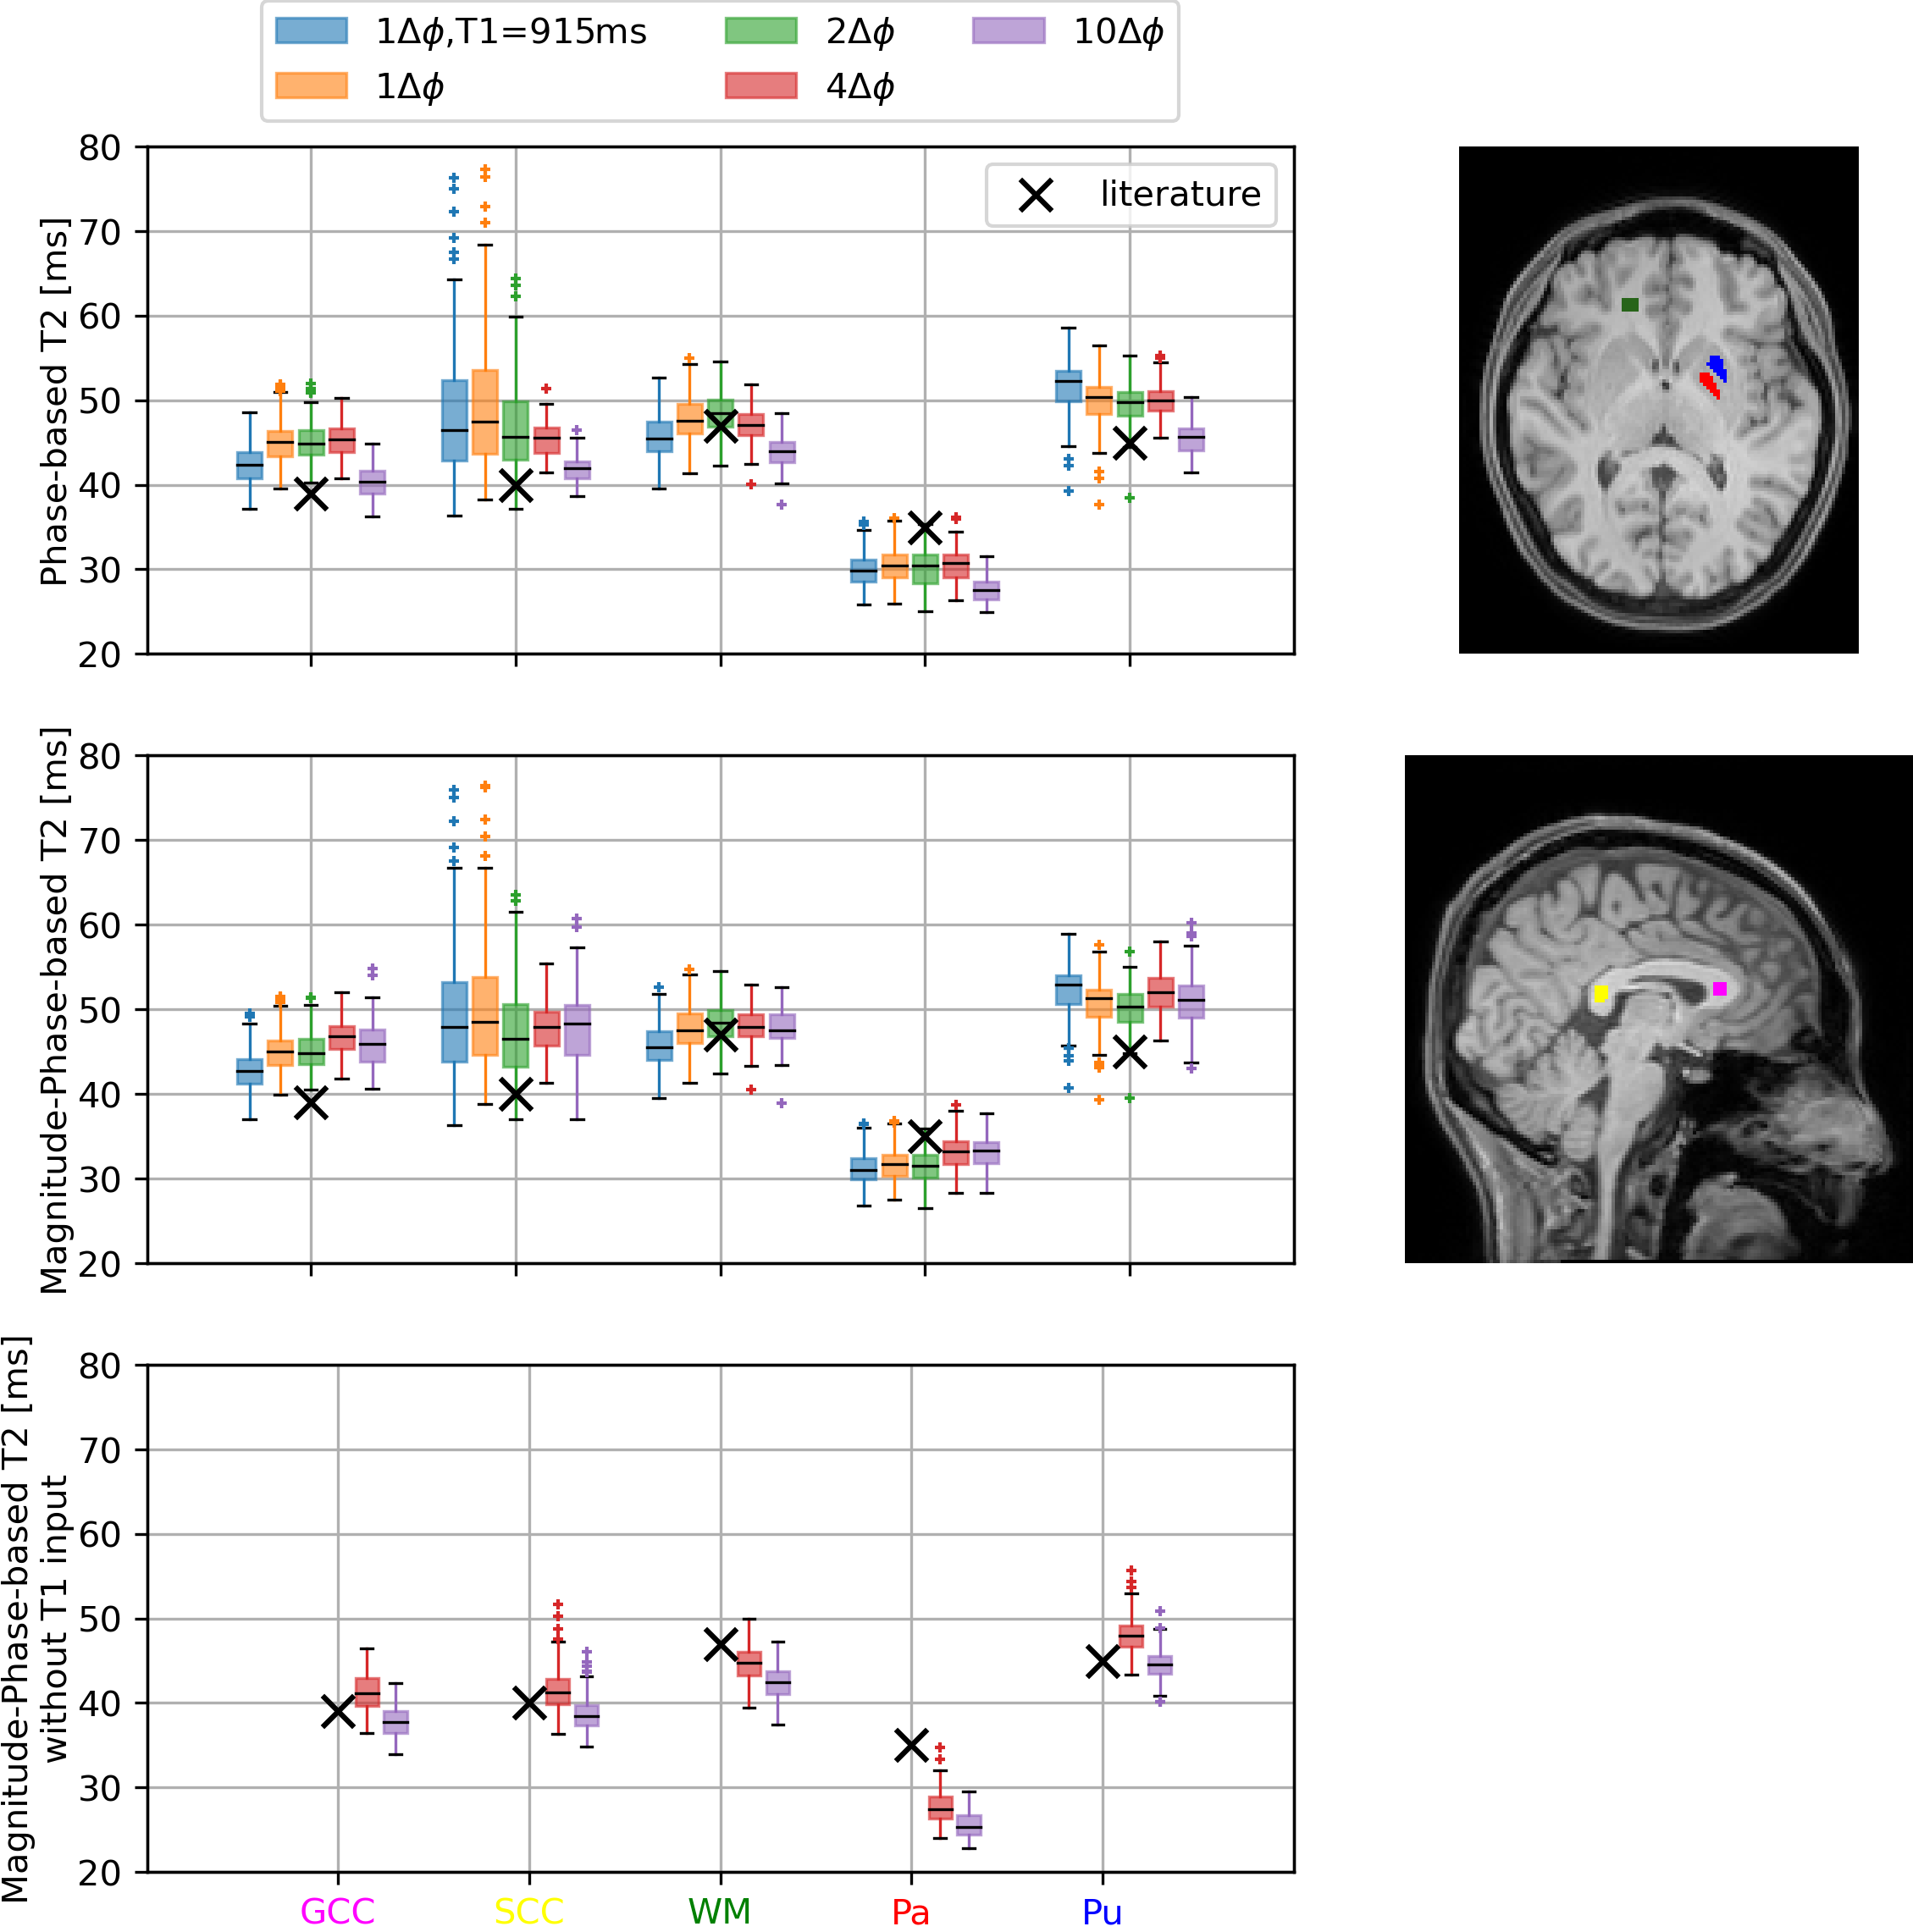
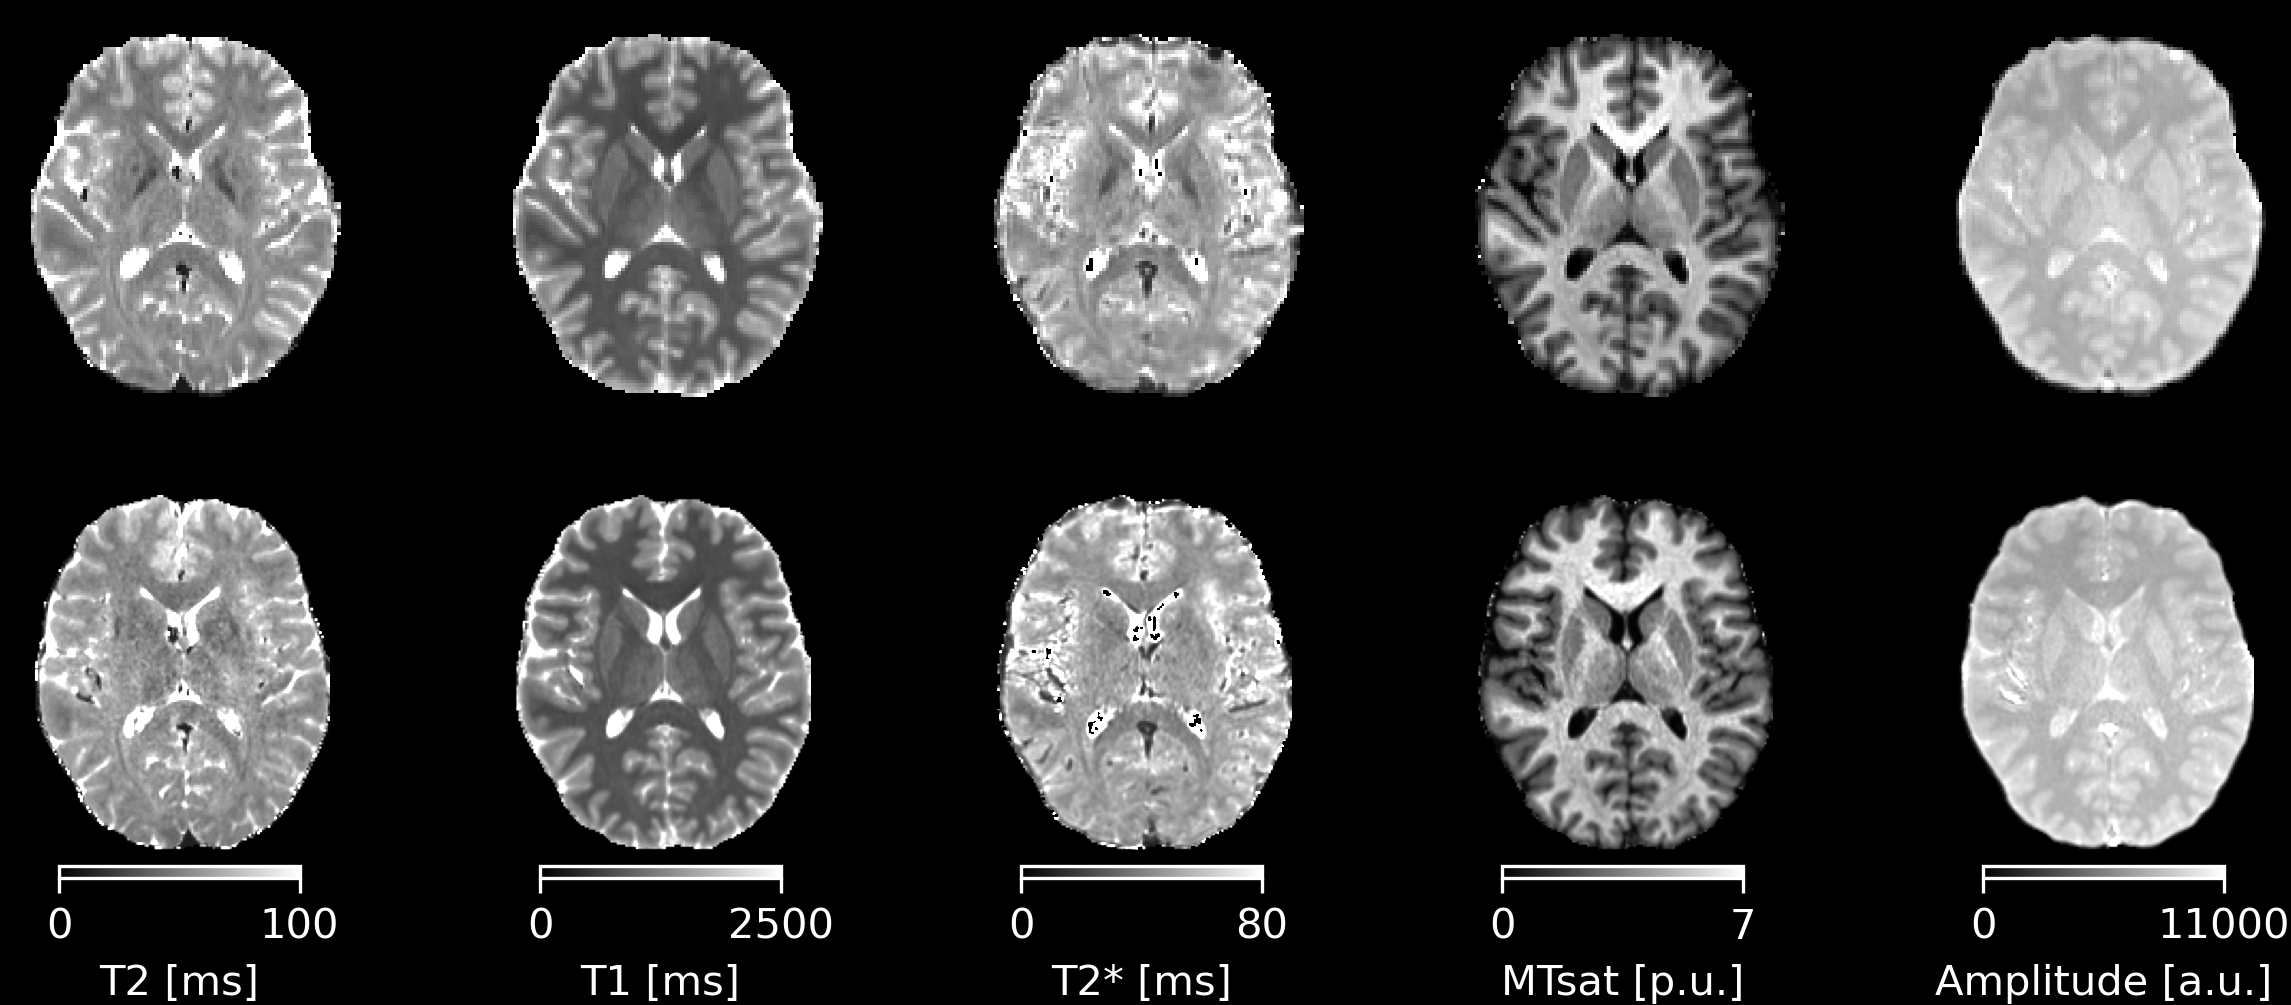
Fig. 2 shows T2 maps acquired with the phase-based and magnitude-phase-based method. Fig. 3 shows the T2 and T1 maps generated using the magnitude-phase-based methods. Fig. 4 shows box plots of T2 values obtained with all investigated approaches in several ROIs. More input data/ larger phase increments lead to lower T2 values in phase-based method, especially in globus pallidus. Such phenomenon is not observed in the novel magnitude-phase-based method. All T2 estimates are smaller than literature T2 values obtained with classic multi-echo spin echo methods(1). Fig. 5 shows MPM maps and the simplest magnitude-phase-based T2 map at 1.5 mm isotropic resolution ($$$1\Delta\phi\in\pm[2]^{\circ}$$$ acquired in 44sec). Additionally, 1.0 mm isotropic MPM and T2 maps ($$$1\Delta\phi\in\pm[2]^{\circ}$$$ acquired in 54sec) are shown.Discussion
We used rapid 3D-EPI acquisitions to investigate several aspects of T2 mapping. The proposed magnitude-phase-based method provides similar T2 maps as phase-based methods and increases the stability when including different phase increments. No clear benefit for T2 estimation is observed when including more than two and higher phase increments than $$$|\Delta\phi|=2^{\circ}$$$. Discrepancies between T2 values measured with both methods and SE-based literature values may be attributed to multi-component effects(1). The short TE of 3.5ms makes phase-(and magnitude-)based T2 mapping more sensitive to short T2 components than classic multi-echo spin-echo approaches. By including magnitude information, it is also possible to estimate T1 maps together with T2. Although these T1 maps suffer from CSF artifacts caused by insufficient spoiling and have higher T1 values than MPM-T1, the T2 maps are comparable to other approaches without a global T1 approximation or an extra T1 map. The possible reasons for the T1 discrepancy include partial volume effect, CSF artifacts and magnetization transfer. Future investigations will include different magnitude normalization, optimizing imaging parameters such as phase increments and flip angle, and increasing spatial resolution.Conclusion
The feasibility of the proposed magnitude-phase-based T2 and T2-T1 mapping method has been demonstrated using rapid 3D-EPI acquisitions. This approach can provide high-quality T2 maps within short scan time, while magnitude-phase-based T1 maps need to be improved. Four MPM maps and an additional T2 map can be acquired in less than 3 or 5 minutes at 1.5mm or 1.0mm isotropic, respectively. However, further investigation and optimization are required to analyze the accuracy of T2 and T1 maps.Acknowledgements
No acknowledgement found.References
1. Wang X, Hernando D, Reeder SB. Phase‐based T 2 mapping with gradient echo imaging. Magnetic Resonance in Medicine 2020;84:609–619.
2. Seginer A, Schmidt R. Phase-based fast 3D high-resolution quantitative T2 MRI in 7 T human brain imaging. Scientific Reports 2022;12:14088.
3. Ehses P, Brenner D, Stirnberg R, Pracht ED, Stöcker T. Whole‐brain B 1 ‐mapping using three‐dimensional DREAM. Magn. Reson. Med. 2019;82:924-934.
4. Stirnberg R, Stöcker T. Segmented K‐space blipped‐controlled aliasing in parallel imaging for high spatiotemporal resolution EPI. Magnetic Resonance in Medicine 2021;85:1540–1551.
5. Veraart, J.; Novikov, D.S.; Christiaens, D.; Ades-aron, B.; Sijbers, J. & Fieremans, E. Denoising of diffusion MRI using random matrix theory. NeuroImage, 2016, 142, 394-406.
6. Veraart, J.; Fieremans, E. & Novikov, D.S. Diffusion MRI noise mapping using random matrix theory. Magn. Res. Med., 2016, 76(5), 1582-1593.
7. Cordero-Grande, L.; Christiaens, D.; Hutter, J.; Price, A.N.; Hajnal, J.V. Complex diffusion-weighted image estimation via matrix recovery under general noise models. NeuroImage, 2019, 200, 391-404.
8. Tournier, J.-D.; Smith, R. E.; Raffelt, D.; Tabbara, R.; Dhollander, T.; Pietsch, M.; Christiaens, D.; Jeurissen, B.; Yeh, C.-H. & Connelly, A. MRtrix3: A fast, flexible and open software framework for medical image processing and visualisation. NeuroImage, 2019, 202, 116137
9. Jenkinson, M., Bannister, P., Brady, J. M. and Smith, S. M. Improved Optimisation for the Robust and Accurate Linear Registration and Motion Correction of Brain Images. NeuroImage, 17(2), 825-841, 2002.
10. Weigel M, Schwenk S, Kiselev VG, Scheffler K, Hennig J. Extended phase graphs with anisotropic diffusion. J. Magn. Reson. 2010;205:276–285.
11. Weiskopf N, Suckling J, Williams G, et al. Quantitative multi-parameter mapping of R1, PD*, MT, and R2* at 3T: a multi-center validation. Front. Neurosci. 2013;7:1–11.
12. Tabelow K, Balteau E, Ashburner J, et al. hMRI – A toolbox for quantitative MRI in neuroscience and clinical research. Neuroimage 2019;194:191–210.
Figures