1789
Feasibility and clinical implementation of ultra-fast GRAPPATINI T2 mapping of the brain: A prospective study1University medical center Mainz, Mainz, Germany, 2Advanced Clinical Imaging Technology, Siemens Healthineers International AG, Lausanne, Switzerland, 3Department of Radiology, Lausanne University Hospital and University of Lausanne, Lausanne, Switzerland, 4LTS5, École Polytechnique Fédérale de Lausanne (EPFL), Lausanne, Switzerland
Synopsis
Keywords: Quantitative Imaging, Relaxometry, T2 Mapping
We aimed to validate the clinical feasibility of the quantitative imaging MR-sequence GRAPPATINI. It offers T2 relaxometry values as well as synthetic T2-weighted images of the whole brain. 10 volunteers for the validation of repeatability and reproducebility on intra- and intersubject level and 52 patients for the morphological comparison between GRAPPATINI and standard T2-weighted sequence were included prospectively. T2 relaxation times of GRAPPATINI are robust and show only little variations among healthy subjects. Larger deviations only were found in caudate nucleus. Moreover its synthetic T2-weighted images achieve good interrater-reliability, although its subjective image quality is not equivalent to standard TSE.
Introduction
The purpose of this study was to evaluate the clinical feasibility of the GRAPPATINI research application, in which a model-based approach for high-speed T2 and M0 quantification (MARTINI) based on k-space subsampling, was complemented by parallel imaging (GRAPPA) to provide a high-resolution T2 mapping in brain imaging 1. Primarily, we focused on validating the repeatability and reproducibility of the estimated relaxation time on intra- and intersubject level2. Additionally, we aimed to compare the morphological quality of one of GRAPPATINIs synthetic T2 images with an echo time of 108 ms with the clinically established T2-turbo spin echo-sequence3.Material
We prospectively included ten volunteers for the validation of the relaxation times and 52 patients for the morphological comparison in this single-center study. All were examined on a 3 Tesla MRI (MAGNETOM Skyra, Siemens Healthcare, Erlangen, Germany). All patients received one GRAPPATINI and one turbo spin echo (TSE) acquisition. Parameters for GRAPPATINI were ΔTE/N‐echoes 10 ms/16 and TR 5420 ms, resolution= 1.2 mm x1.2 mm x 4 mm, total acquisition time= 1:44 min, while parameters for the TSE were TE= 108 ms, TR= 5660 ms, resolution= 0.6 mm x 0.6mm x 4mm, total acquisition time = 1:21 min. The 10 volunteers received three measurements of GRAPPATINI (day one: scan, rescan and day 2: follow-up). Using SPM12, UCL Queen Square Institute of Neurology, London, UK for registration of the three images to the elicited MPRAGE and spatial normalization to MNI-space, we segmented different brain areas using Neuromorphometrics, Inc. 2012 to validate the repeatability and reproducibility of the quantitative relaxation times with an user-independent tool (Figure 1). For morphological comparison, two experienced radiologists assessed the image quality in a blinded, randomized fashion using a Likert scale (1=poor- 4 =excellent), furthermore they measured the largest lesion per patient and counted all lesions of multiple sclerosis patients to obtain intra- and interrater reliability (Figure 2). As an quantitative measure, we calculated a Structural Similarity Index after normalization comparing brightness, contrast, and structure. For statistical analysis, we used R-Statistics and determined interclass correlation (ICC) for intra- and interrater reliability. For the validation of the relaxation times, inter-subject variability was assessed with ICC whereas the coefficient of variation (CoV) served for the comparison on a intra-subject-level.Results
GRAPPATINI and standard T2 TSE were successfully acquired in all participants. Ten volunteers (5 men/5 women) with a mean age of 25 years and an age range of 22-31 years were included in the sub-study of T2 relaxation time robustness. We included 52 patients (23 men/29 women) with a mean age of 55 years and an age range of 22-83 years. The clinical indications for MRI imaging showed a wide spectrum. Within an individual, all brain areas except the caudate nucleus (7.25%) showed only small coefficients of variation (0.73%-2.06%) in rescan, while follow-up also showed only minor variations (0.72%-1.59%, caudate nucleus 4.78%). Larger differences existed at inter-subject level. Rescan showed moderate reliability in caudate nucleus, globus pallidus, putamen, and cerebellar WM. Good to excellent reliability was achieved in the cerebral WM, thalamus, gray matter, and brainstem. At follow-up, brainstem, gray matter, and thalamus showed excellent reproducibility. Putamen, caudate nucleus, globus pallidus, cerebellar WM, and cerebral WM showed good reproducibility. However, caudate nucleus, globus pallidus, and putamen showed a wide range in the 95% confidence interval of ICC from poor to excellent. No systematic error was detected based on bias (Figure 3).Wilcoxon-rank-sum-test revealed that the standard T2 sequence was rated significantly superior to GRAPPATINI in all aspects (p≤.001). Multiple sclerosis lesion counting showed an intra-rater reliability of 0.65 (0.22 < ICC < 0.87) for reader one and 0.79 (0.47 < ICC < 0.93) for reader two, as well as an interrater agreement of 0.96 (0.89 < ICC < 0.99) for standard T2 and 0.85 (0.61< ICC <0.95) for GRAPPATINI. The measurements of the largest lesion showed moderate to good intra-rater reliability between both sequences. For standard T2, good to excellent interrater reliability was achieved. For GRAPPATINI, moderate to good interrater reliability was obtained for length and poor to moderate interrater reliability for width (Figure 4). The Structural Similarity Index could be determined in 50 of the 52 patients. The median was 0.78 with an interquartile range of 0.1 (moderate/good). It ranged from poor (0.42) to good (0.85). The distribution of the data is visualized in Figure 5a Violin Plot. A subtraction image is shown in Figure 5b to visualize, in which areas greater differences appeared. In particular, the two sequences differed at the gray-white matter borders.
Conclusion
The T2 relaxation times of GRAPPATINI are robust and show little variations among healthy subjects. Moreover its synthetic T2-weighted images are obtained without further time consumption and achieve good interrater-reliability, although its subjective image quality is not equivalent to standard T2. Overall, GRAPPATINI is a T2-weighted sequence with an acquisition time of 1:44 min that produces both, robust relaxation times and morphologically useful images. In this study, we have laid the foundation to focus on the interpretation of T2 relaxation times in brain imaging.Acknowledgements
No acknowledgement found.References
1. Hilbert T, Sumpf TJ, Weiland E, et al. Accelerated T2 mapping combining parallel MRI and model-based reconstruction: GRAPPATINI. Journal of magnetic resonance imaging : JMRI. 2018;48(2):359-368.
2. Crombé A, Buy X, Han F, et al. Assessment of Repeatability, Reproducibility, and Performances of T2 Mapping-Based Radiomics Features: A Comparative Study. Journal of magnetic resonance imaging : JMRI. 2021;54(2):537-548.
3. Raudner M, Toth DF, Schreiner MM, et al. Synthetic T2-weighted images of the lumbar spine derived from an accelerated T2 mapping sequence: Comparison to conventional T2w turbo spin echo. Magnetic Resonance Imaging. 2021;84:92-100.
Figures
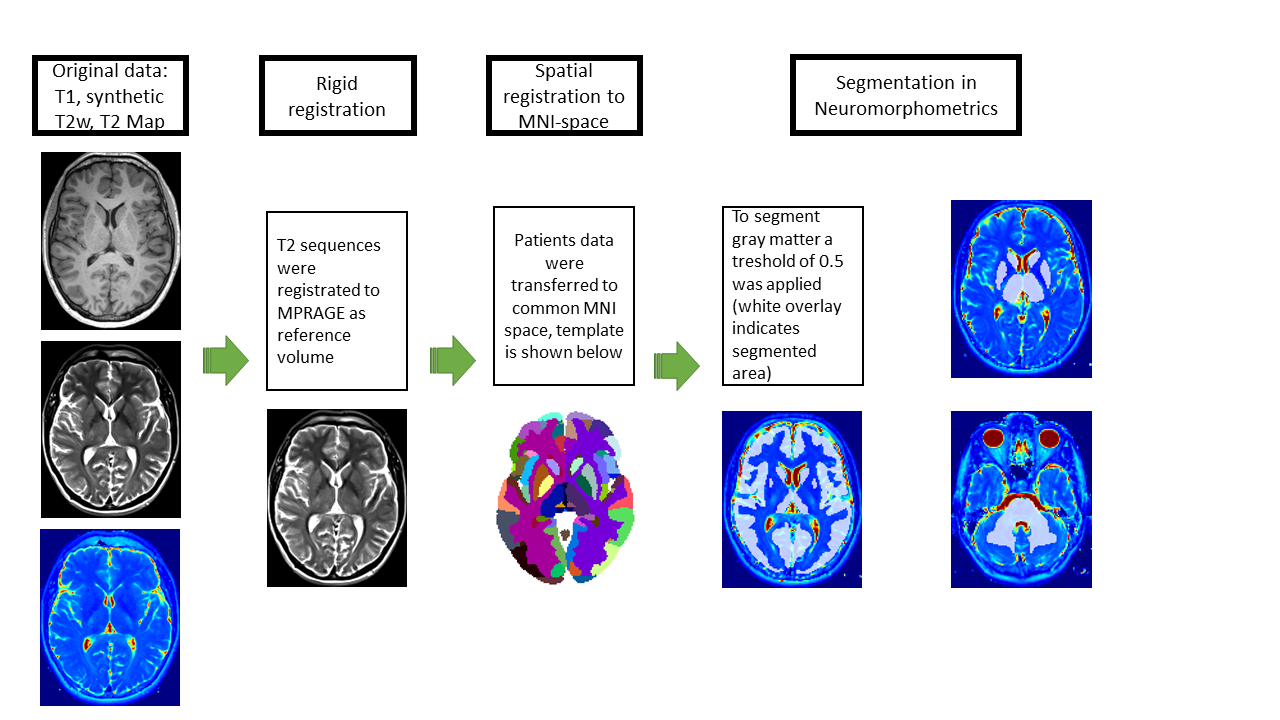
Figure 1 Processing pipeline: Original data included T1-weighted MPRAGE as reference volume (top left), synthetic T2-w with an TE of 108 ms (middle left) and GRAPPATINI (bottom left). To segment gray matter, a treshold of 0.5 was applied (white overlay indicates segmented as gray matter). Two different examples of segmentation templates are shown in the right column. Image on the top right shows segmented thalamus and caudate nucleus. On the bottom right the segmentation of brain stem and cerebellar white matter is demonstrated. The last step was to extract the T2 values.
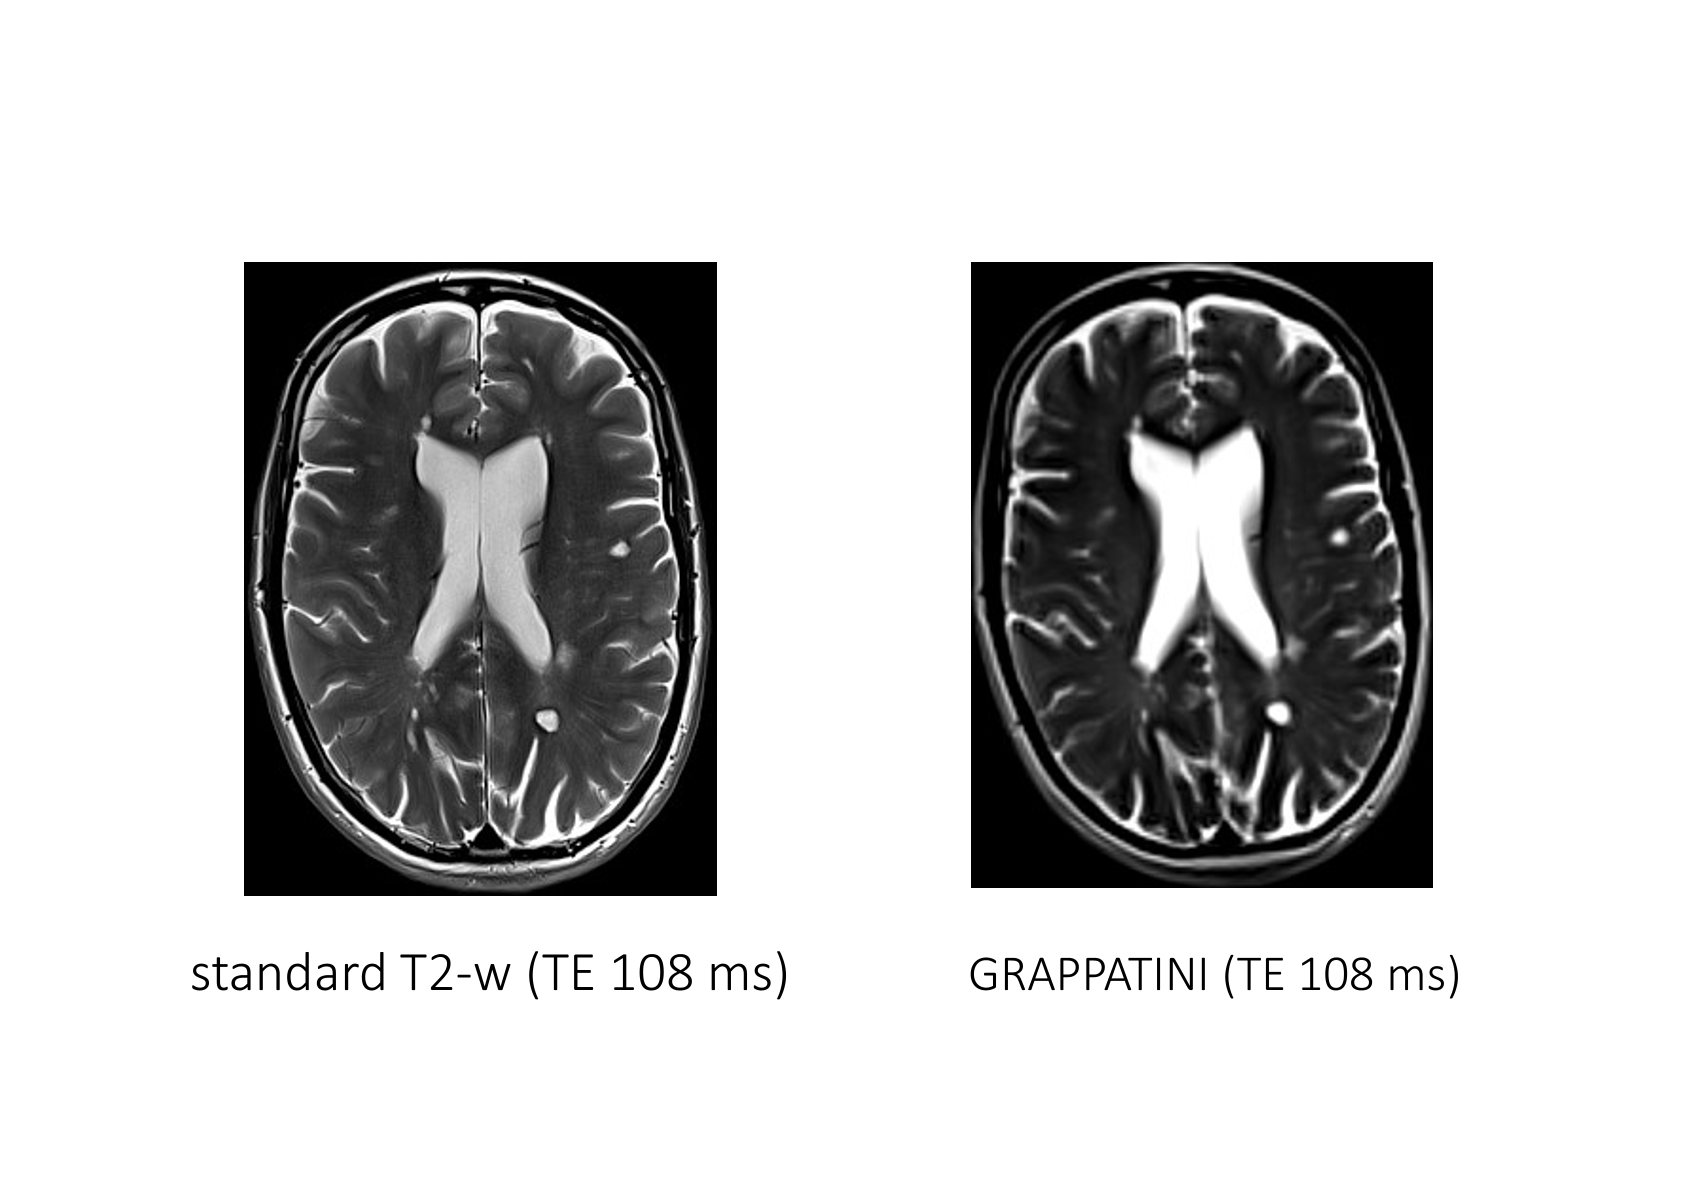
FIGURE 2 Morphologic comparison: The same transverse slice of both sequences in a 42-year-old female patient with multiple sclerosis is shown. Image quality criteria that were evaluated included noise level, sharpness, contrast, artifacts, overall image quality, diagnostic confidence, naturality, and conspicuity of lesions. All detected lesions were summed up and the largest lesion was measured (length and width).

Figure 3 T2 values: Standard deviation, medians, interquartile range (IQR) and modal values were determined for each segmented brain area. The collected relaxation times were quantified by their average medians per brain area and their standard deviations (SD). To determine the repeatability and reproducibility on intra-subject level, the coefficient of variance with its 95% confidence interval and for the inter-subject level the interclass coefficient with its 95% confidence interval were determined. In addition, we identified the bias (%) to detect systematic errors.
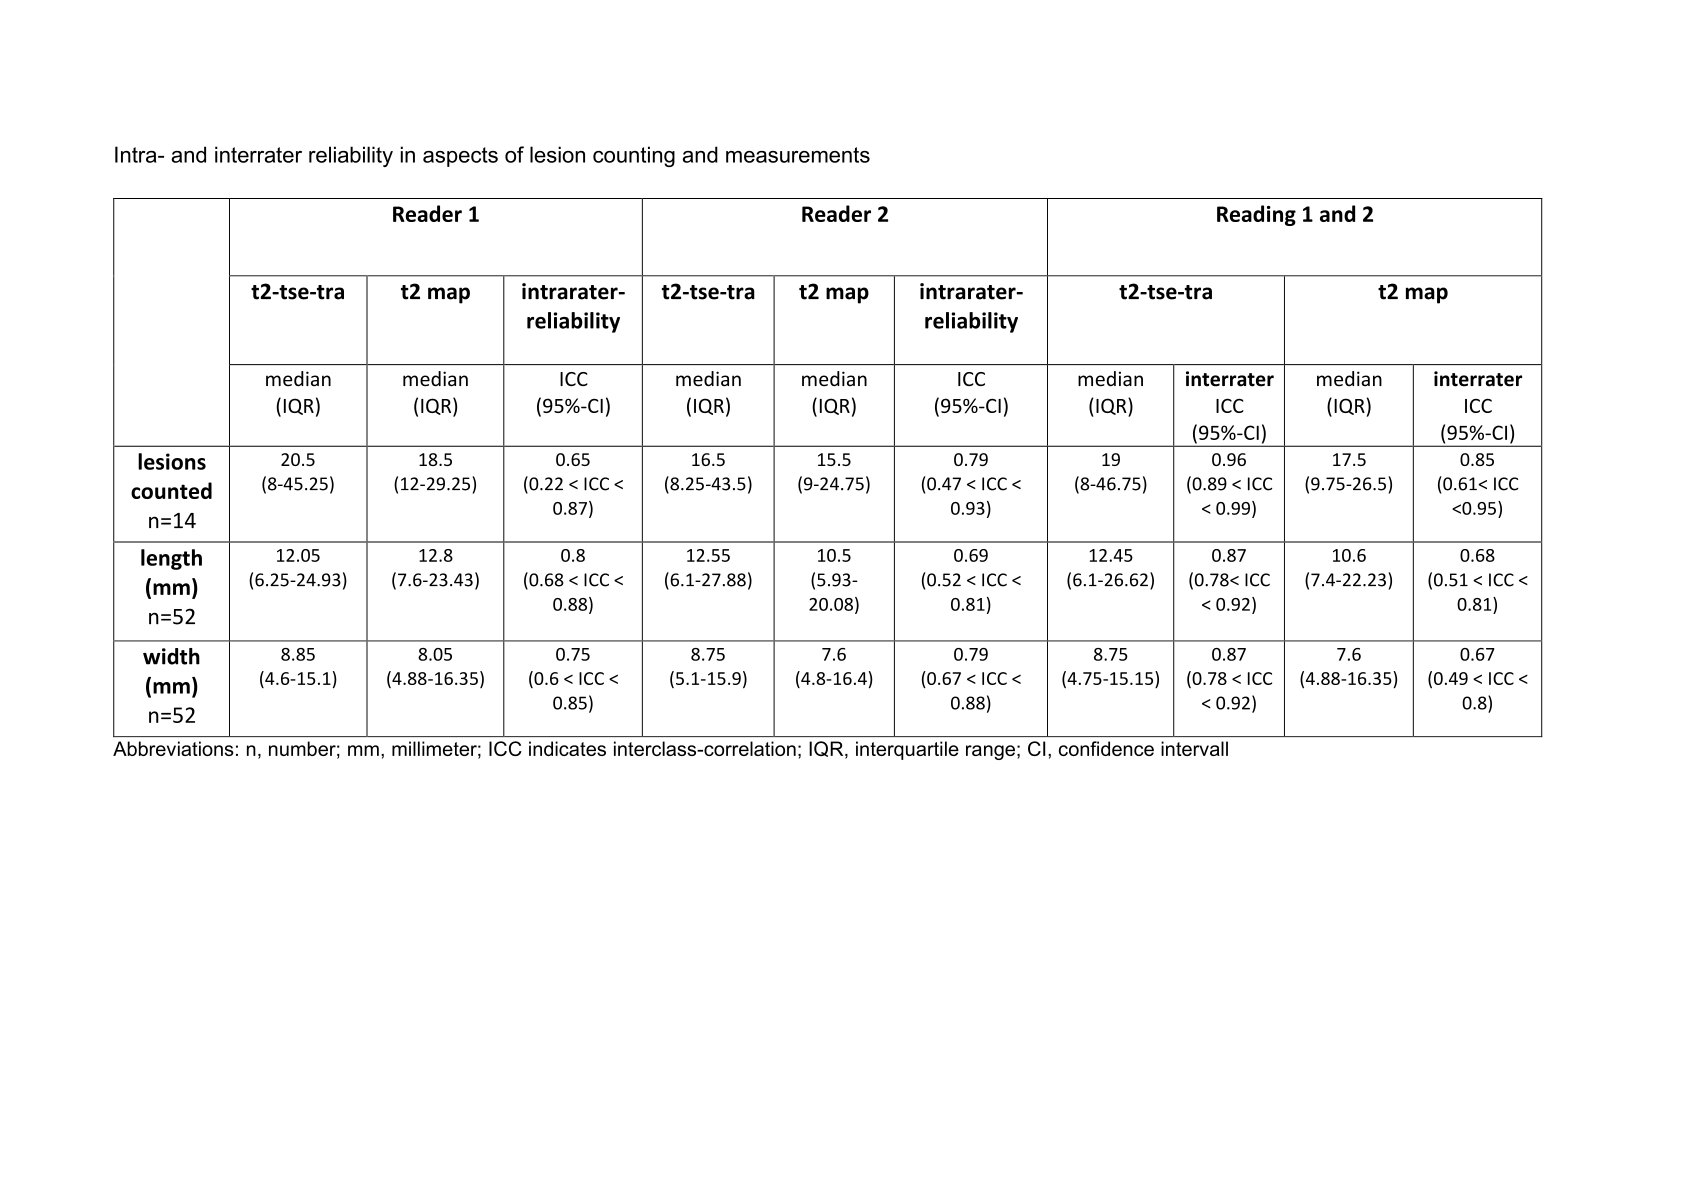
Figure 4 Multiple sclerosis lesion counting: Revealed an intrarater reliability of 0.65 for reader 1 and 0.79 for reader 2, as well as an interrater agreement of 0.96 (0.89 < ICC < 0.99) for standard T2-w and 0.85 (0.61< ICC <0.95) for GRAPPATINI. The measurements of the largest lesion showed moderate to good intrarater reliability between both sequences for length and width. For standard T2-w, good to excellent interrater reliability was achieved. For the GRAPPATINI, moderate to good interrater reliability was obtained for length and poor to moderate interrater reliability for width.
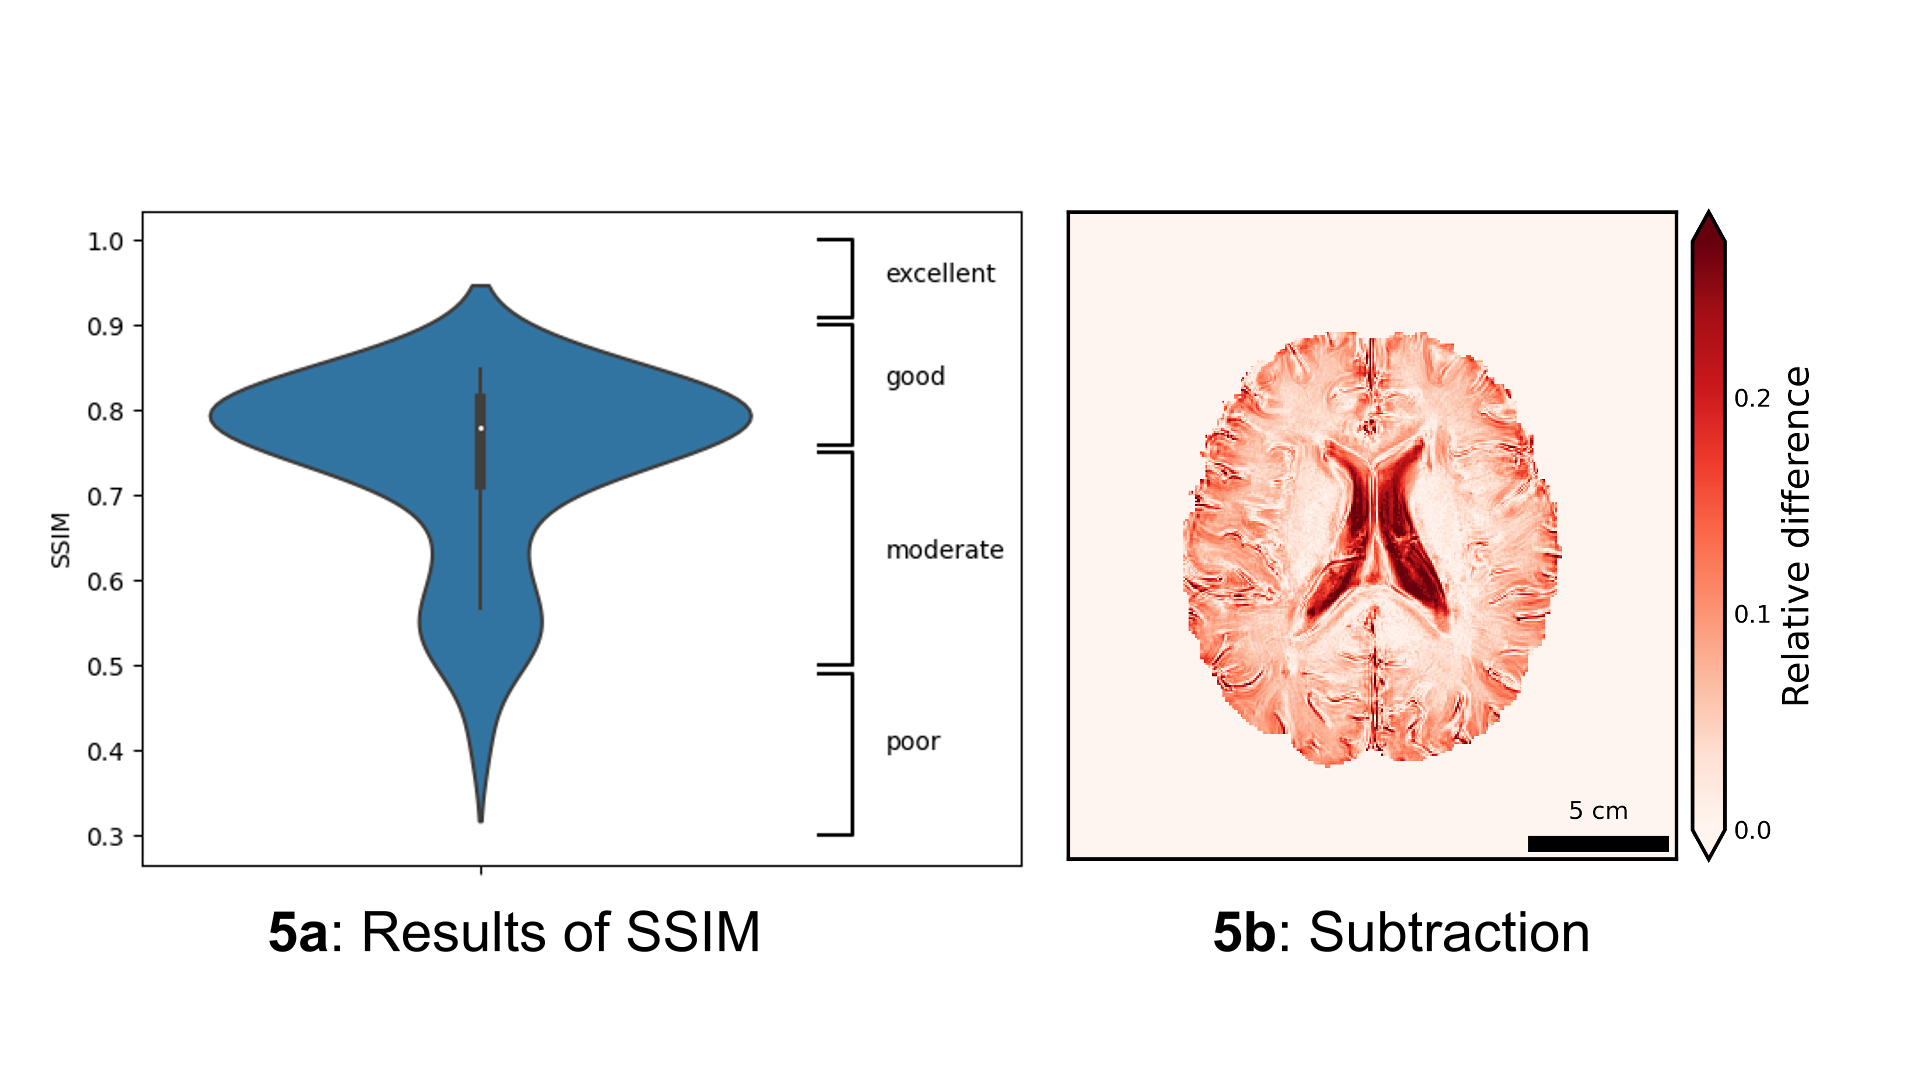
Figure 5a Results SSIM: Demonstrated is the distribution of the resulting Structural similarity indices between T2-map and standard T2 tse. 50 patients could be included in our analysis.
5b: Subtraction of standard T2 tse and GRAPPATINI (TE:108 ms): To obtain a subtraction image, both sequences had to be normalized in aspects of their gray values from 0 to 1. Skull stripping was performed. After that, subtraction could be done. Red indicates greater differences, white indicates no difference in this voxel.