1788
Signal intensity form of extended Tofts model for quantitative analysis of dynamic contrast enhanced MRI data1Radiology, The University of Chicago, Chicago, IL, United States
Synopsis
Keywords: Quantitative Imaging, Cancer
The extended Tofts model (ETM) requires calculation of contrast agent concentration in tissue as function of time (C(t)) using a non-linear model that results in error propagation. Here, we introduce a signal intensity (S(t)) form of ETM (SI-ETM) without calculating C(t). QIBA DCE-MRI data was used to validate the SI-ETM, and then human prostate DCE-MRI data were analyzed to compare physiological parameters calculated from the ETM and the SI-ETM. The parameters calculated from S(t) were strongly correlated with the values calculated from C(t). Bland–Altman analysis showed good agreement between the parameters calculated from the ETM and the SI-ETM.INTRODUCTION
Quantitative analysis of dynamic contrast enhanced (DCE) MRI provides valuable information for detection and diagnosis of cancers. The standard Tofts model (TM) and extended Tofts model (ETM) are the most common pharmacokinetic models used to extract physiological parameters (Ktrans, ve and vp)[1-3]. However, use of pharmacokinetic models requires calculation of contrast agent concentration in tissue as a function of time (C(t)) based on T1-weighted signal intensity (S(t)). The C(t) can be calculated by using the gradient echo signal equation (non-linear model) with pre-contrast tissue T1 values[4]; or by using the ‘reference tissue’ model under a simple linear approximation[5]. The C(t) calculated from the non-linear model is more accurate than the ‘reference tissue’ model, but its precision is strongly influenced by the native T1 values. Measurements of pre-contrast tissue T1 values also contribute error to calculations of C(t) using non-linear model. To address this problem, Fan et al. developed a signal intensity form of standard Tofts model[6].In this study, the signal intensity form of extended Tofts model (SI-ETM) was developed and validated using simulated DCE-MRI data from the Quantitative Imaging Biomarkers Alliance (QIBA)[7]. Furthermore, the physiological parameters calculated from the ETM using S(t) were compared with results obtained using C(t) for human prostate DCE-MRI data.
THEORY and METHODS
Changes of C(t) in tissue following bolus contrast agent injection are described by the standard TM of DCE-MRI. Based on a ‘reference tissue’ model for calculating C(t), Fan et al. developed signal intensity form of standard TM as follows[6]:$$S_r(t)=\lambda\frac{S_b(0)}{S(0)(1-Hct)}K^{trans}\int_{0}^{t}S_p(\tau)exp[-\lambda(t-\tau)K^{trans}/v_e]d\tau,-----(1)$$
where Ktrans is the volume transfer constant between blood plasma and extravascular extracellular space (EES), ve is the volume of EES per unit volume of tissue, 𝜆=T1blood/T1tissue is ratio of T1 in blood to T1 in tissue, Hct is the hematocrit, $$$S_r(t)=\frac{S(t)-S(0)}{S(0)}$$$ and $$$S_p(t)=\frac{S_b(t)-S_b(0)}{S_b(0)}$$$, Sb(t) is signal intensity in blood, S(0) and Sb(0) are signal intensities at baseline for tissue and blood, respectively. Here we introduce the SI-ETM as follows:
$$S_r(t)=\lambda\frac{S_b(0)}{S(0)(1-Hct)}\left[K^{trans}\int_{0}^{t}S_p(\tau)exp[-\lambda(t-\tau)K^{trans}/v_e]d\tau+v_pS_p(\tau)\right],-----(2)$$
where vp is the volume fraction of the plasma space.
The SI-ETM model was validated with DCE-MRI data provided by the QIBA. The parameters calculated from the ETM were compared with the values calculated from the SI-ETM.
As a clinical application of the SI-ETM, eighteen patients with biopsy-confirmed prostate cancer were included in this IRB-approved study. MRI data were acquired on a Philips Achieva 3T-TX scanner. After the required clinical MRI scans, DCE 3D-T1-FFE data were acquired pre- and post-contrast media injection (0.1 mmol/kg DOTAREM; TR/TE=3.5/1.0 ms, FOV=180×180 mm , matrix size =160×160, flip angle=10°, slice thickness=3 mm, typical number of slices=24, SENSE factor=3.5, half scan factor=0.625) for 150 dynamic scans with typical temporal resolution of 2.2 s/image (1.0-4.3 s).
Regions-of-interest (ROIs) for prostate cancer, normal tissue in different prostate zones were drawn on T2W images and transferred to DCE images. ROI’s for blood vessels were manually traced on the iliac artery on a slice with cancer. For each ROI, the average S(t) was calculated, and then C(t) was calculated from the non-linear model. Normalized root-mean-square-errors (NRMSE) were calculated between data and corresponding fits. Pearson’s correlation coefficient was calculated between parameters obtained from C(t) and S(t). Bland-Altman analysis was performed to evaluate the agreement of the ETM and SI-ETM in calculating parameters. Receiver operating characteristic (ROC) analysis was used to evaluate performance in differentiating cancer from normal tissue.
RESULTS
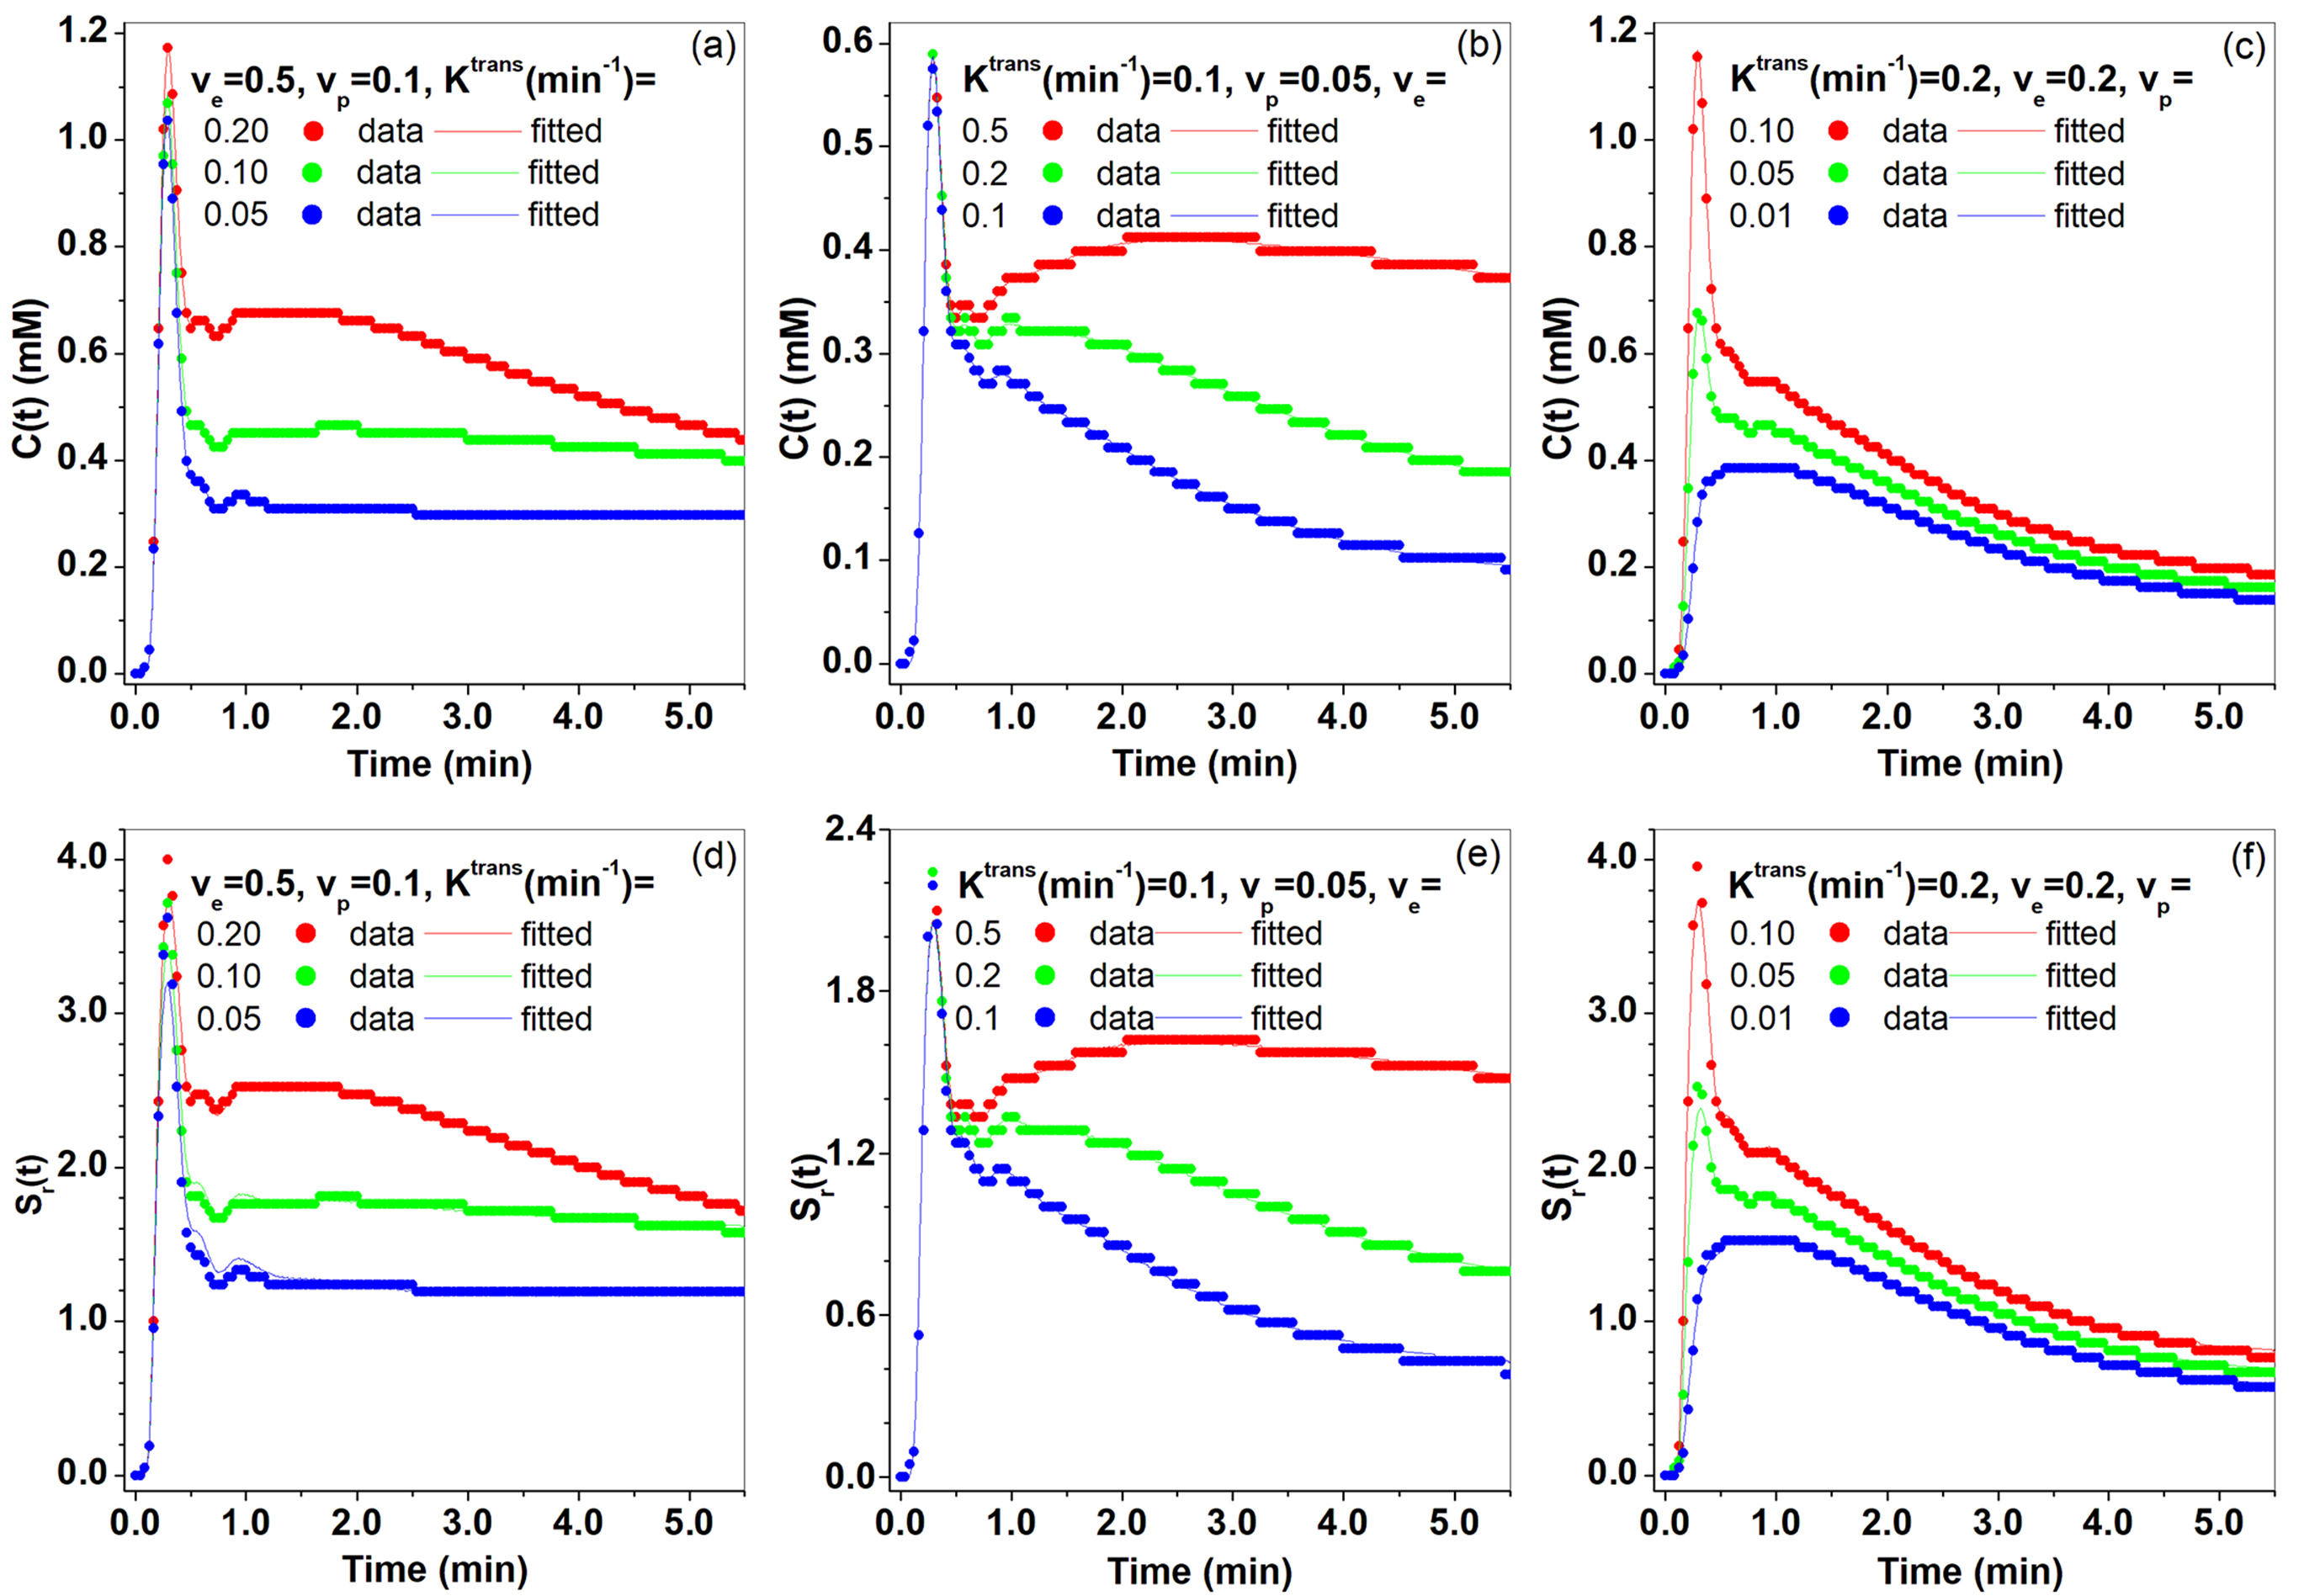
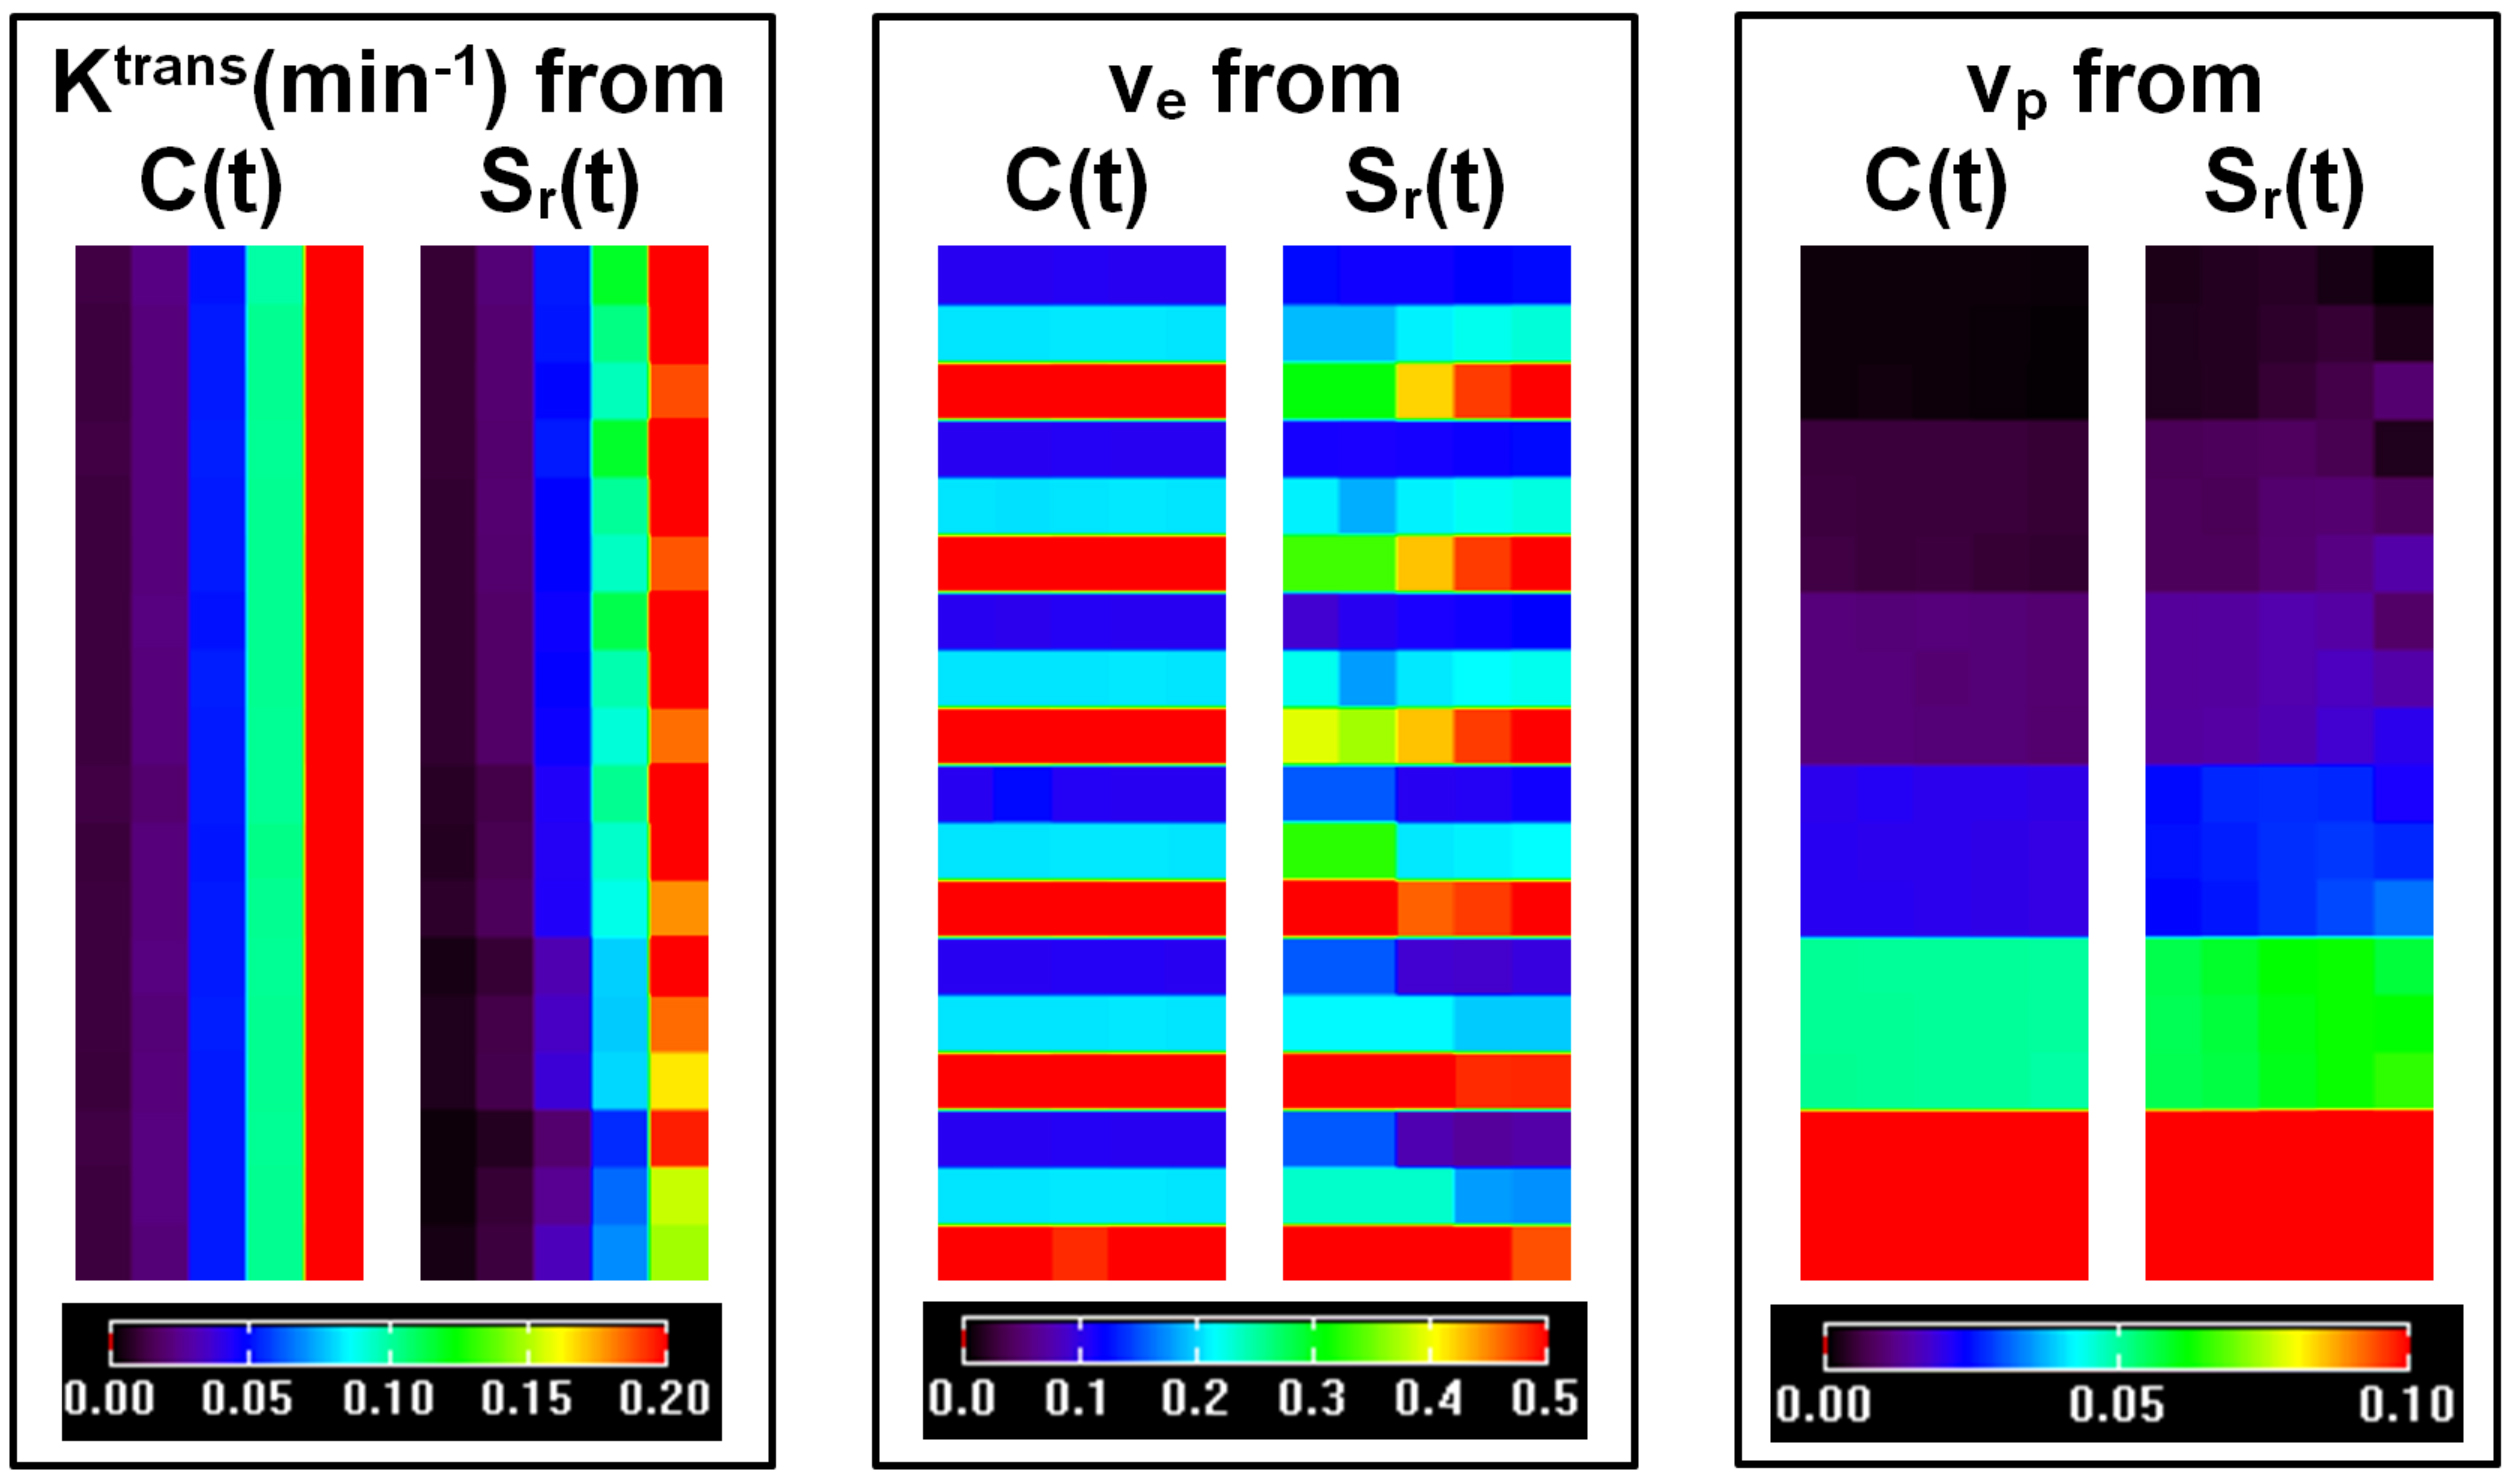
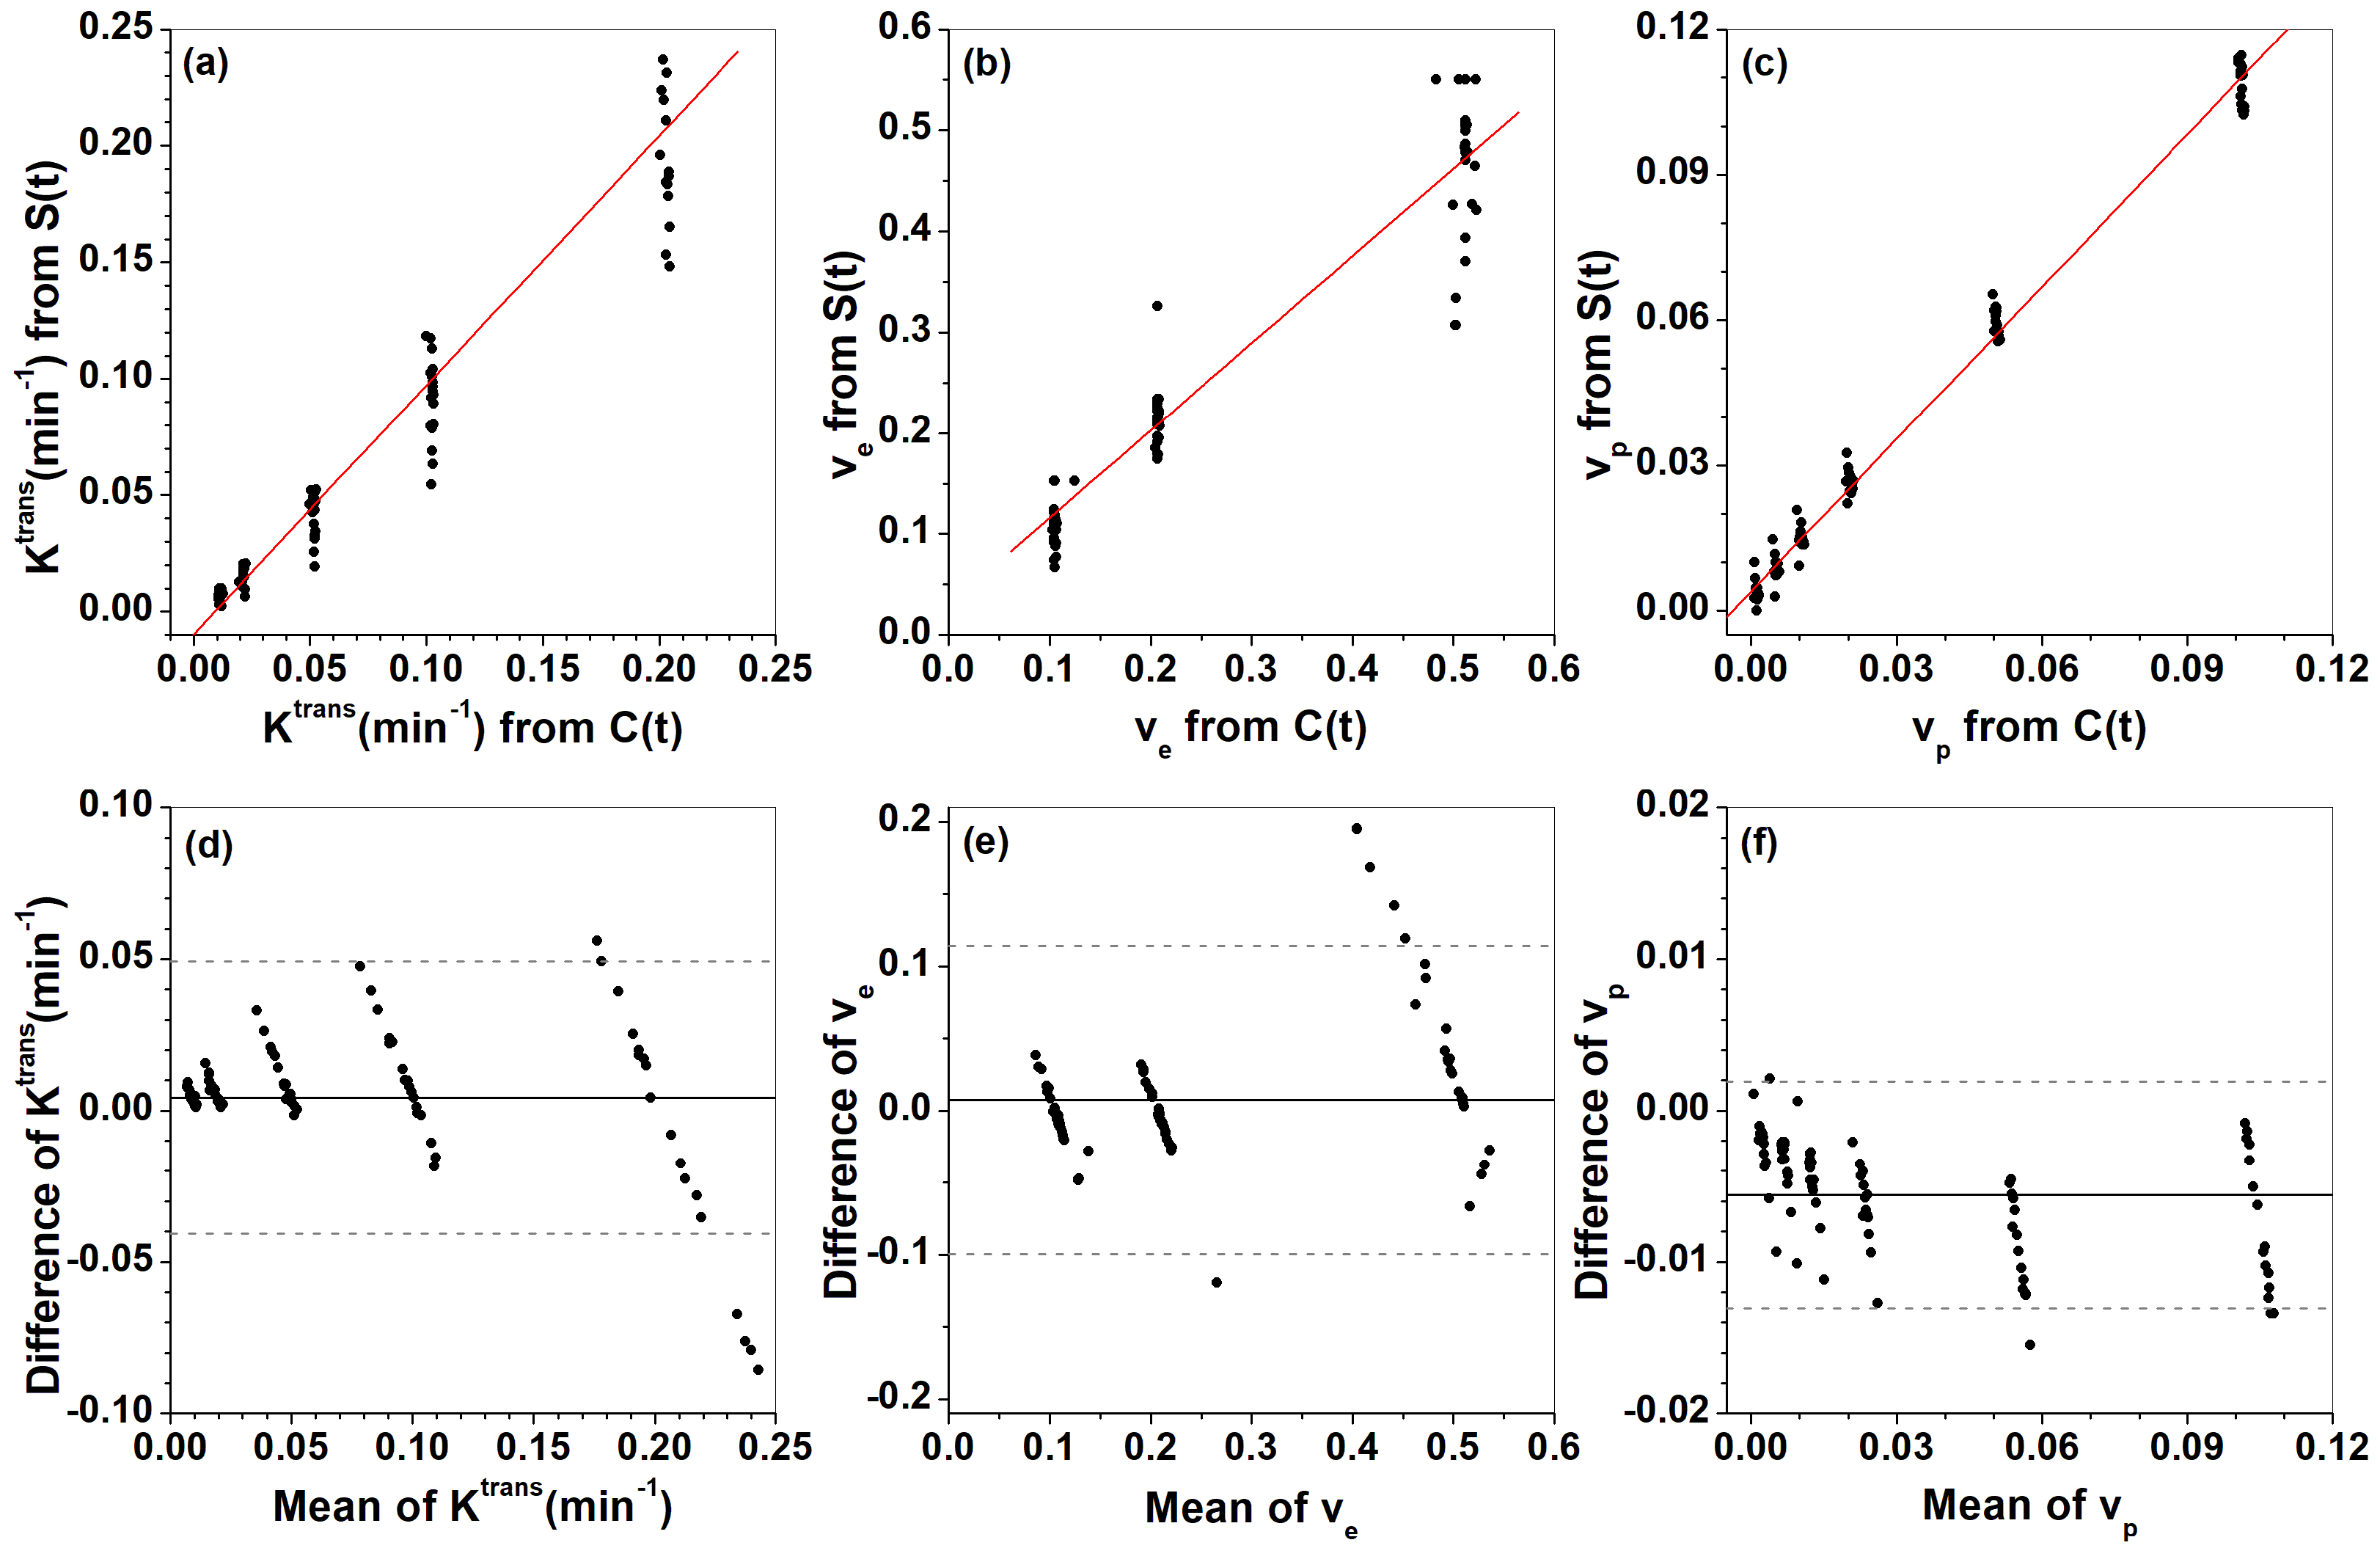
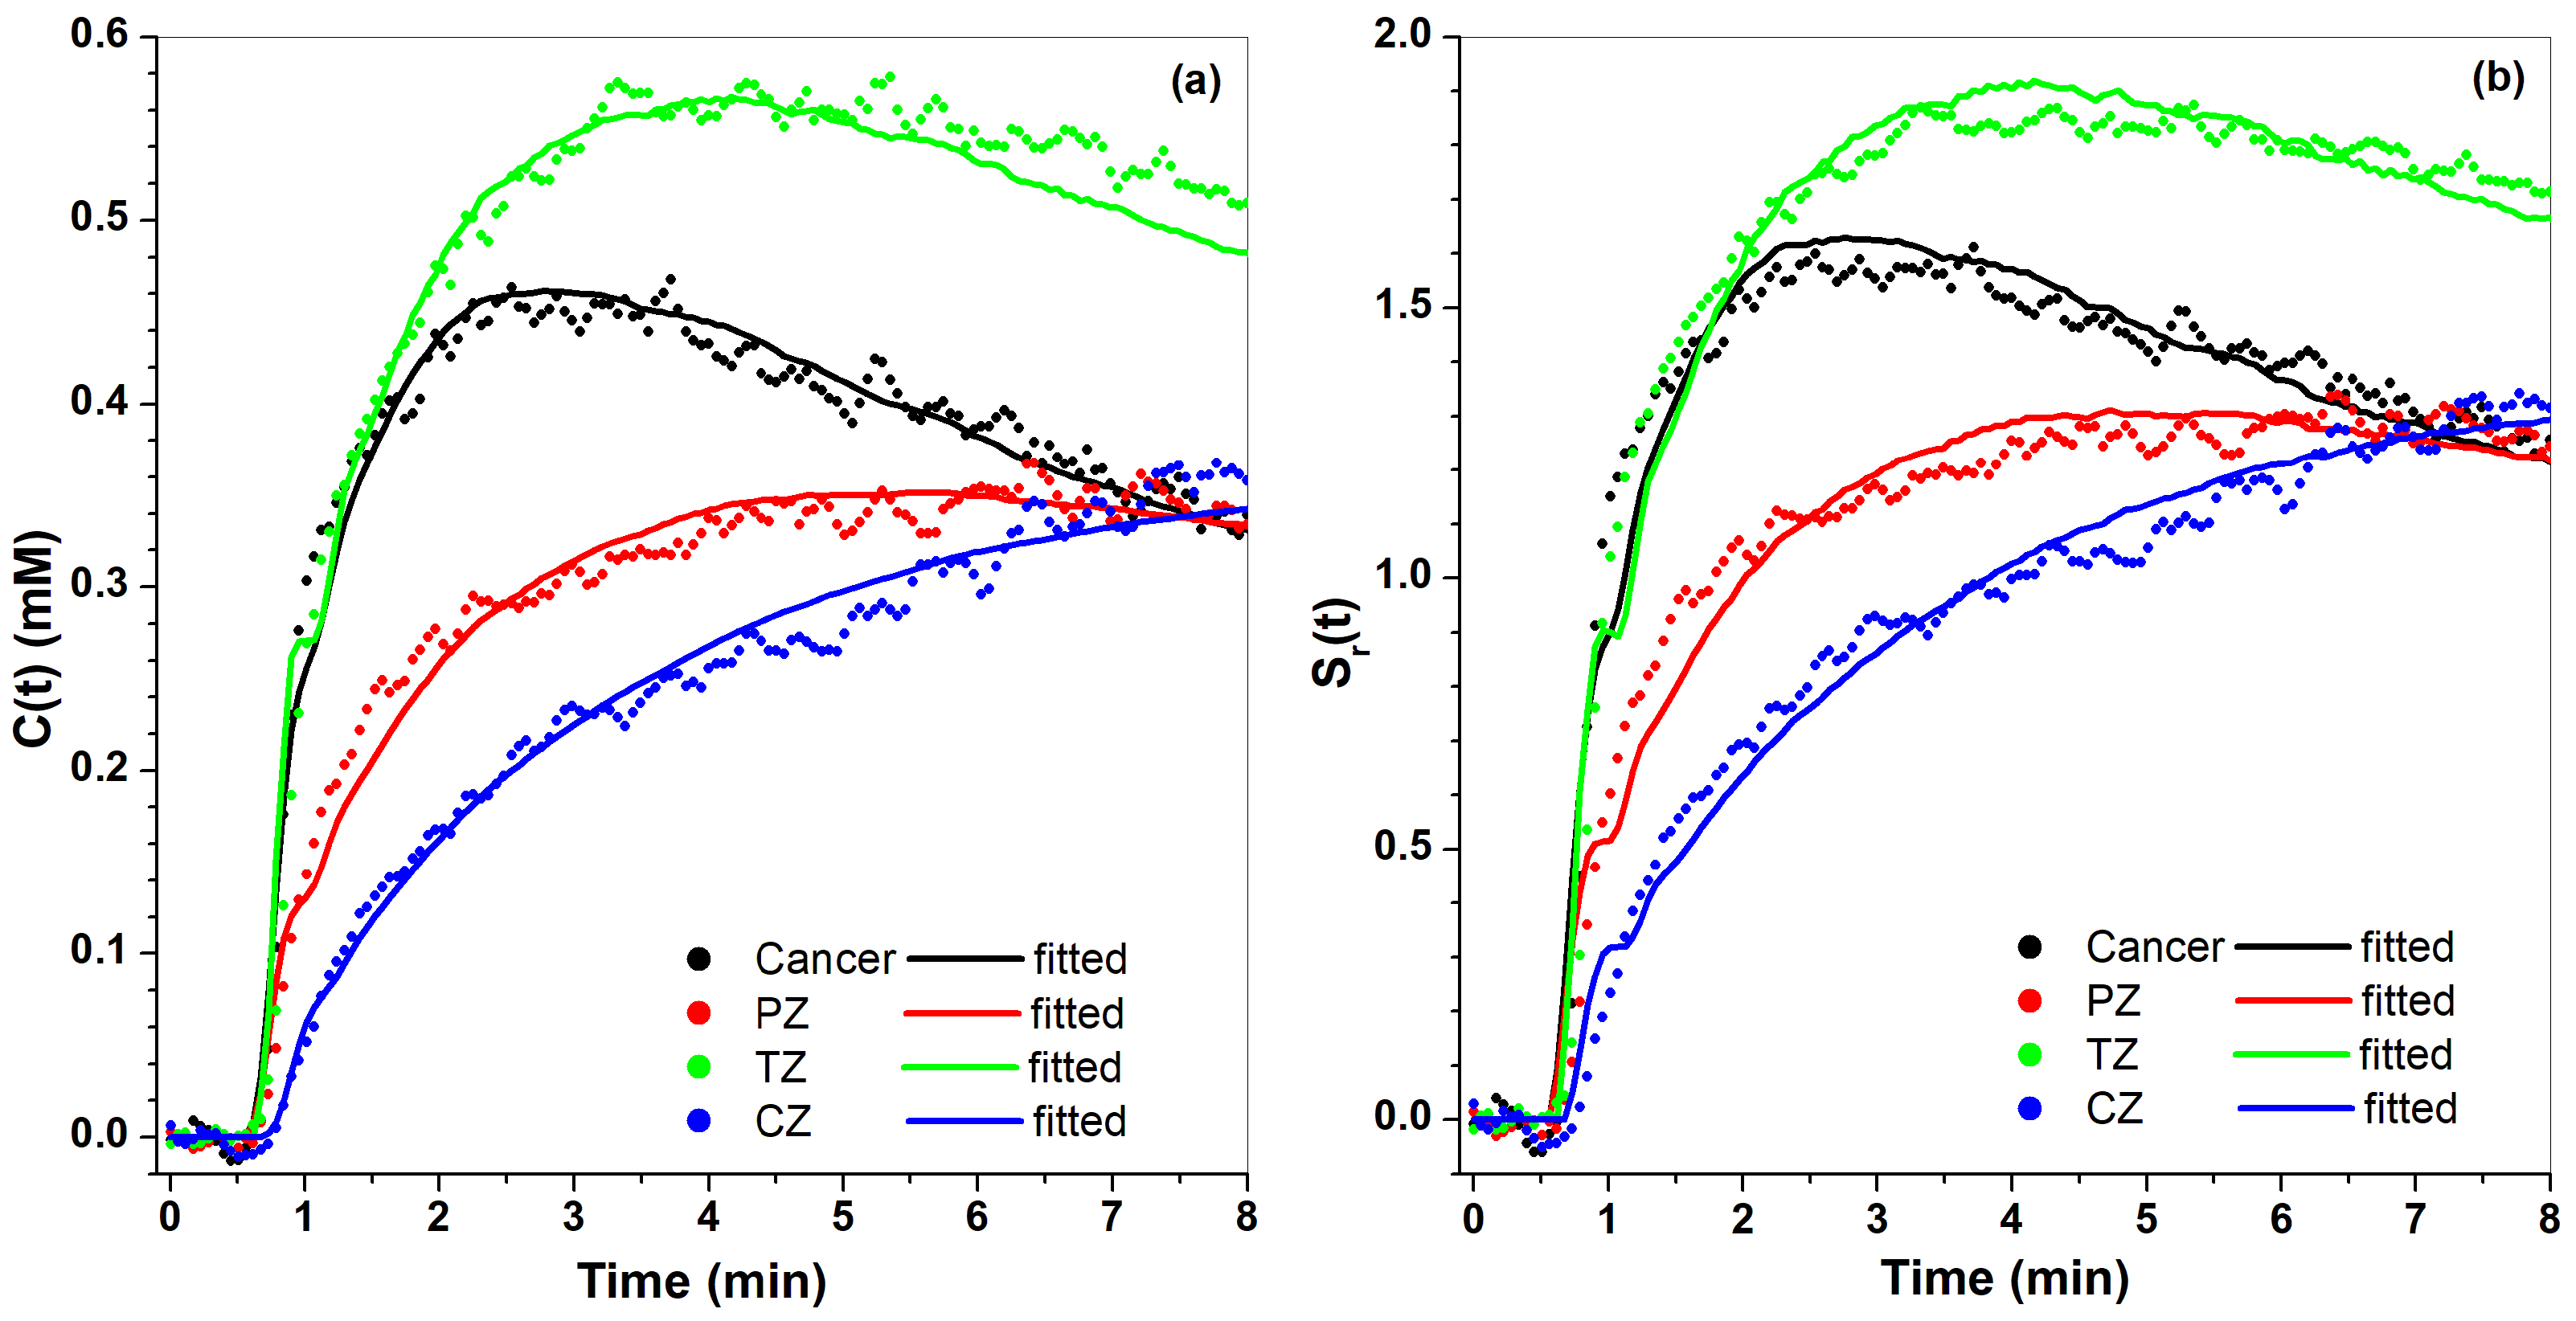
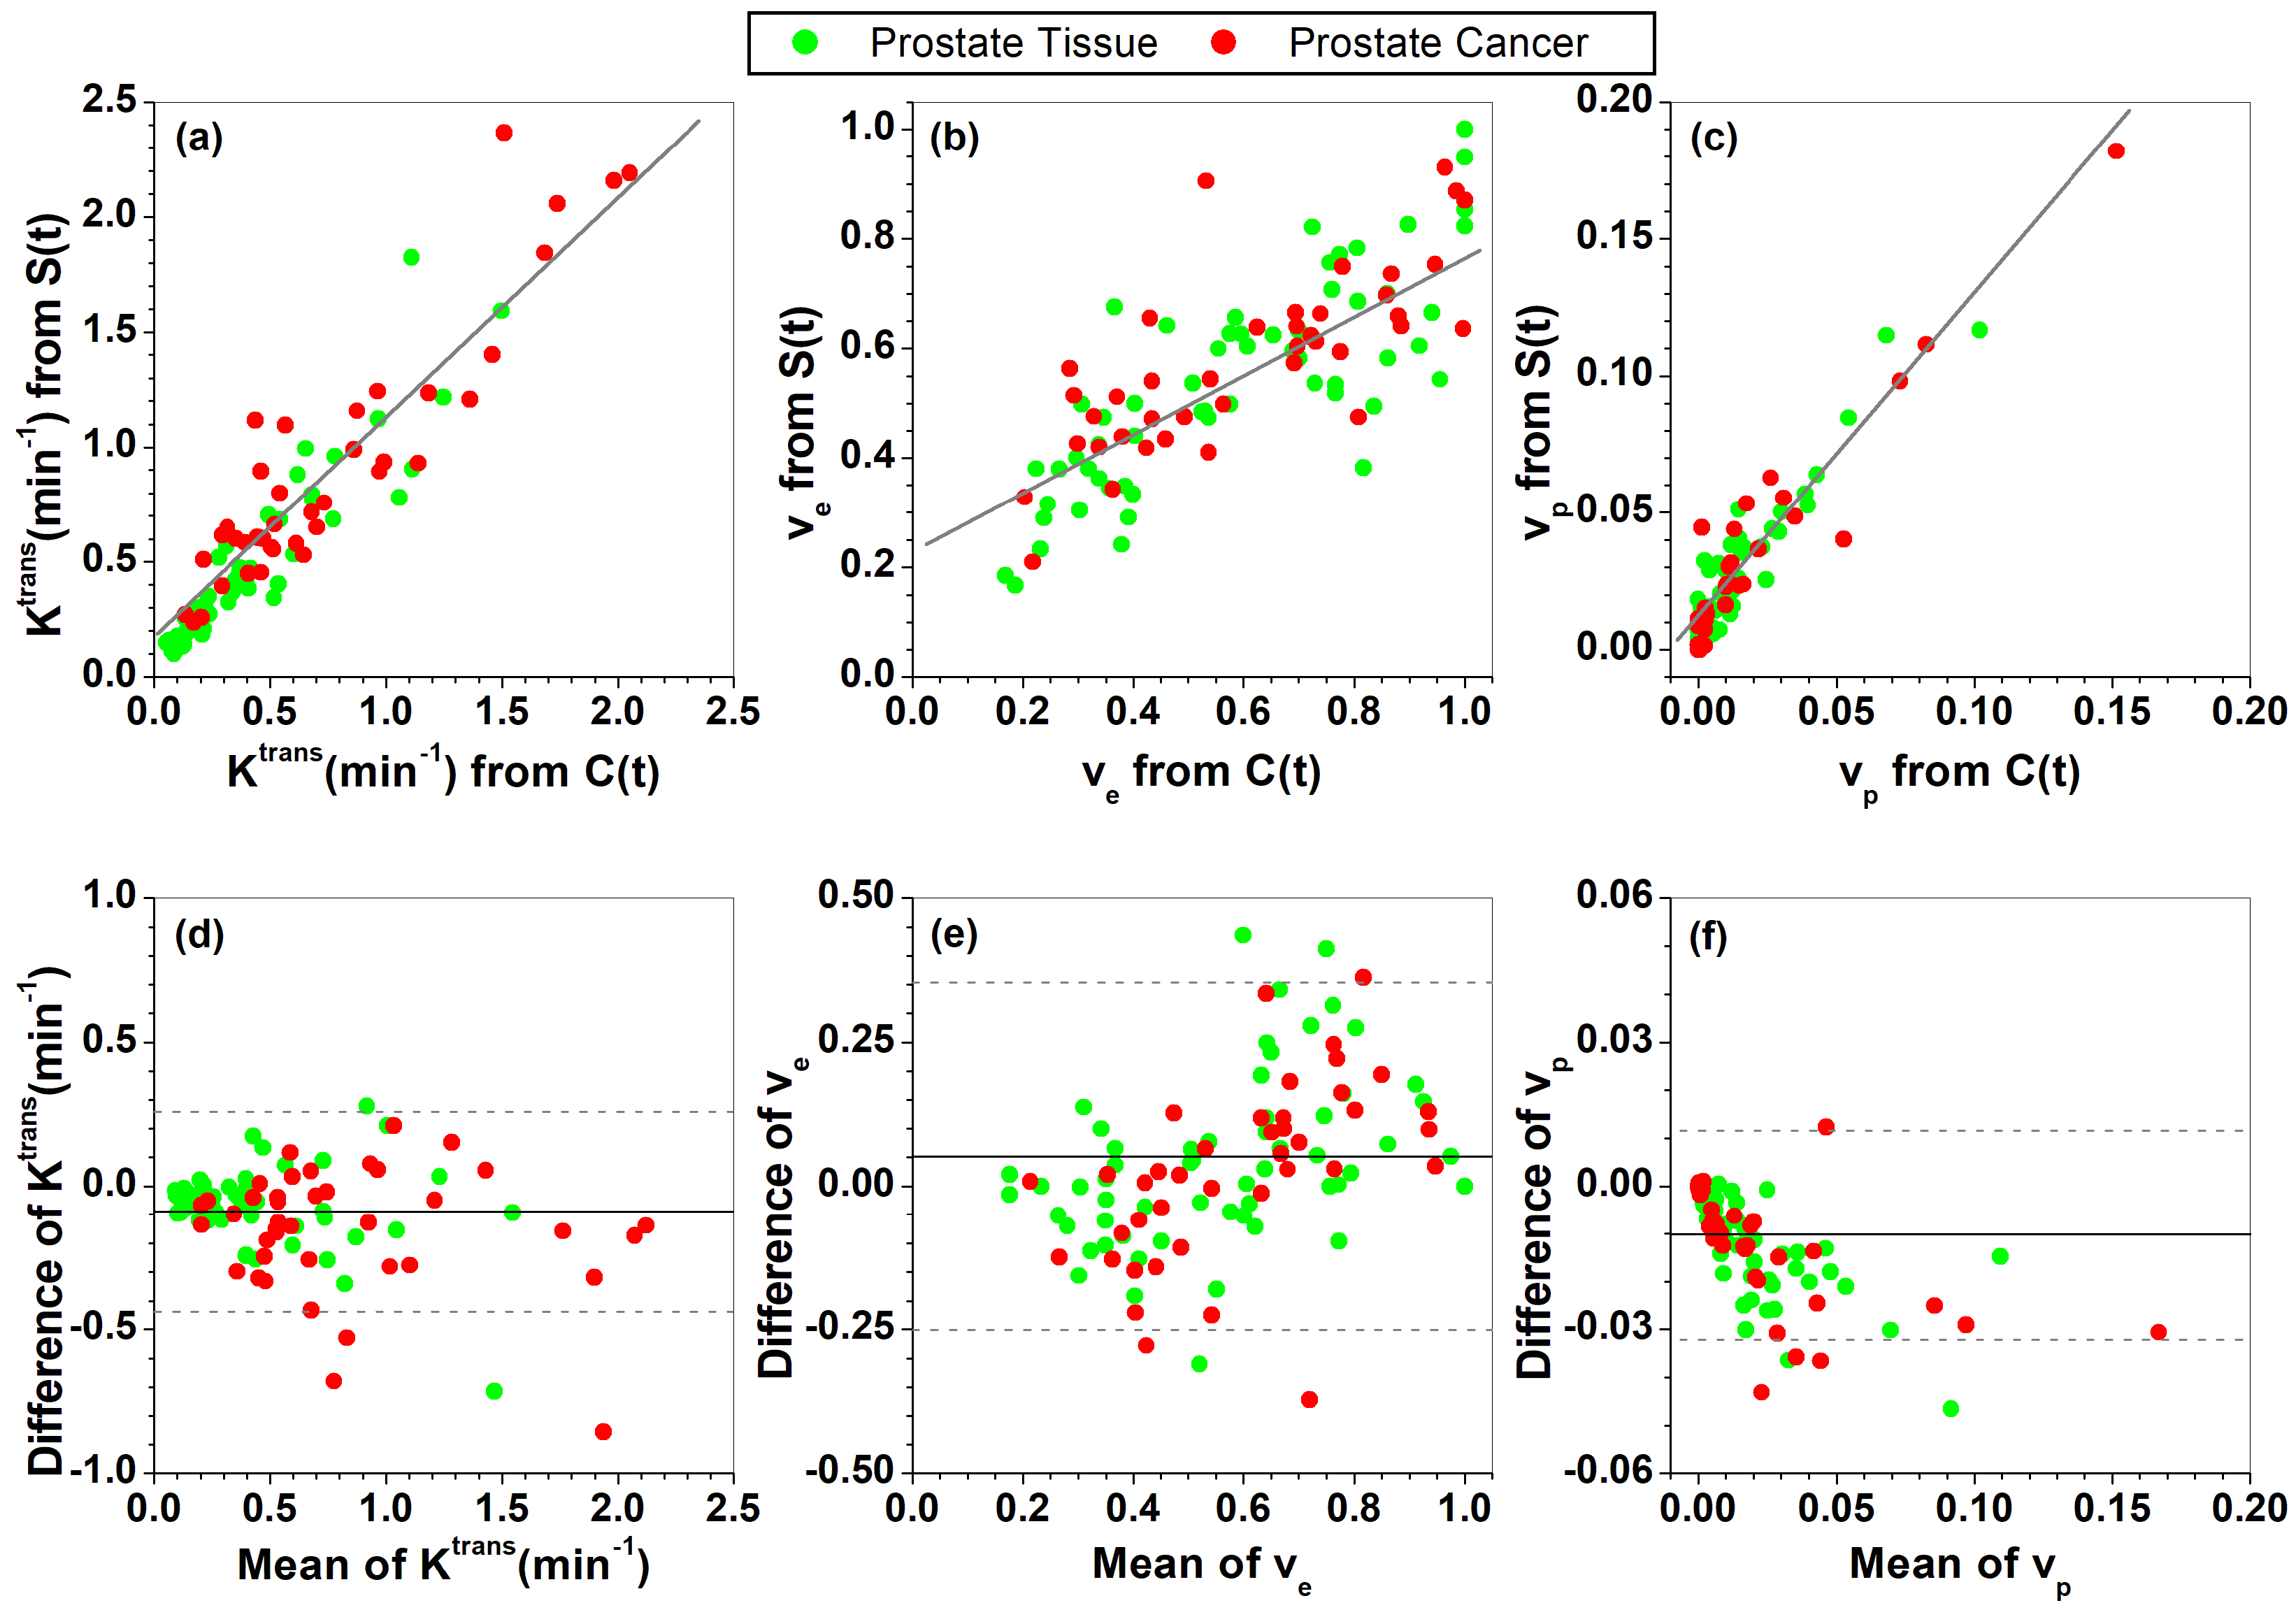
For the QIBA DCE-MRI data, Figure 1 shows comparisons of fits C(t) and Sr(t) between the ETM and SI-ETM. There were small errors in fits from the SI-ETM model. Figure 2 shows comparisons of Ktrans, ve, and vp maps obtained between the ETM and SI-ETM. The scatter plots (Fig. 3(a-c)) shows there were strong correlations (r>0.85, p<0.0001) for parameters obtained between C(t) vs. Sr(t). Bland-Altman analysis (Fig. 3(c-d)) shows good agreement for parameters obtained between C(t) vs. Sr(t).For human prostate DCE-MRI data, Figure 4 shows plots of C(t) and Sr(t) as well as corresponding fits from the ETM and SI-ETM for a 66-year-old patient over ROIs of cancer and normal prostate tissue. There was no difference in average NRMSE (0.046 vs. 0.047) between fits of the ETM and SI-ETM. Finally for all 18 patients, Figure 5 (a-c) shows scatter plots of Ktrans, ve, and vp obtained between the ETM and SI-ETM. There was strong correlation (r>0.85, p< 0.0001) between parameters calculated between these two methods. The corresponding Bland–Altman plots (d-f) shows good agreement between parameters calculated between the ETM and SI-ETM. ROC analysis yielded area under the curve of 0.760 and 0.805 for Ktrans obtained between the ETM and SI-ETM, respectively.
DISCUSSION
The SI-ETM was developed and validated by the QIBA DCE-MRI data. The physiological parameters calculated from the ETM and SI-ETM were very similar and provided equal power in differentiation between cancer and normal tissue. The main advantage of using the SI-ETM model with Sr(t) is that it avoids error propagation associated with calculation of C(t). Implementation of the SI-ETM in clinical practice may facilitate quick estimation of physiological parameters.CONCLUSION
The SI-ETM of DCE-MRI could be used as alternative of the ETM in calculating physiological parameters when there was difficulty to calculate tissue contrast agent concentrations.Acknowledgements
This research is supported by National Institutes of Health (R01 CA172801-01, R01 CA218700-01, and 5U01 CA142565-09).References
[1] Tofts PS. J Magn Reson Imaging. Modeling tracer kinetics in dynamic Gd-DTPA MR imaging. 1997; 7(1):91-101.
[2] Tofts PS, Brix G, Buckley DL, Evelhoch JL, Henderson E, Knopp MV, Larsson HB, Lee TY, Mayr NA, Parker GJ, Port RE, Taylor J, Weisskoff RM. Estimating kinetic parameters from dynamic contrast-enhanced T(1)-weighted MRI of a diffusable tracer: standardized quantities and symbols. J Magn Reson Imaging. 1999; 10(3):223-32.
[3] Sourbron SP, Buckley DL. On the scope and interpretation of the Tofts models for DCE-MRI. Magn Reson Med. 2011;66(3):735-45.
[4] Dale BM, Jesberger JA, Lewin JS, Hillenbrand CM, Duerk JL. J Magn Reson Imaging. Determining and optimizing the precision of quantitative measurements of perfusion from dynamic contrast enhanced MRI. 2003; 18(5):575-84.
[5] Medved M, Karczmar G, Yang C, Dignam J, Gajewski TF, Kindler H, Vokes E, MacEneany P, Mitchell MT, Stadler WM. Semiquantitative analysis of dynamic contrast enhanced MRI in cancer patients: Variability and changes in tumor tissue over time. J Magn Reson Imaging. 2004; 20(1):122-8.
[6] Fan X, Chatterjee A, Medved M, Oto A, Karczmar GS. Signal intensity form of the Tofts model for quantitative analysis of prostate dynamic contrast enhanced MRI data. Phys Med Biol. 2021 Jan 22;66(2):025002.
[7] Quantitative Imaging Biomarkers Alliance (QIBA) - ‘QIBA_v4 Extended Tofts’. https://sites.duke.edu/dblab/qibacontent/.
Figures