1786
Fast quantitative T2 mapping at ultra-high field using sparse sampling and dictionary-based reconstruction1Neurophysics, Max Planck Institute for Human Cognitive and Brain Sciences, Leipzig, Germany, 2International Max Planck Research School on Neuroscience of Communication: Function, Structure and Plasticity, Leipzig, Germany, 3Biomedical Engineering, Tel Aviv University, Tel Aviv, Israel, 4Sagol School of Neuroscience, Tel Aviv University, Tel Aviv, Israel, 5Center for Advanced Imaging Innovation and Research (CAI2R), New York University Langone Medical Center, New York, NY, United States, 6Felix Bloch Institute for Solid State Physics, Leipzig University, Leipzig, Germany
Synopsis
Keywords: Quantitative Imaging, Sparse & Low-Rank Models
Quantitative T2 mapping at ultra high-field via multi-echo spin-echo acquisitions suffers from bias introduced by pronounced transmit field inhomogeneities. Hence, accurate signal modeling is vital. Futhermore, high-resolution imaging results in longer scan times, which need to be compensated by k-space undersampling. Conventional undersampling schemes for multi-echo approaches skip identical phase encoding areas for all echo readouts. Image reconstruction quality might be improved by varying the sampling across echoes and using a low rank reconstruction approach. A multi-echo acquisition combining sparse undersampling with a dictionary modelling method was successfully used to acquire accurate T2 at 7T with a high acceleration.Introduction
Robust and accurate quantification of the relaxation parameters T1, T2* and T2 is vital for studying the microstructural composition of the human brain in vivo1,2. With the development of ultra-high-field (UHF ≥ 7T) MRI it has become possible to obtain relaxation parameter maps at high spatial resolution3. However, inhomogeneity of the (B1+) transmit field is pronounced at UHF4. This is especially a problem for estimating the transverse relaxation time T2, since commonly used multi-echo spin-echo (MESE)5,6 approaches suffer from the formation of stimulated echo pathways when subject to an inhomogeneous B1+and the inherent variation of B1+ across the slice profile. Compensation methods, using either the extended-phase-graph (EPG) formalism7 or Bloch equation simulations8, are needed for robust and reliable estimation of high-resolution T2 maps by accurate signal modeling at UHF9. High spatial resolution requires long scan times, typically compensated by standard parallel imaging techniques like GRAPPA10, where skipping of phase encode lines outside of a central fully sampled auto-calibrated (AC) k-space region is used. The penalty in signal-to-noise ratio (SNR) might be decreased by using more effective k-space undersampling schemes or improved image reconstruction. AC-LORAKS11 reconstruction was shown to efficiently reconstruct random under-sampled k-space data with an AC region. Additionally, LORAKS benefits from exploitation of image information shared between echoes when using joint echo reconstruction12. To obtain accurate high-resolution T2 maps in feasible time, we developed a MESE sequence variant, which combines sparse undersampling with AC-LORAKS reconstruction. The echo signal was modeled by the echo-modulation curve (EMC)8 approach. As quantitative reference, we used a fully sampled SE, and a GRAPPA accelerated standard MESE sequence.Methods
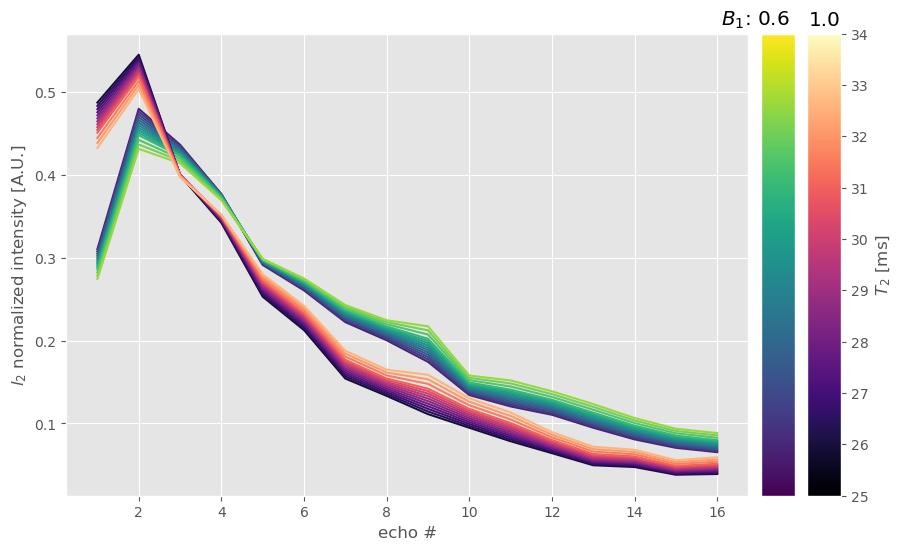
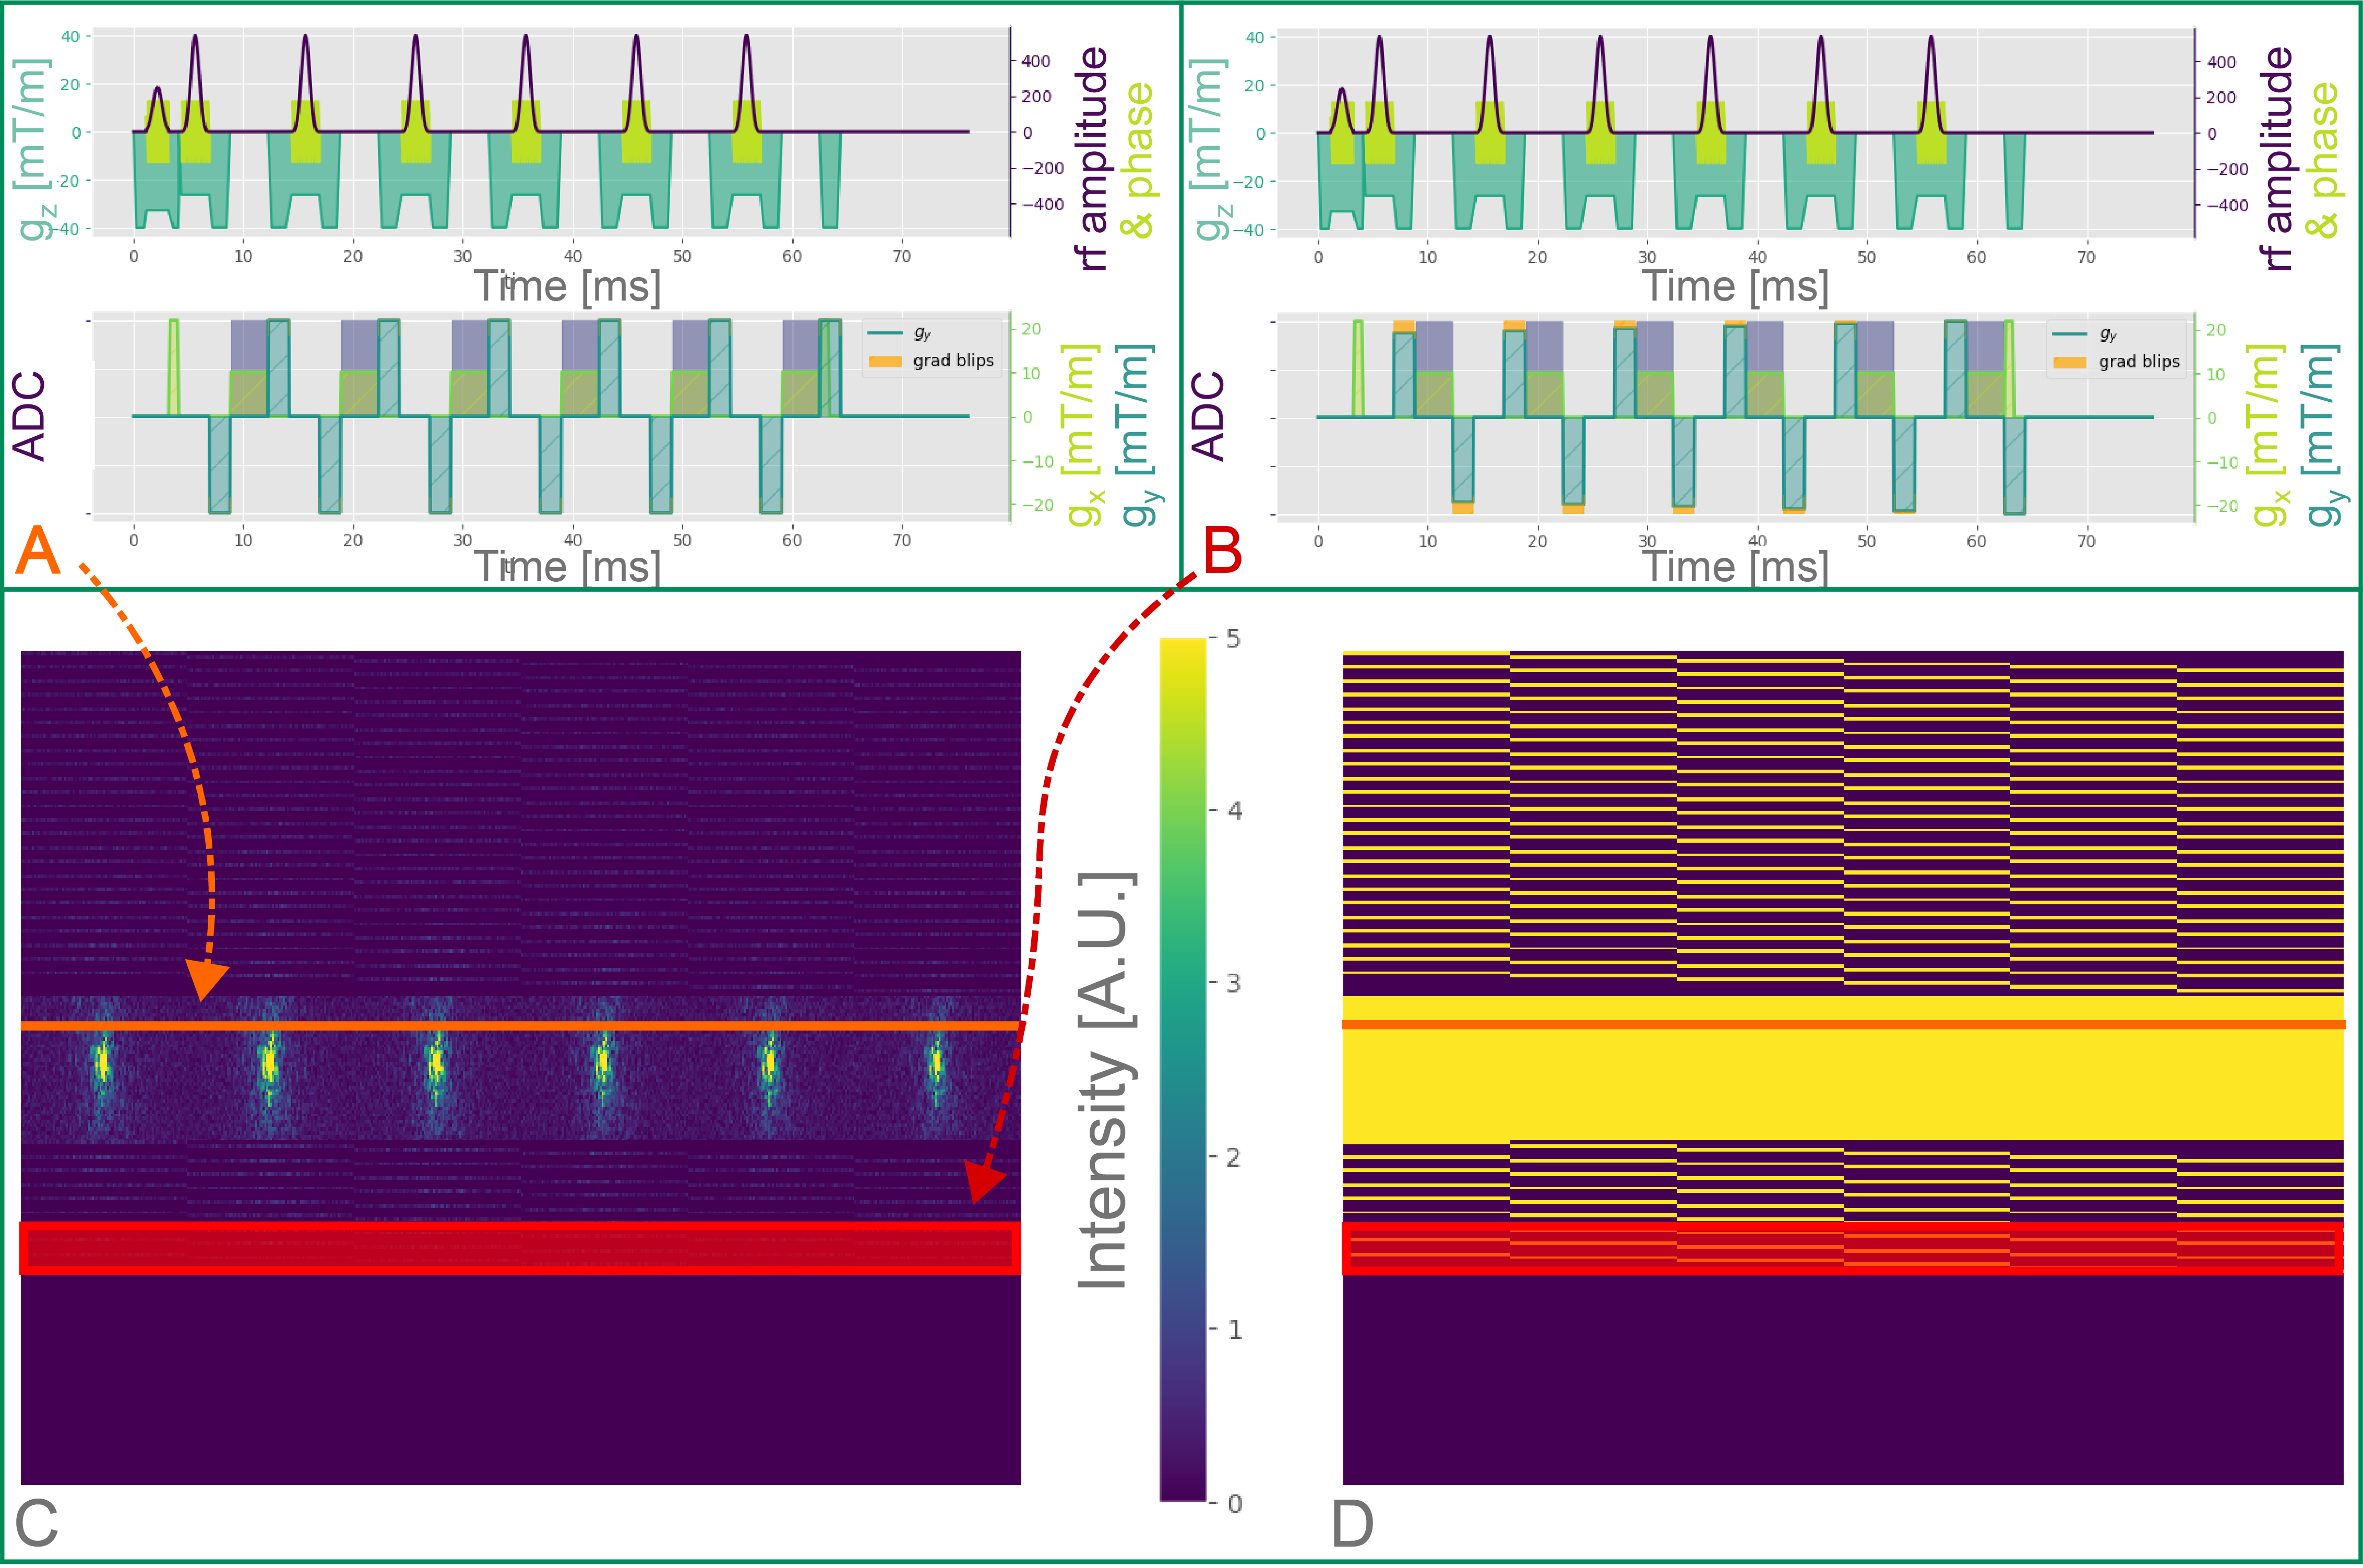
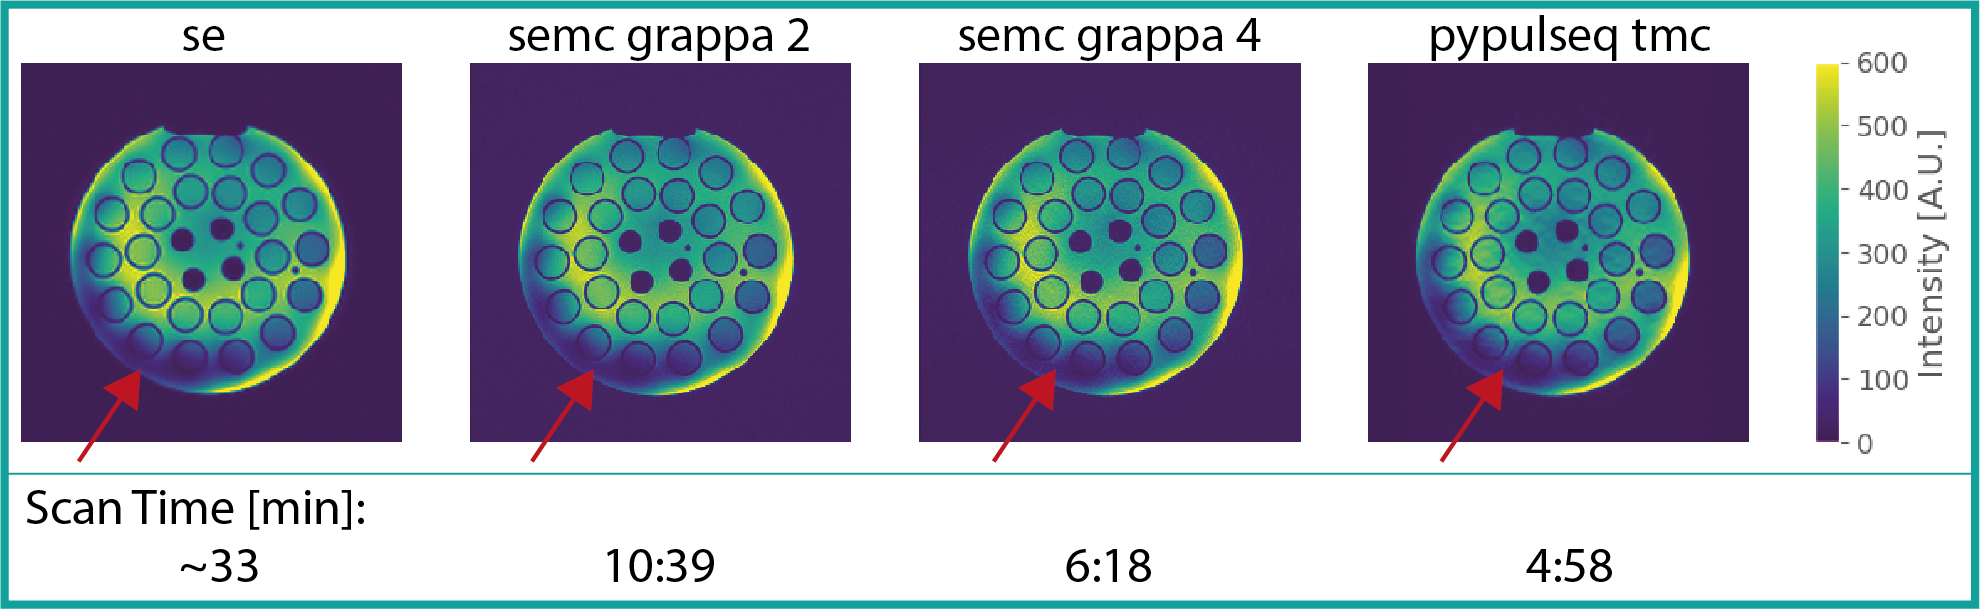
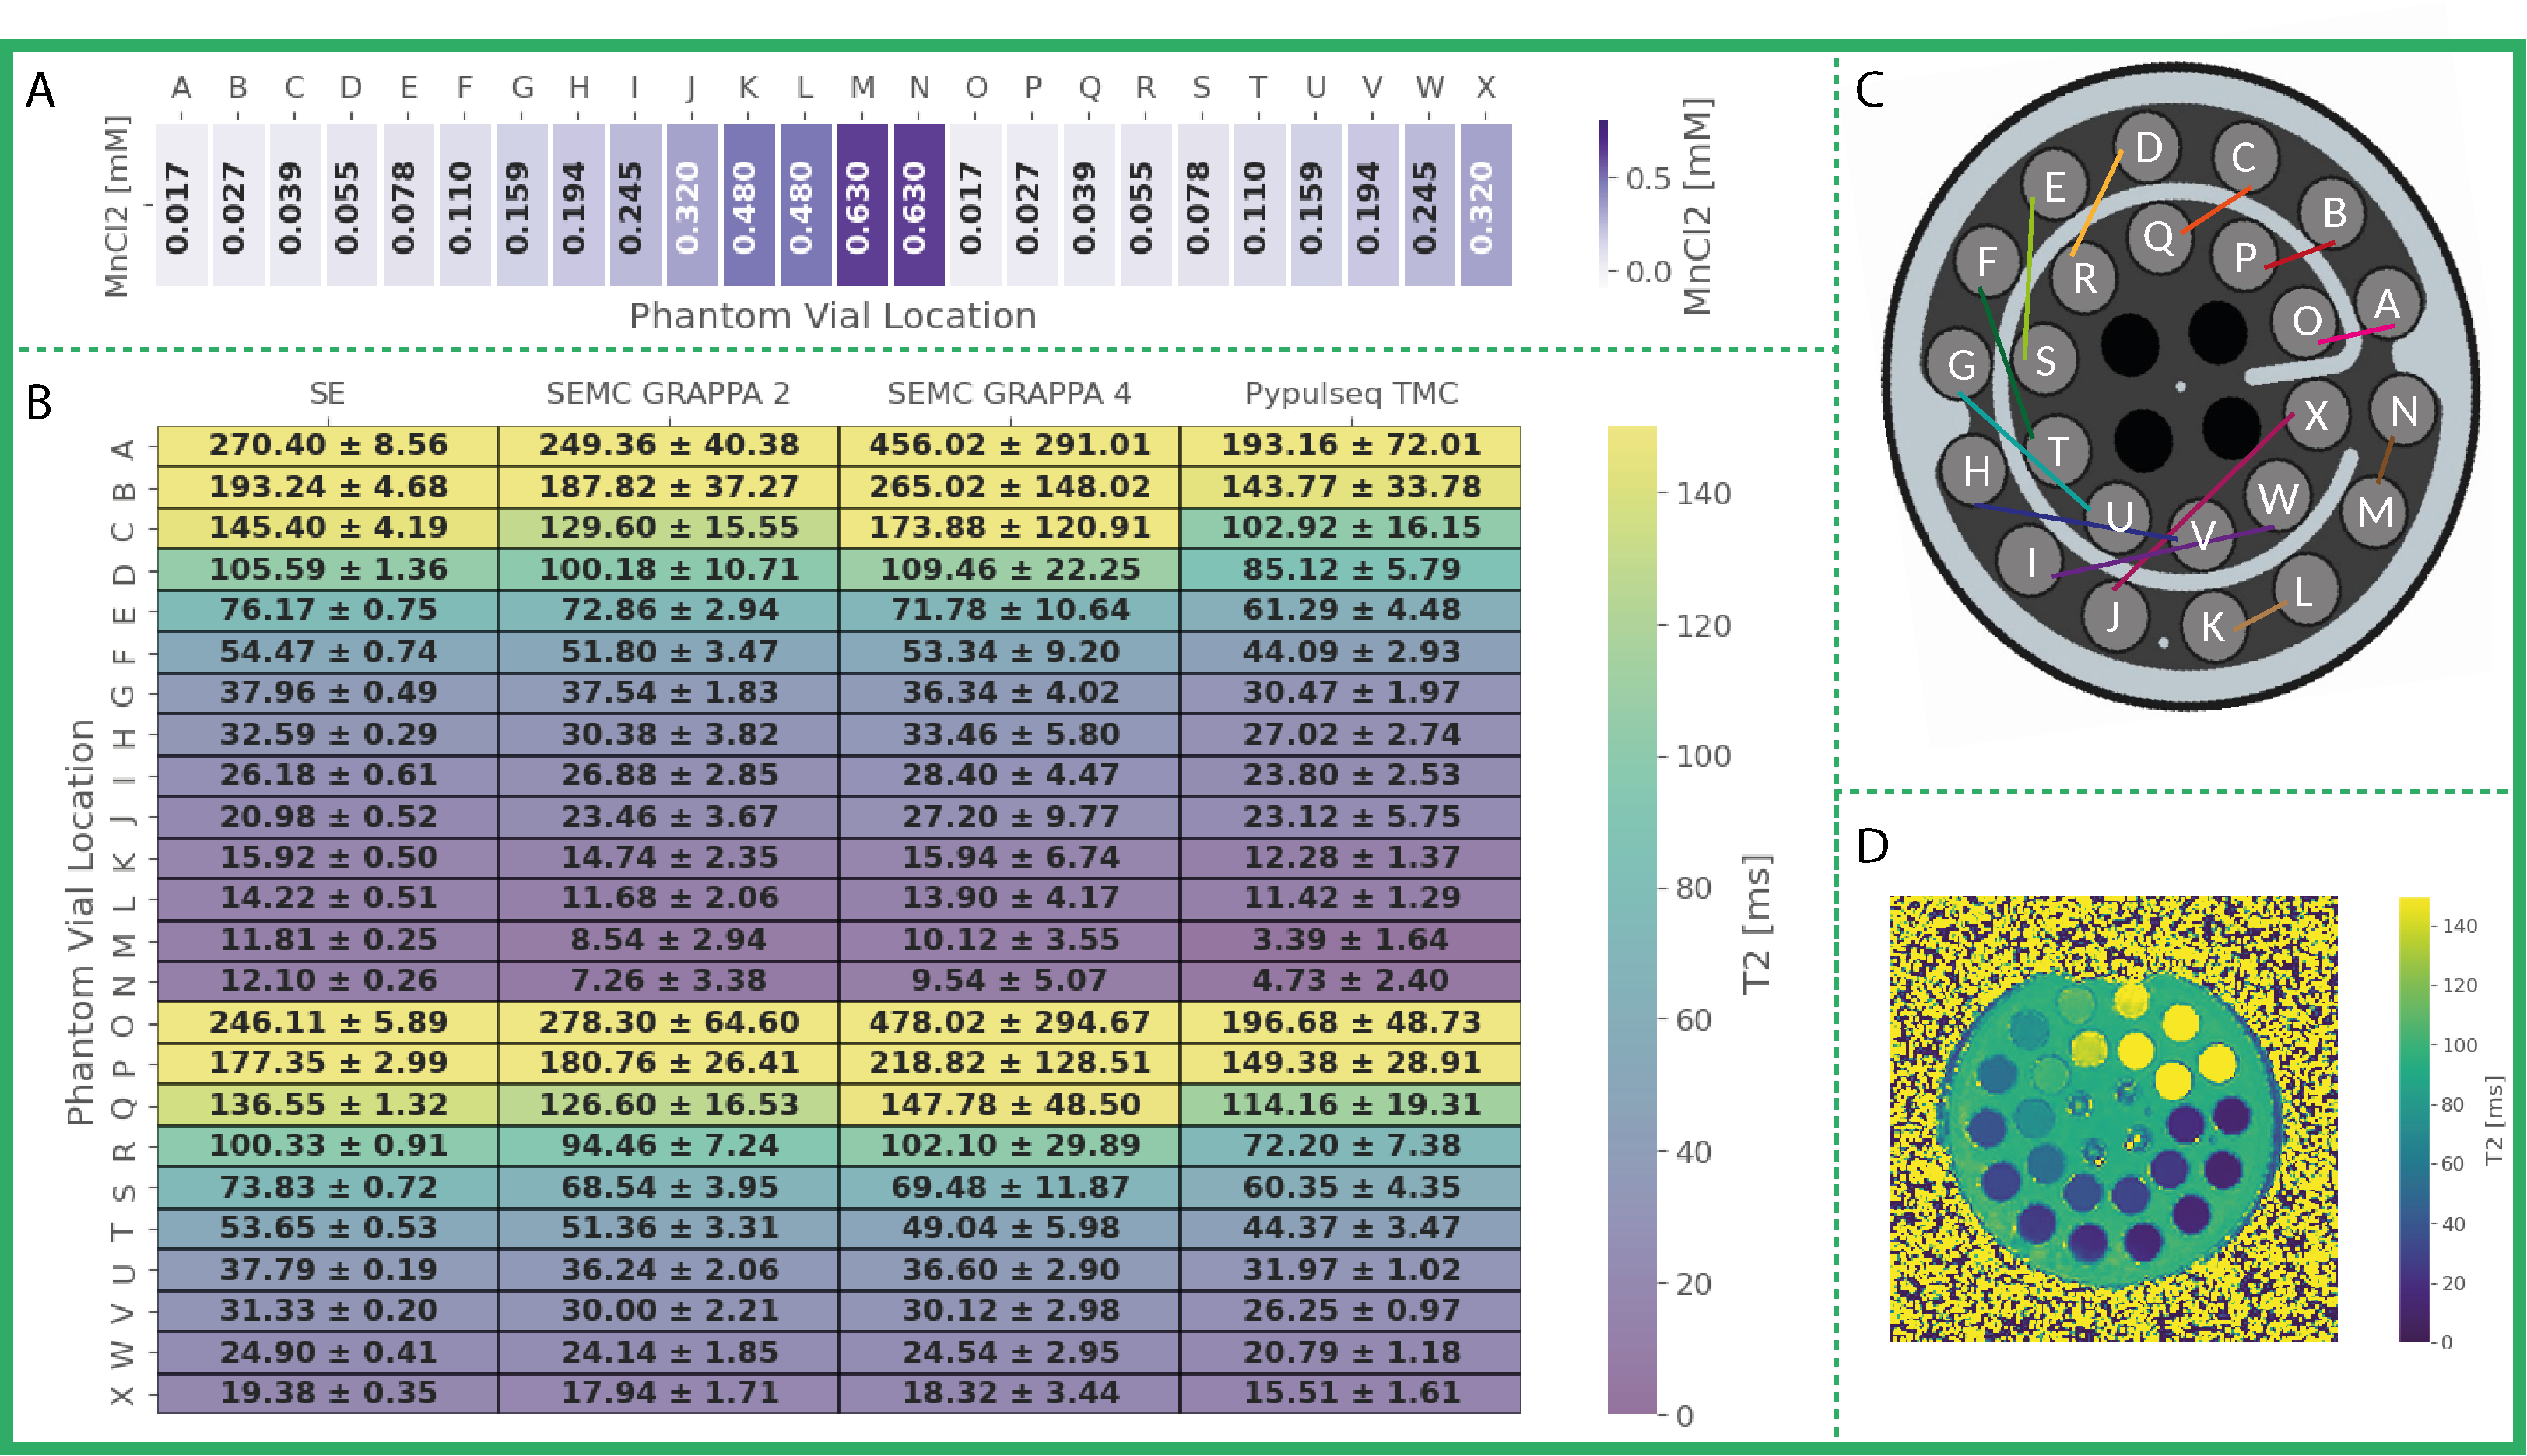
We developed a python package13 for the EMC method. A database, tailored to the exact experimental parameters of each sequence, was simulated for a range of input parameters (Fig. 1). The Siemens product MESE sequence (SEMC) samples identical phase encode lines for all contrasts, when using GRAPPA acceleration. Better conditioning of the reconstruction problem might be achieved by utilizing different k-space regions per contrast and sharing the information across contrasts. We set up a MESE sequence variant (TMC) via pypulseq14,15 to cover a central AC region with 42 lines, identical to the SEMC sequence. However, we employed phase encode steps between successive readouts for k-space lines outside of the AC region (Fig. 2). Measurements were conducted on a Magnetom Terra 7T (Siemens Healthineers, Erlangen, Germany) using an 8Tx/32Rx radio-frequency (RF) head coil (Nova Medical, Wilmington MA, USA). The sequence was tested on a phantom (Gold standard phantoms, Rochester, UK) containing vials with various concentrations of a MnCl2 solution. We used (0.7mm)³ isotropic resolution for all MESE scans and 1.05 x 1.05 x 0.7 mm³ resolution for the SE acquisitions. A TR of 4000ms was used in all scans to avoid T1 saturation effects. We used the following echo times: TE=k*9.4ms for the TMC, TE=k*10ms for the SEMC scans (k=1,2,…,6) and TE=10ms,25ms,50ms for the SE acquisitions. Total scan times were 4:58min for the TMC sequence (acceleration = 4), 6:18min / 10:39min for the SEMC sequence with GRAPPA 4 / 2, respectively, and a total of ~33min for the fully sampled SE scans (Fig. 3). We used standard GRAPPA reconstruction for the datasets acquired with SEMC. The resulting magnitude images exhibit non-central χ noise due to the multi-channel coil combinations and non-linear operations16. Hence, a majorize-minimize algorithm was deployed for denoising17. The TMC acquired data was reconstructed using AC-LORAKS (reconstruction parameters: rank=200, λ=0.0, R=3, Type=C) and noise filtered per channel before combination. A best match of the decay curve per voxel to the respective pre-calculated EMC database was used for all MESE data. SE acquisitions were subjected to noise filtering and a mono-exponential signal fit.Results
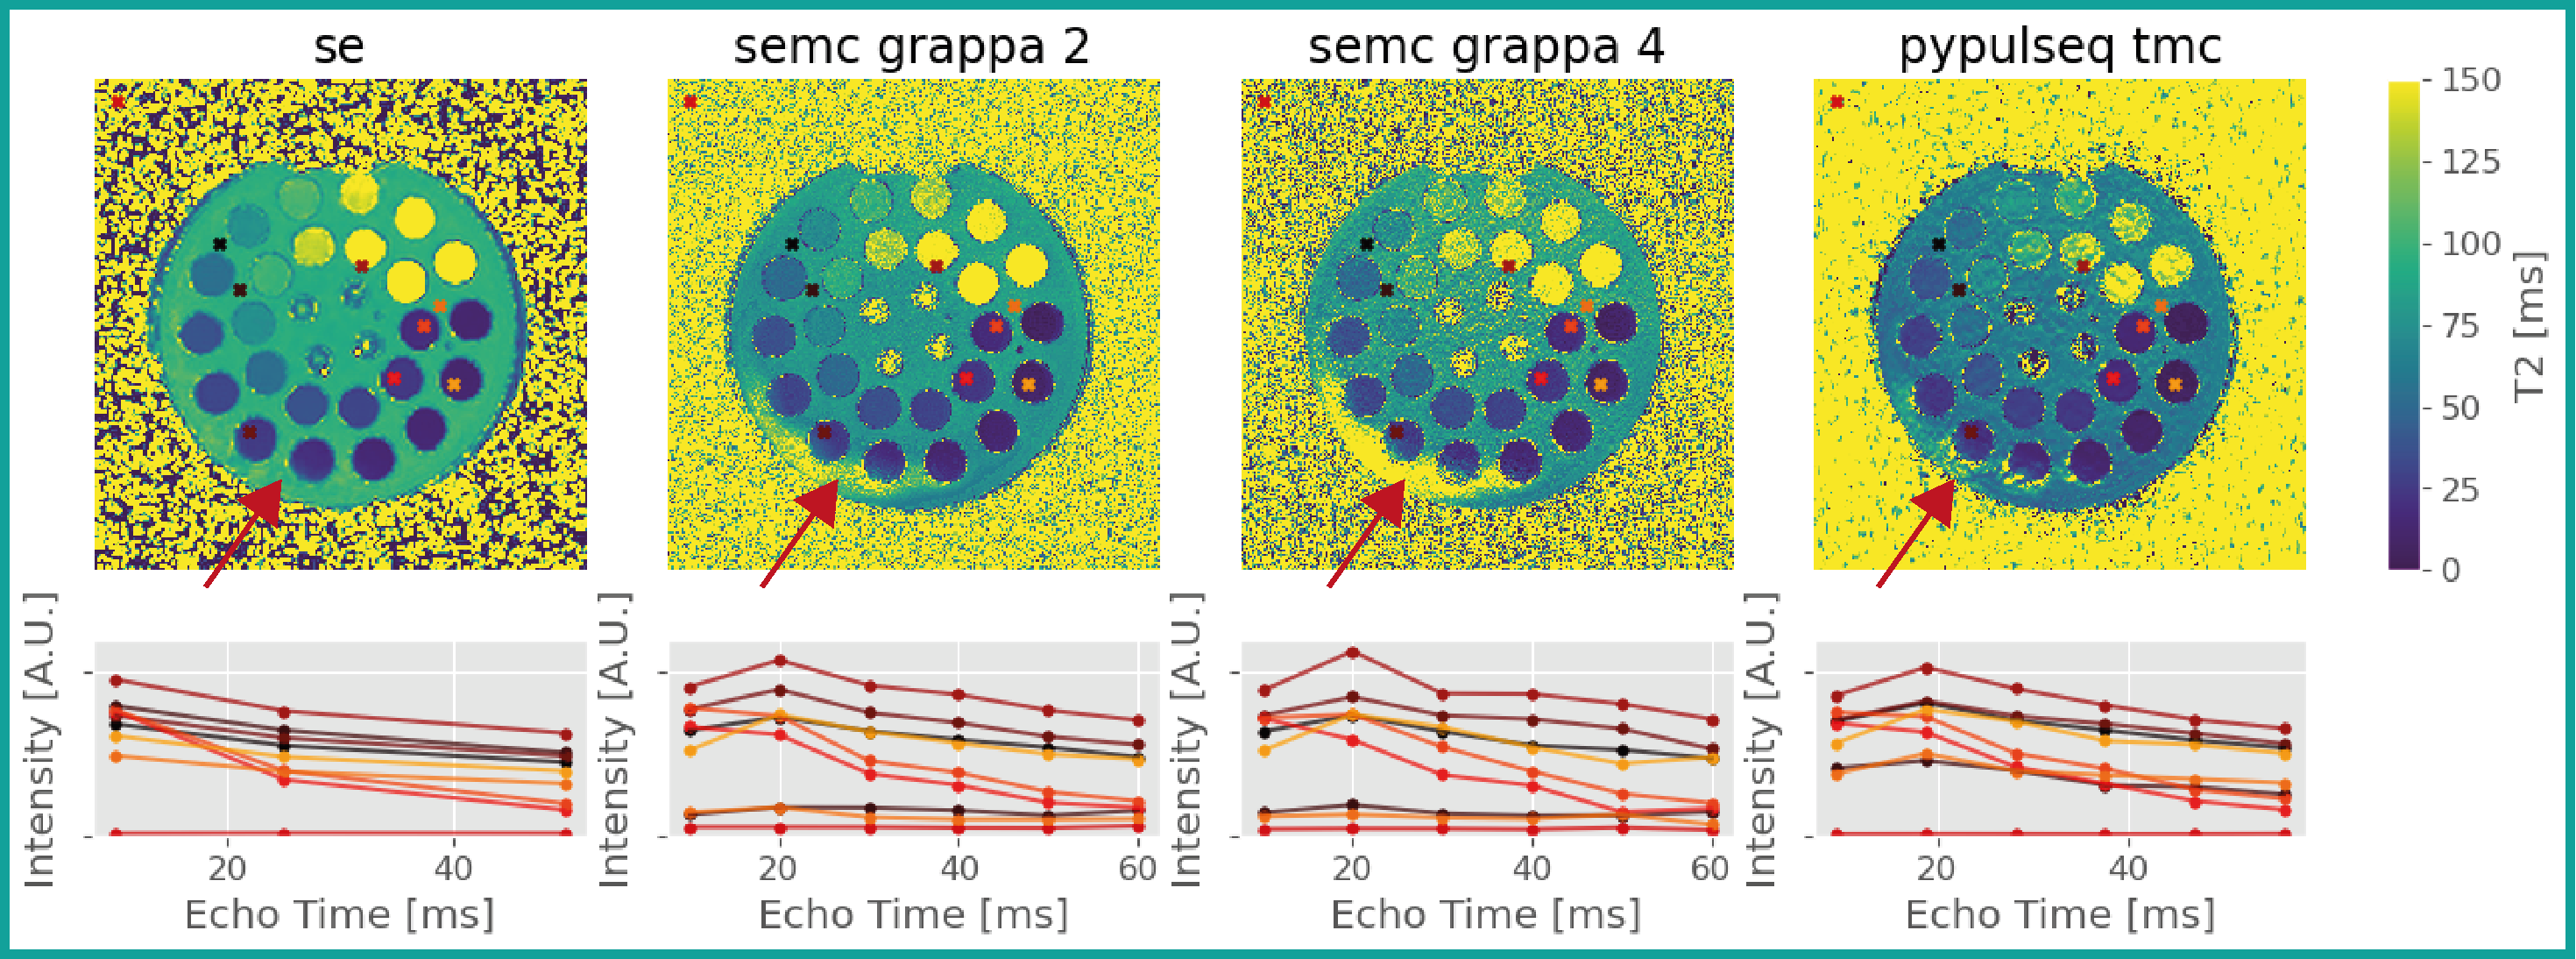
A 6.6-fold reduction in scan time compared to an un-accelerated SE acquisition (with 3 echoes) was achieved using the TMC sequence with AC-LORAKS reconstruction and higher image resolution, while maintaining the overall image data quality (Fig. 3). We achieved similar speed-up (5.2-fold) using the SEMC sequence, but it was less robust to B1+ inhomogeneities (Figs. 3 and 4). T2 maps were obtained after database matching (Fig. 4) and comparable to the SE reference. However, the TMC approach appeared to underestimate T2 somewhat (Fig. 5).Discussion
The estimated T2 showed quantitative comparability to the SE data (Fig. 5). However, MESE acquisitions still suffer from a B1+ bias which is not completely accounted for by EMC database fitting. This behavior is pronounced in regions with low SNR making it dependent on the acceleration factor. Notice the mitigation of B1+ bias effects in the TMC approach compared to the SEMC technique when a similar acceleration was employed. This presumably stems from the more homogeneous k-space coverage and LORAKS reconstruction performance. However, the TMC approach is sensitive to fold-over artifacts when highly undersampling k-space. The reconstruction might be enhanced by further optimizing the k-space sampling pattern.Conclusion
We acquired (0.7mm)³ high-resolution quantitative T2 maps in feasible scan time. The acceleration enabled by the TMC approach might translate to higher coverage for in vivo scans. Future work will include tests in volunteers, randomized sampling in the accelerated TMC phase encoding and implementing pTx pulses for compensating the remaining B1+ bias.Acknowledgements
We like to acknowledge the Institutes MTAs for aiding most of the scan sessions. And also Niklas Wehkamp, from Department of Radiology, University Medical Center Freiburg, Germany and Kerrin Pine, Max Planck Institute for Human Cognitive and Brain Sciences, Leipzig, Germany, for the help with setting up scanning with pulseq.
Nikolaus Weiskopf has received funding from the European Research Council under the European Union's Seventh Framework Programme (FP7/2007-2013) / ERC grant agreement n° 616905; from the European Union's Horizon 2020 research and innovation programme under the grant agreement No 681094; from the Deutsche Forschungsgemeinschaft (DFG, German Research Foundation) – project no. 347592254 (WE 5046/4-2); from the Federal Ministry of Education and Research (BMBF) under support code 01ED2210.
The Max Planck Institute for Human Cognitive and Brain Sciences has an institutional research agreement with Siemens Healthcare. NW holds a patent on acquisition of MRI data during spoiler gradients (US 10,401,453 B2). NW was a speaker at an event organized by Siemens Healthcare and was reimbursed for the travel expenses.
References
1. Weiskopf N, et al. Quantitative magnetic resonance imaging of brain anatomy and in vivo histology. Nature Reviews Physics 2021; 3:570-588
2. Edwards LJ, et al. Microstructural imaging of human neocortex in vivo. NeuroImage 2018; 182:184–206
3. Trampel R, et al. In-Vivo Magnetic Resonance Imaging (MRI) of Laminae in the Human Cortex. NeuroImage 2019; 197: 707-715
4. Vaughan JT, et al. 7T vs. 4T: RF Power, Homogeneity, and Signal-to-Noise Comparison in Head Images. Magn Reson Med 2001; 46: 24-30
5. Carr HY, Purcell EM. Effects of Diffusion on Free Precession in Nuclear Magnetic Resonance Experiments. Phys. Rev. 1954; 94:630–638
6. Meiboom S, Gill D. Modified Spin-Echo Method for Measuring Nuclear Relaxation Times. Rev. Sci. Instrum. 1958; 29:688–691
7. Weigel M. Extended phase graphs: Dephasing, RF pulses, and echoes - pure and simple. J. Magn. Reson. Imaging 2015; 41: 266-295
8. Ben-Eliezer N, et al. Rapid and Accurate T2 Mapping from Multi–Spin-Echo Data Using Bloch-Simulation-Based Reconstruction. Magnetic Resonance in Medicine 2015; 73:809–817
9. Schmidt J, et al. Quantification of transverse relaxation times in vivo at 7T field-strength. Proceedings of the ISMRM & SMRT Annual Meeting & Exhibition 2021; 3049
10. Griswold MA, et al. Generalized Autocalibrating Partially Parallel Acquisitions (GRAPPA). Magnetic Resonance in Medicine 2002; 47:1202–1210
11. Haldar JP. Low-Rank Modeling of Local k-Space Neighborhoods (LORAKS) for Constrained MRI. Trans Med Imaging. 2014; 33(3): 668–681
12. Bilgic B, et al. Improving parallel imaging by jointly reconstructing multi-contrast data. Magnetic Resonance in Medicine 2018; 80:619-632
13. Schmidt J, et al. Python Software Package: https://github.com/schmidtijoe/emc-simulation
14. Layton KJ, et al. Pulseq: A Rapid and Hardware-Independent Pulse Sequence Prototyping Framework. Magnetic Resonance in Medicine 2015; 77:1544–1552
15. Ravi K, et al. PyPulseq: A Python Package for MRI Pulse Sequence Design. Journal of Open Source Software 2019; 4.42: 1725.
16. Dietrich O, et al. Influence of multichannel combination, parallel imaging and other reconstruction techniques on MRI noise characteristics. Magnetic Resonance Imaging 2008; 26:754 – 762
17. Varadarajan D, et al. A Majorize-Minimize Framework for Rician and Non-Central Chi MR Images. IEEE Trans Med imaging 2015; 34:2191-202
Figures