1785
Feasibility of pulse wave velocity measurement in pulmonary arteries from phase-resolved functional lung MRI
Marius Malte Wernz1,2, Andreas Voskrebenzev1,2, Robin Müller1,2, Maximilian Zubke1,2, Filip Klimeš1,2, Gesa Pöhler1,2, Frank Wacker1,2, and Jens Vogel-Claussen1,2
1Institute of Diagnostic and Interventional Radiology, Hannover Medical School, Hannover, Germany, 2Biomedical Research in Endstage and Obstructive Lung Disease Hannover (BREATH), German Center for Lung Research (DZL), Hannover, Germany
1Institute of Diagnostic and Interventional Radiology, Hannover Medical School, Hannover, Germany, 2Biomedical Research in Endstage and Obstructive Lung Disease Hannover (BREATH), German Center for Lung Research (DZL), Hannover, Germany
Synopsis
Keywords: Quantitative Imaging, Velocity & Flow
Phase-resolved functional lung (PREFUL) MRI-derived flow cycles are used to calculate time differences in blood flow and thus mean velocity between the truncus pulmonalis and voxels located in main pulmonary arteries. Two U-Net-based convolutional neural networks are used to identify voxels to include in the analysis. In 26 patients with chronic obstructive pulmonary disease (COPD) the resulting pulmonary artery pulse wave velocity (paPWV) values are reproducible after two weeks. The measured velocities in COPD patients and in 30 healthy subjects are in a physiologically plausible range compared to invasive measurements.Introduction
Lung diseases such as chronic obstructive pulmonary disease (COPD) and pulmonary hypertension have been linked to pulmonary arterial stiffness and elevated pulse wave velocity within the pulmonary arteries (paPWV)1. The gold standard of measuring PWV is via the use of flow meters or catheter-based pressure probes2. In addition to right heart catheterization, there are non-invasive techniques to measure pulse wave transit time and/or velocity such as echocardiography or MRI-based techniques like multi-slice 2D or 4D phase-contrast MRI. Arterio-venous pulmonary pulse wave transit time (pPTTav) derived from phase-resolved functional lung (PREFUL)3 MRI has recently been shown to correspond well with echocardiography4. However, changes in pPTTav cannot be differentiated into being of arterial, capillary or venous origin. Thus, we propose an automated workflow to investigate pulse wave travel within the arterial branches of pulmonary vasculature by paPWV.Methods
For 26 patients with COPD (9 females, age range: 45-78) and 30 healthy volunteers (14 females, age range: 21-68) 200 2D coronal GRE FLASH images with temporal resolution of 3-5 images per second were acquired at 1.5T (TR: 3ms, TE: 0.8ms, slice thickness: 15mm). The dynamic images were sorted and filtered to reconstruct a whole cardiac cycle for each study participant3. Each flow cycle consists of 15 phases, such that the apparent temporal resolution reaches – depending on the subject’s heart rate – 50 to 70ms.To identify voxels included in the paPWV analysis, two U-Nets5 have been trained to segment (1) the truncus pulmonalis (TP) or proximal right or left main pulmonary artery depending on the anatomical depiction on the most suitable central coronal slice at the level of the tracheal bifurcation, and (2) the central pulmonary vasculature (figure 1).
The dynamic flow signal of each voxel in the central pulmonary vasculature was compared to the TP to find the temporal difference (Δt) in the dynamic flow caused by the travel of the pulse wave through the vasculature. Δt was defined as suggested by Wentland et al.3 by using cross-correlation of the two signals. The peak in the cross-correlation curve indicates the temporal shift of the two signals (figure 2). Additionally, a minimum cross-correlation of 0.8 was defined to exclude voxels with irregular flow cycle shape. In order to include central pulmonary arteries only, voxels with Δt>100ms were discarded (figure 1). Dividing the Euclidian distance of the respective voxel to the TP by Δt yielded the velocity between these two points.
The subjects’ heart rates and the median of all measured velocities (paPWV) were reported for the COPD cohort at baseline and follow-up scan after two weeks (CLAIM study5) as well as for the healthy group for two immediate consecutive scans. Reproducibility was assessed using Bland-Altman analysis, intraclass-correlation-coefficient (ICC), minimum detectable effect size (MDES) and coefficient of variation (COV). Mann-Whitney-U test was used to determine differences between the COPD cohort and the healthy group.
Results
Median (IQR) paPWV for both groups as well as the reproducibility metrics are shown in figure 3, Bland-Altman analysis is shown in figure 4. In median, 687 arterial voxels (IQR: 346) were analyzed per patients with a median distance to the TP of 101mm (IQR: 11.6mm) and median Δt of 44ms (IQR: 16.7ms).The heart rate of the COPD group was not significantly different between both scans (p = 0.21, median measurement 1: 65bpm (IQR: 11bpm), median measurement 2: 68bpm (IQR: 16bpm)) but significantly lower for the healthy group during the second scan (p < 0.001, median measurement 1: 77bpm (IQR: 13bpm), median measurement 2: 71bpm (IQR: 11bpm)). Healthy subjects showed no significantly different paPWV than COPD patients, however significant (p=0.007) differences were observed between their first and second scan.
Discussion
The PREFUL sorting algorithm enables the measurement of velocities in the range of those within the pulmonary arterial system. Previously, paPWV was measured by right heart catheterization; a median velocity of 3.4 m/s was reported for healthy controls6. Our reported values are slightly lower compared to the literature values, which may be due to an underestimation of the true distance between the central and peripheral measurement caused by the Euclidian distance calculation.For the COPD group, ICC, COV and MDES as well as the Bland-Altman analysis indicate reproducibility of paPWV after two weeks. The poor repeatability and the significant differences in paPWV within the two consecutive scans of the healthy group are likely due to the significantly lower heart rate and possibly accompanied lower pulmonary arterial blood pressure. The reduction of heart rate after the first scan is likely caused by the subjects’ inactivity/relaxation during the first scan.
The main limitations of the described methods are inaccuracies in the distance calculation from both selecting the starting point in the main pulmonary arteries as well as the Euclidian distance calculation to the peripheral regions. Furthermore, the temporal resolution of the flow cycle may be too low to ensure correct measurement in patients with increased paPWV.
Conclusions
The calculation of pulse wave velocity in pulmonary arteries by PREFUL MRI is feasible. Studies to validate the proposed method and to determine correlation to established methods are necessary in order to confirm our findings.Acknowledgements
No acknowledgement found.References
1: Blanco, I et al. Pulmonary vasculature in COPD: The silent component. Respirology. 20162: Wentland AL et al. Review of MRI-based measurements of pulse wave velocity: a biomarker of arterial stiffness. Cardiovasc Diagn Ther. 2014
2: Voskrebenzev A et al. Feasibility of quantitative regional ventilation and perfusion mapping with phase-resolved functional lung (PREFUL) MRI in healthy volunteers and COPD, CTEPH, and CF patients. Magn Reson Med. 2018
3: Pöhler GH et al. Validation of Phase-Resolved Functional Lung (PREFUL) Magnetic Resonance Imaging Pulse Wave Transit Time Compared to Echocardiography in Chronic Obstructive Pulmonary Disease. J Magn Reson Imaging. 2021
4: Ronneberger O et al. U-net: Convolutional networks for biomedical image segmentation. International Conference on Medical image computing and computer-assisted intervention. 2015
5: Hohlfeld J et al. Effect of lung deflation with indacaterol plus glycopyrronium on ventricular filling in patients with hyperinflation and COPD (CLAIM): a double-blind, randomised, crossover, placebo-controlled, single-centre trial. Lancet Respir Med. 2018
6: Kopeć G et al. Pulmonary artery pulse wave velocity in idiopathic pulmonary arterial hypertension. Can J Cardiol. 2013
Figures
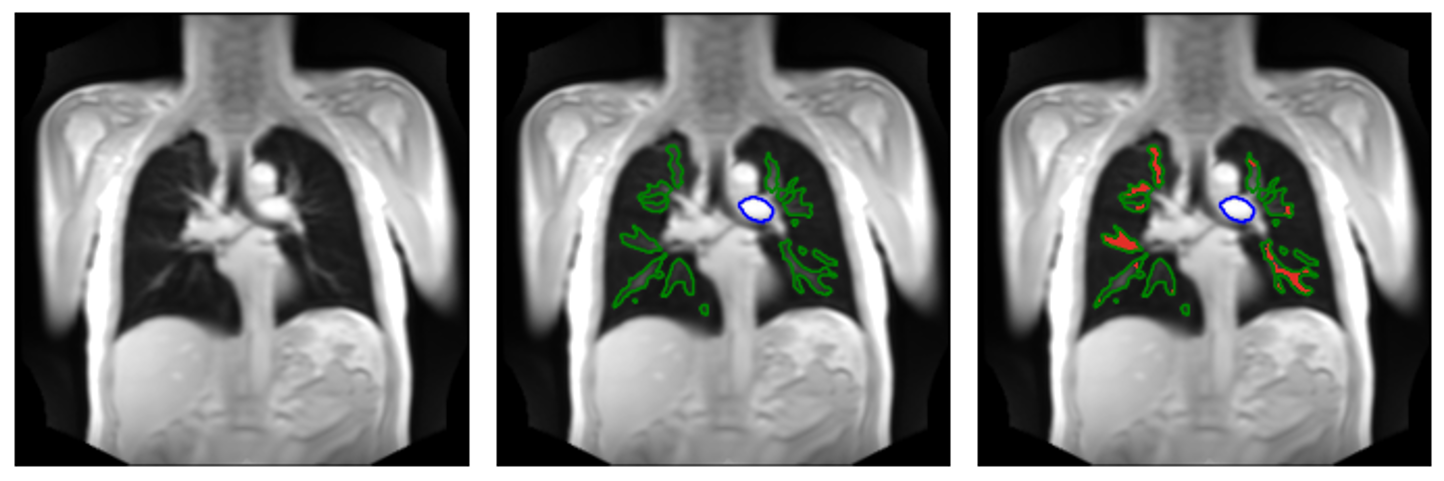
Figure 1: Left: Morphologic image; Middle: U-Net segmented regions in main pulmonary artery (blue) and central pulmonary vasculature (green); Right: Arterial voxels (red) included in the paPWV analysis after excluding voxels as described.
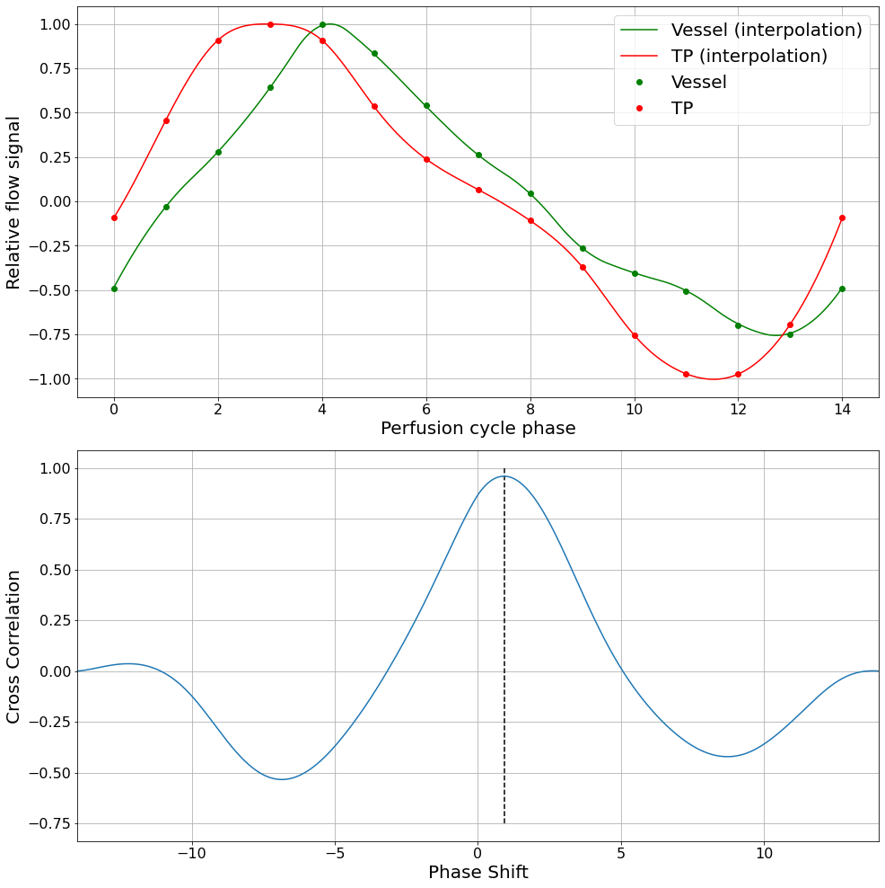
Figure 2: Top: Comparison of the flow cycle within the Truncus Pulmonalis (TP, red) and a voxel within the pulmonary vasculature. Bottom: Cross-correlation of the two signals. The dashed line indicates the calculation of the time difference Δt.
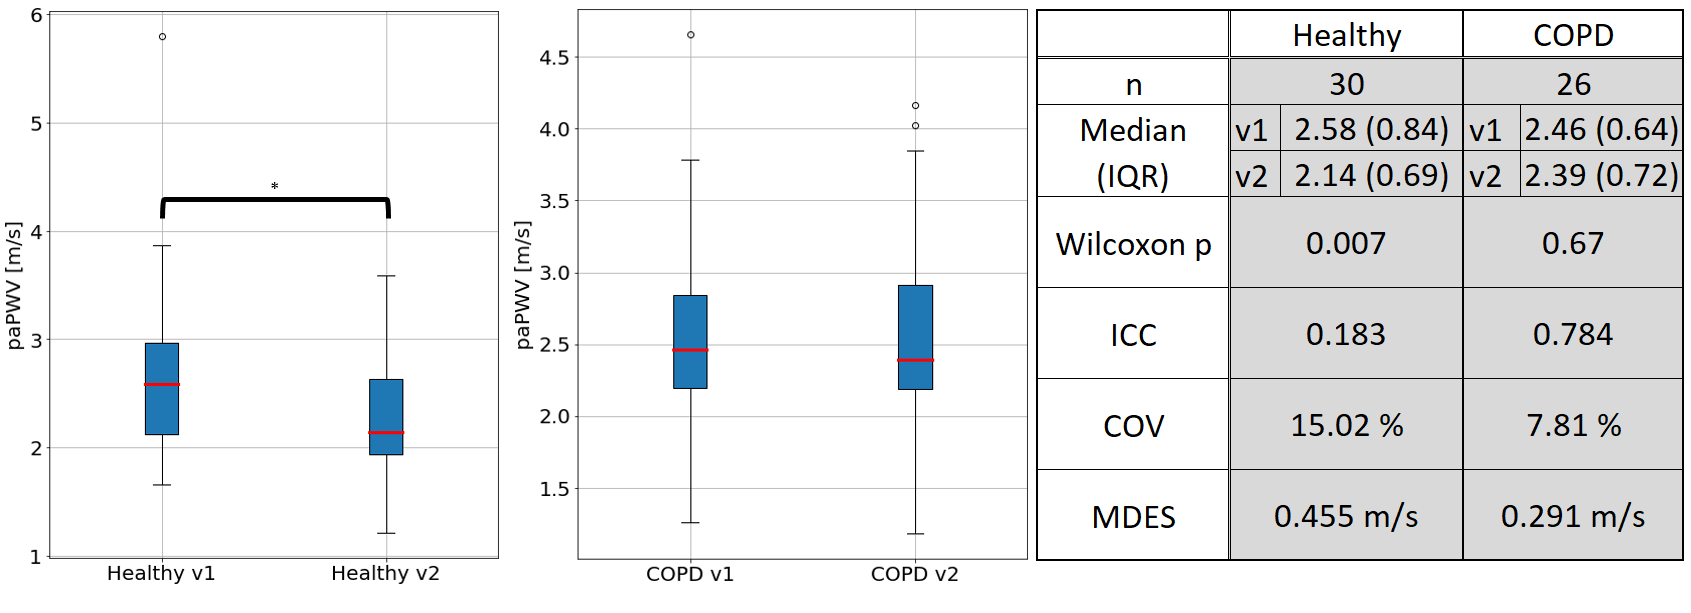
Figure 3: Left: Pulmonary artery pulse wave velocity values (paPWV) [m/s] for the healthy group and the chronic obstructive pulmonary disease (COPD) patients at first (v1) and second scan (v2), asterisk indicates significant differences (p < 0.05). Right: Median paPWV values [m/s] and Intraclass correlation coefficient (ICC), Coefficient of variation (COV) and Minimum detectable effect size (MDES)
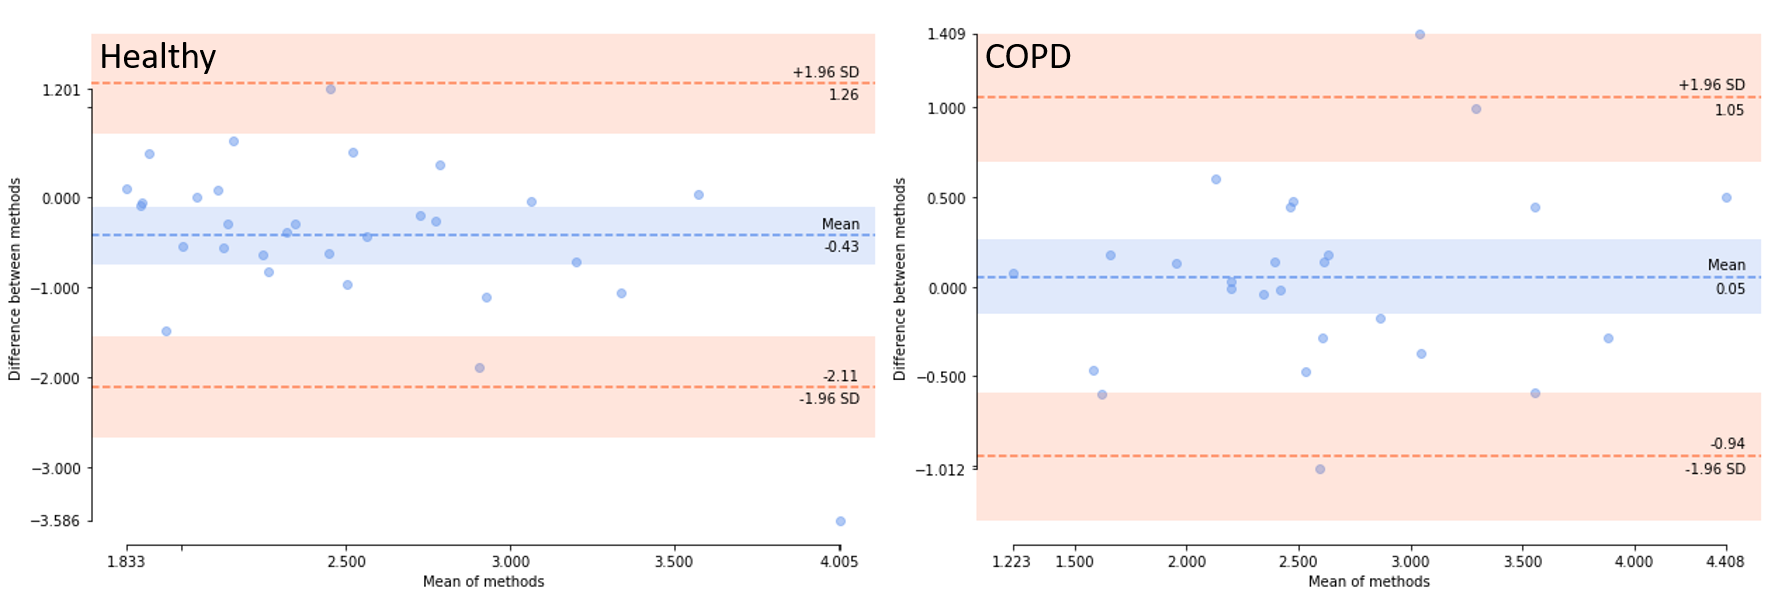
Figure 4: Bland-Altman comparison of pulmonary artery pulse wave velocity (paPWV) [m/s] at baseline and follow-up scan of the healthy group (left) and the COPD group (right).
DOI: https://doi.org/10.58530/2023/1785