1783
Feasibility of T1/T2/T1ρ MR Multitasking of Arm Muscle for Imaging Amyotrophic Lateral Sclerosis1Biomedical Imaging Research Institute, Cedaras Sinai Medical Center, Los Angeles, CA, United States, 2Neurology, Cedars-Sinai Medical Center, Los Angeles, CA, United States
Synopsis
Keywords: Quantitative Imaging, Neurodegeneration, MR Multitasking, Amyotrophic Lateral Sclerosis
Amyotrophic Lateral Sclerosis (ALS) is a neurodegenerative motor disorder that has a need for imaging methods for longitudinal studies. T1/T2/T1ρ MR multitasking is a multiparametric, quantitative, imaging method that shows promise in being a viable tool for this purpose. In this study, we tested the feasibility of a motion weighting modified T1/T2/T1ρ MR multitasking in the arm muscles, evaluating the accuracy and precision of quantitative measurements.Introduction
Amyotrophic lateral sclerosis (ALS) is a neurodegenerative motor disorder characterized by the dysfunction of both upper and lower motor neurons[1, 2]. There is a need for imaging methods to monitor experimental ALS treatments as well as to elucidate the nature of ALS progression[1, 3]. Muscle MRI is sensitive to changes in neuromuscular degenerative diseases[4-6], revealing T1 hyperintensities, T1ρ-mapping changes in muscle, and diffuse T2-weighted changes[7, 8]. Quantitative muscle tissue data obtained during diagnosis and treatment are better suited to longitudinal monitoring than weighted imaging[9, 10]. However, multiparametric quantitative mapping suffers from long scan times and registration issues due to motion, which present challenges for their use[11]. The multiparametric mapping framework MR Multitasking has shown promise in these areas[12, 13] and has already been used to study T1/T2/T1ρ values in the brain[12], making it a good candidate for use in ALS studies. Many imaging studies of neuromuscular disorders are done in the legs, but this study was done in the arms to evaluate new muscle groups. This study proposes to evaluate the viability of MR Multitasking in ALS patients by testing the sequence feasibility in n=5 healthy subjects.Methods
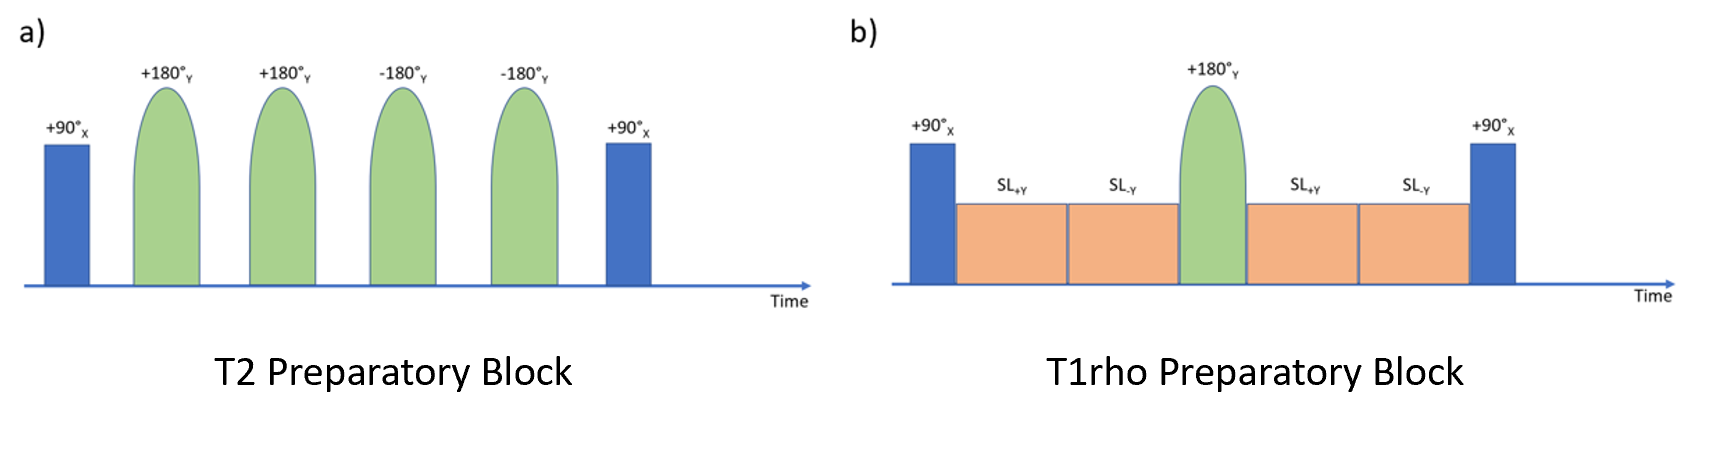
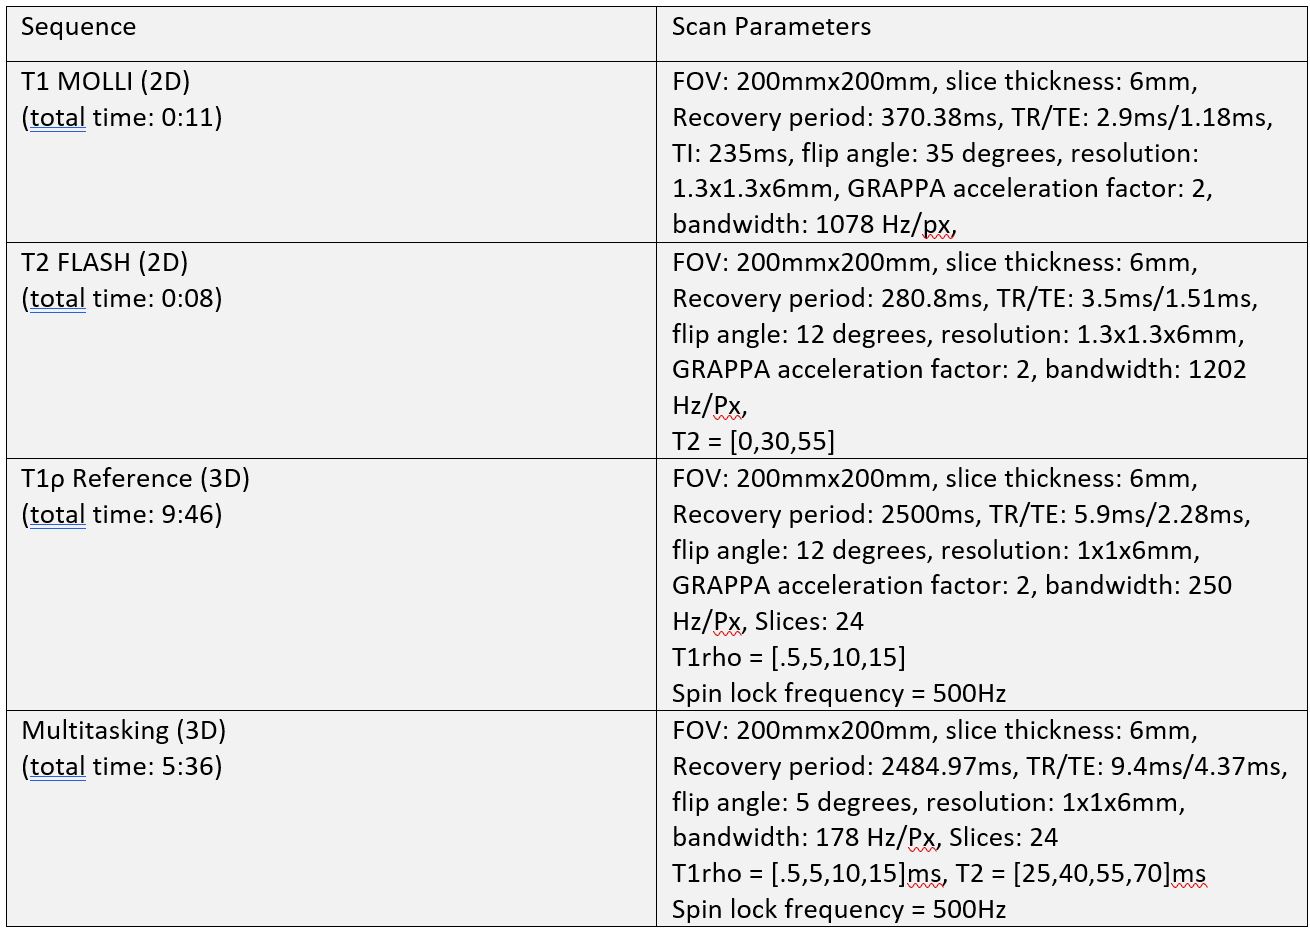
Image AcquisitionAll data were acquired on a 3T Siemens Biograph mMR scanner in n=5 healthy volunteers. The scan protocol consisted of the Multitasking sequence and its associated reference sequences. A MOLLI 5(3)3 sequence was used as the T1 reference, a T2-prep FLASH was used as the T2 reference, and a T1ρ-prepared FLASH sequence was used as the T1ρ reference. The MR Multitasking sequence used a pulse sequence configuration of four T2 preparatory blocks with four refocusing pulses and four T1ρ preparatory blocks with one refocusing pulse (Figure 1). After a preparatory block is finished, it is followed by a series of 3D FLASH[14] readouts with 5° excitation pulses to measure the resulting magnetization throughout the entire recovery period[12, 15]. The sequence parameters are shown in Figure 2.
Image Reconstruction
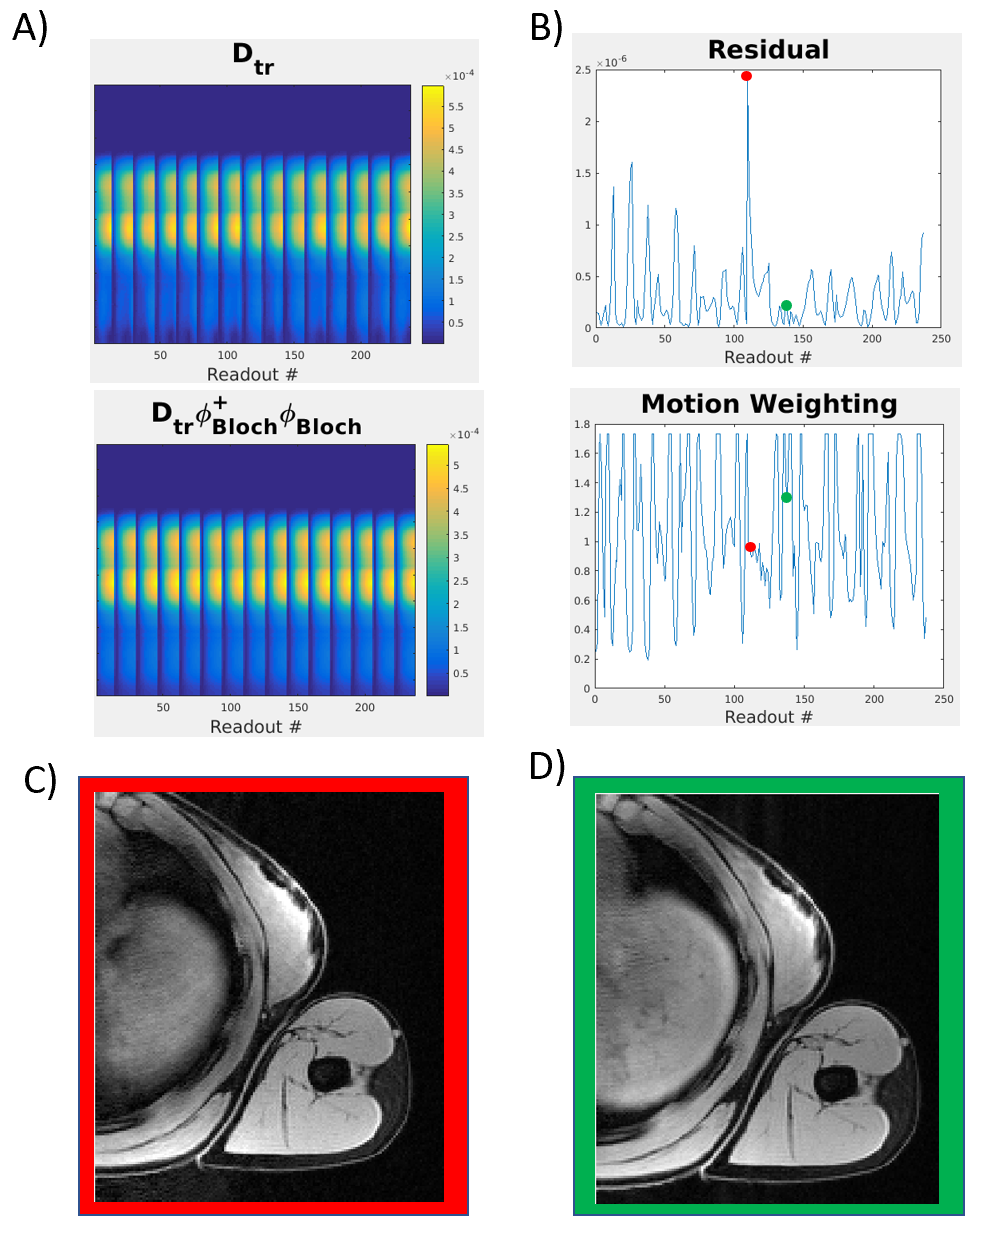
This study modified the standard MR Multitasking approach to image reconstruction[12, 13, 15], reducing the influence of motion-corrupted k-space lines via a weighting matrix reflecting the model error between acquired data and a motion-free physics model (Figure 3). Specifically, we first calculated the residual R between the auxiliary training data, Dtr, and its projection onto a Bloch dictionary–derived temporal basis, :
$$R=D_{tr}-D_{tr}\phi_{Bloch}^{+}\phi_{Bloch}$$
Because models contrast weighting changes but not motion, R is presumed to contain thermal noise and motion corruption. A diagonal weighting matrix is formed from R,
$$W_{jj}=(\sum_{i=1}^{N_{x}N_{c}}\left|{R_{ij}}\right|^{2})^{-1/2}$$
which is then normalized by the median weighting at each inversion time and incorporated into the tensor subspace estimation step[15] to reduce the weight of motion-corrupted data.
Data Analysis
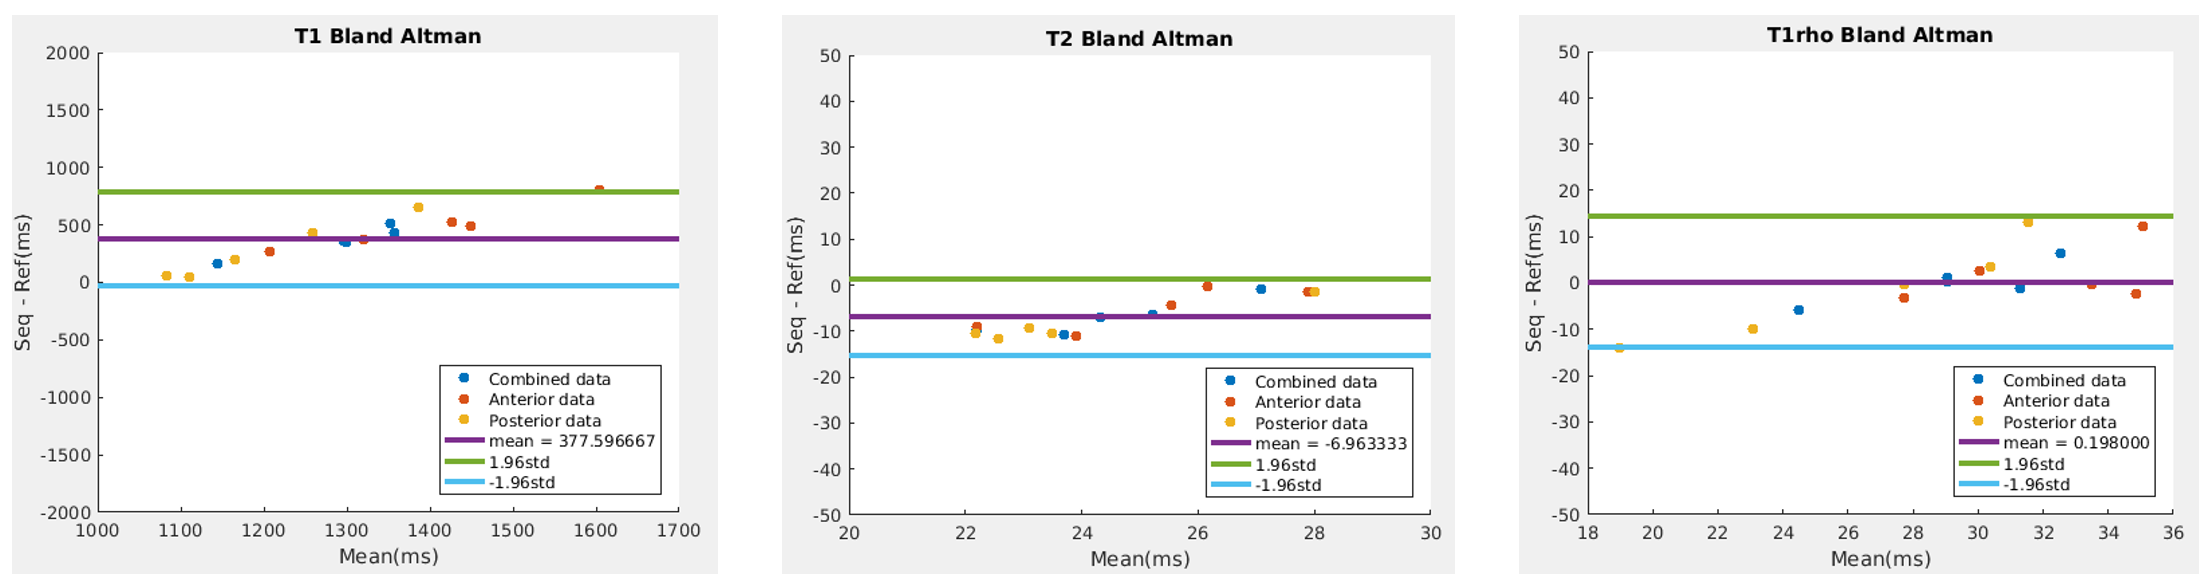
Fitted T1/T2/T1ρ maps were analyzed by calculating the mean value within an ROI of size 10x10 voxels taken from both the anterior and posterior of the arm and averaged together to create an average across the entire muscle tissue. The same calculations were done on the reference maps. The Multitasking and reference sequences were compared by way of Bland-Altman plots. Bias between mapping methods was determined by paired t-tests, regarding p<0.05 as significant.
Results
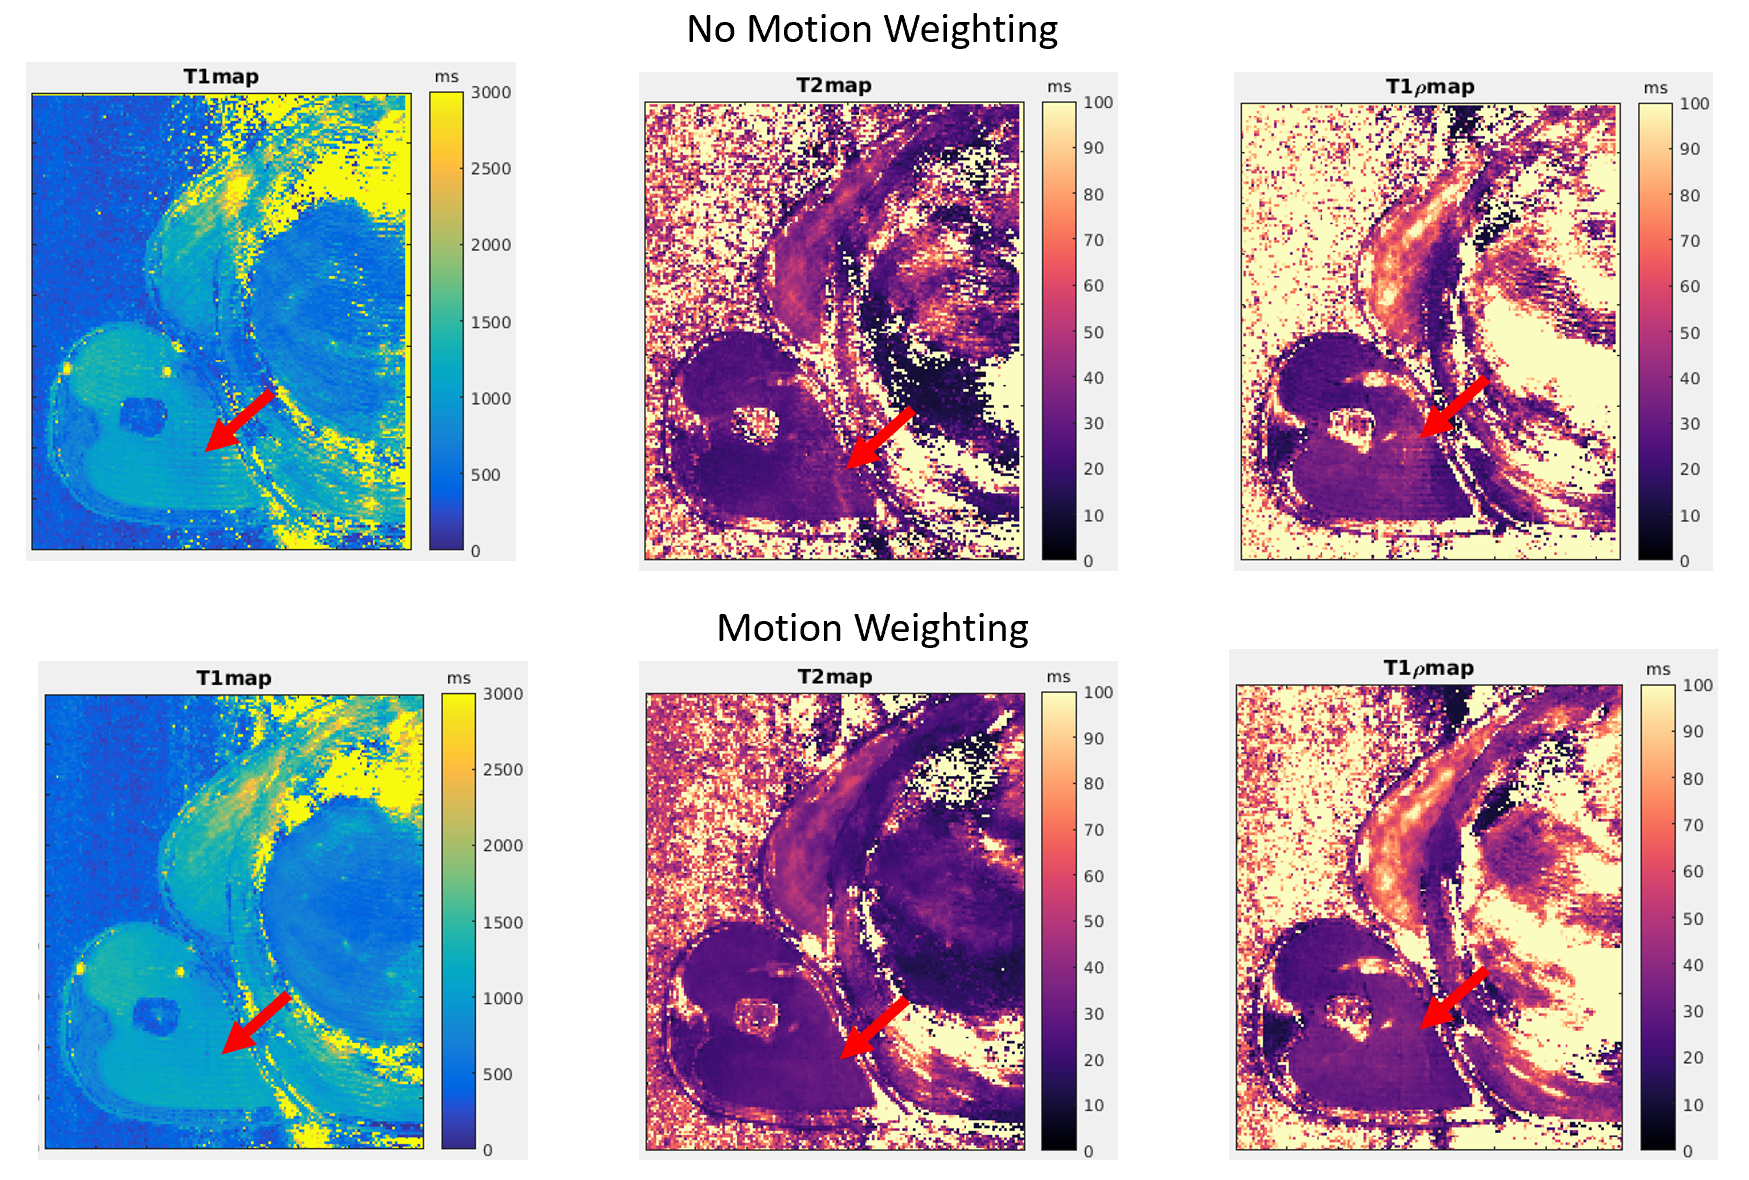
Figure 4 shows the impact of the weighting matrix to reduce motion artifacts in one volunteer. Bland-Altman plots showed a mean difference of +378ms (p<0.001) between the Multitasking T1 sequence values and the T1 reference, -7.0ms (p<0.001) for the T2 values and T2 reference and +0.2ms (p=0.88) for the T1ρ values and T1ρ reference (Figure 5).Discussion
MR Multitasking values showed an overestimation of T1 values, an underestimation of T2 values, and similar estimation of T1ρ values compared to the reference sequences. T1 overestimation is expected versus T1 MOLLI, which is known to underestimate T1. T2 underestimation is consistent with previous Multitasking studies[16, 17] compared to the T2-prep FLASH reference. T1 accuracy and precision are known to improve with B1+ mapping[18]; T1ρ precision may also increase with improved homogeneity of the T1ρ preparation effects, which currently use only a single refocusing pulses. Performance may therefore improve with the addition of B1+ mapping and additional refocusing pulses[19]. The MR Multitasking sequence also showed a marked improvement in scan time (5:36) compared to that of the T1ρ reference sequence (9:46) which was in line with other quantitative T1ρ and T2 sequences[11].Conclusion
MR Multitasking is feasible for imaging arm muscle and may find a role in the study of ALS. The proposed method showed slightly biased T1/T2 estimation and resembled T1ρ measurements compared to the reference method while maintaining the fast-imaging time benefit of MR Multitasking. In future work, B1+ mapping and more T1ρ preparatory refocusing pulses could be added to help deal with homogeneity issues affecting estimation of values.Acknowledgements
This work was partially supported by NIH R01 EB028146.References
1. van den Bos M. A. J., Geevasinga N., Higashihara M., Menon P., Vucic S. Pathophysiology and Diagnosis of ALS: Insights from Advances in Neurophysiological Techniques, Int J Mol Sci 2019: 20.
2. Zarei S., Carr K., Reiley L., Diaz K., Guerra O., Altamirano P. F. et al. A comprehensive review of amyotrophic lateral sclerosis, Surg Neurol Int 2015: 6: 171.
3. Geevasinga N., Menon P., Ozdinler P. H., Kiernan M. C., Vucic S. Pathophysiological and diagnostic implications of cortical dysfunction in ALS, Nat Rev Neurol 2016: 12: 651-661.
4. Morrow J. M., Sinclair C. D. J., Fischmann A., Machado P. M., Reilly M. M., Yousry T. A. et al. MRI biomarker assessment of neuromuscular disease progression: a prospective observational cohort study, The Lancet Neurology 2016: 15: 65-77.
5. Morrow J. M., Evans M. R. B., Grider T., Sinclair C. D. J., Thedens D., Shah S. et al. Validation of MRC Centre MRI calf muscle fat fraction protocol as an outcome measure in CMT1A, Neurology 2018: 91: e1125-e1129.
6. Klickovic U., Zampedri L., Sinclair C. D. J., Wastling S. J., Trimmel K., Howard R. S. et al. Skeletal muscle MRI differentiates SBMA and ALS and correlates with disease severity, Neurology 2019: 93: e895-e907.
7. Lamminen A., Tanttu J., Sepponen R., Pihko H., Korhola O. T1rho dispersion imaging of diseased muscle tissue, The British Journal of Radiology 2014: 66.
8. Wang L., PhD, Regatte R. R., PhD. T1ρ MRI of human musculoskeletal system, Journal of Magnetic Resonance Imaging 2014: 41: 586-600.
9. Mitsumoto H., Brooks B. R., Silani V. Clinical trials in amyotrophic lateral sclerosis_ why so many negative trials and how can trials be improved?, Lancet Neurology 2014: 13: 1127-1138.
10. Kriss A., Jenkins T. Muscle MRI in motor neuron diseases: a systematic review Amyotrophic Lateral Sclerosis and Frontotemporal Degeneration 2021: 0: 1-15.
11. Sharafi A., Chang G., Regatte R. R. Bi-component T1rho and T2 Relaxation Mapping of Skeletal Muscle In-Vivo, Sci Rep 2017: 7: 14115.
12. Ma S., Wang N., Fan Z., Kaisey M., Sicotte N. L., Christodoulou A. G. et al. Three-dimensional whole-brain simultaneous T1, T2, and T1rho quantification using MR Multitasking: Method and initial clinical experience in tissue characterization of multiple sclerosis, Magn Reson Med 2021: 85: 1938-1952.
13. Christodoulou A. G., Shaw J. L., Nguyen C., Yang Q., Xie Y., Wang N. et al. Magnetic resonance multitasking for motion-resolved quantitative cardiovascular imaging, Nat Biomed Eng 2018: 2: 215-226.
14. Haase A., Frahm J., Matthael D., Hanicke W., Merboldt K.-D. FLASH Imaging: Rapid NMR Imaging Using low Flip-Angle Pulses, Journal of Magnetic Resonance 1986: 67: 258-266.
15. Ma S., Wang N., Xie Y., Fan Z., Li D., Christodoulou A. G. Motion-robust quantitative multiparametric brain MRI with motion-resolved MR multitasking, Magn Reson Med 2022: 87: 102-119.
16. Mao X., Lee H.-L., Hu Z., Cao T., Han F., Ma S. et al. Simultaneous Multi-Slice Cardiac MR Multitasking for Motion-Resolved, Non-ECG, Free-Breathing T1–T2 Mapping, Frontiers in Cardiovascular Medicine 2022: 9.
17. Cao T., Wang N., Kwan A. C., Lee H. L., Mao X., Xie Y. et al. Free-breathing, non-ECG, simultaneous myocardial T1 , T2 , T2 *, and fat-fraction mapping with motion-resolved cardiovascular MR multitasking, Magn Reson Med 2022: 88: 1748-1763.
18. Serry F. M., Ma S., Mao X., Han F., Xie Y., Han H. et al. <Dual flip‐angle IR‐FLASH with spin history mapping for B1+ corrected T1 mapping_ Application to T1 cardiovascular magnetic resonance multitasking.pdf>, Magnetic Resonance in Medicine 2021: 86: 3182-3191.
19. Nezafat R., Stuber M., Ouwerkerk R., Gharib A. M., Desai M. Y., Pettigrew R. I. B1-insensitive T2 preparation for improved coronary magnetic resonance angiography at 3 T, 2006: 55: 858-864.
Figures