1782
Characterization of Longitudinal Anatomic and Functional Changes following HIFU Therapy and Implications for Prostate Cancer Surveillance1Department of Radiation Oncology, University of Miami, Miami, FL, United States, 2Desai Seth Urology Institute, Miami, FL, United States, 3Department of Radiology, UH Cleveland Medical Center, Cleveland, OH, United States, 4Department of Pathology and Laboratory Medicine, University of Miami, Miami, FL, United States
Synopsis
Keywords: Quantitative Imaging, Prostate, Focused Ultrasound
Detecting prostate cancer recurrence after high intensity focused ultrasound (HIFU) therapy is a challenge for clinicians. We characterize longitudinal anatomical/functional changes of prostate in men undergoing HIFU therapy for prostate cancer. Nineteen men had mpMRI exams pre-HIFU, and at 1 and 12 months post-HIFU. Prostate volume decreased by 17% on the one year exam and in two-thirds of men changes in prostatic axis, up to 20 degrees in the direction of ablation. Functional mpMRI analysis shows a dramatic decrease in volume transfer constant (Ktrans) on dynamic contrast enhancing (DCE) imaging while there were no changes in apparent diffusion coefficient (ADC).Study Purpose
To characterize anatomical and mpMRI changes after High Intensity Focused Ultrasound (HIFU) focal therapy to guide clinicians when performing post-HIFU prostate cancer surveillance.Methods
Per-protocol, men underwent pre-HIFU and one- and 12-month post-HIFU MRI scans and 12-month post-HIFU biopsies. In a retrospective analysis of prospective data, expert radiologists manually contoured patient lesions on the diagnostic (pre-HIFU) T2-weighted MRI using MIM (MIM Softworks, Cleveland, OH). Additionally, Normal Appearing Tissue (NAT) regions were segmented in the peripheral zone (NAT-PZ) and transition zone (NAT-TZ). These contours as well as a general prostate contour were transferred onto the 1 and 12 month post-HIFU mpMRIs. In all cases, all contours were adjusted to account for prostate size/shape changes following therapy. The ablated zones were segmented. Post-treatment prostate volume, pre-treatment lesion volume and post-treatment ablation zone volume were recorded. Angular orientation of the prostate was measured from co-registration of pre- and post-HIFU T2-weighted MRI. Average ADC values were calculated for each lesion, NAT-PZ and NAT-TZ on the pre- and post-HIFU mpMRI. The Extended Tofts Model was applied to the DCE to obtain the averaged contrast-to-time curve from each ROI1,2. All features were implemented in MATLAB (Mathworks, Inc. Natick, MA). Univariate two-tailed t-tests were used to compare the changes in the anatomical and functional MRI characteristics.Results
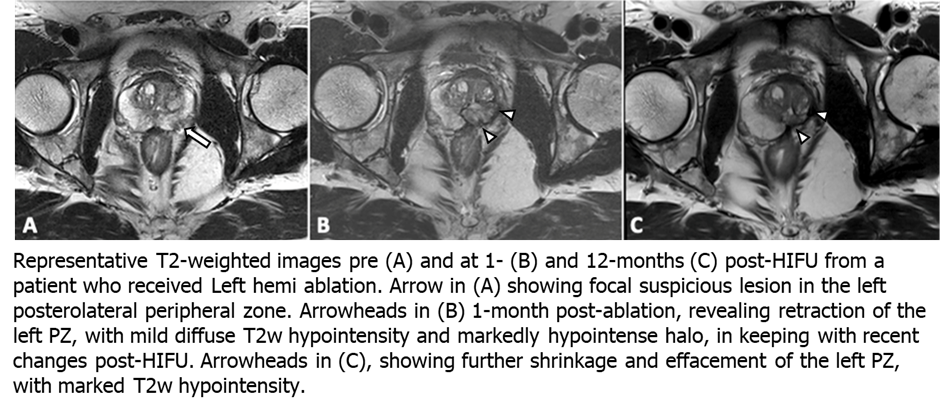
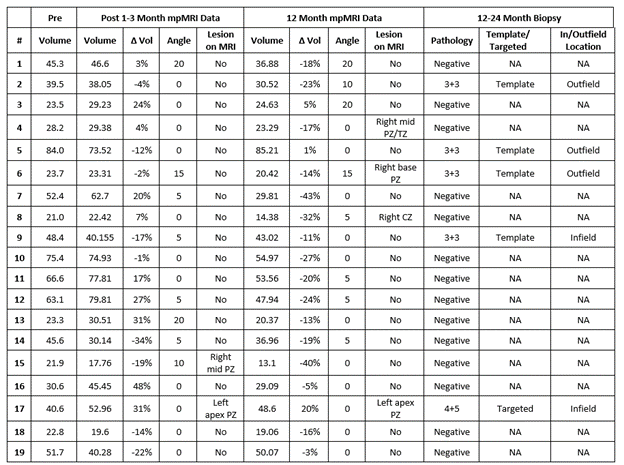
Nineteen patients were analyzed. The median age at time of HIFU was 68.4 years [interquartile range (IQR) 65.5 – 70.7 years]. Median PSA was 6.1 ng/ml [IQR 4.2 – 6.5 ng/ml]. All PI-RADS lesions were within the peripheral zone. 5/19 (26.3%), 10/19 (52.6%), 2/19 (10.5%), 1/19 (5.3%) and 1/19 (5.3%) had Gleason Grade Group 1 through 5 prostate cancer, respectively. 15/19 (78.9%) men underwent hemi-gland HIFU and 4/19 (21.1%) underwent focal ablation.A total of 57 mpMRIs were included in this analysis. Preoperative median prostate size was 40.6 cc [23.6 - 52.1 cc]. One month after HIFU, prostatic volumetric change was variable with a median increase of 3% [-13% - 22%] (p = 0.51). At twelve months there was a -17% [-23% - -8%] reduction in prostate volume compared to baseline (p = 0.001). Prostate rotation was seen in 12/19 men with a median angulation of 5 ̊ degrees and max angulation of 20 ̊ at one and 12 months with 83% of rotations in the direction of hemi-ablation. Figure 1 shows representative pre-operative (A), one-month (B) and 12-month (C) T2-weighted MRI changes seen after left hemi-gland HIFU ablation. A summary of pre- and post-operative statistics including follow-up biopsy are shown in Table 1.
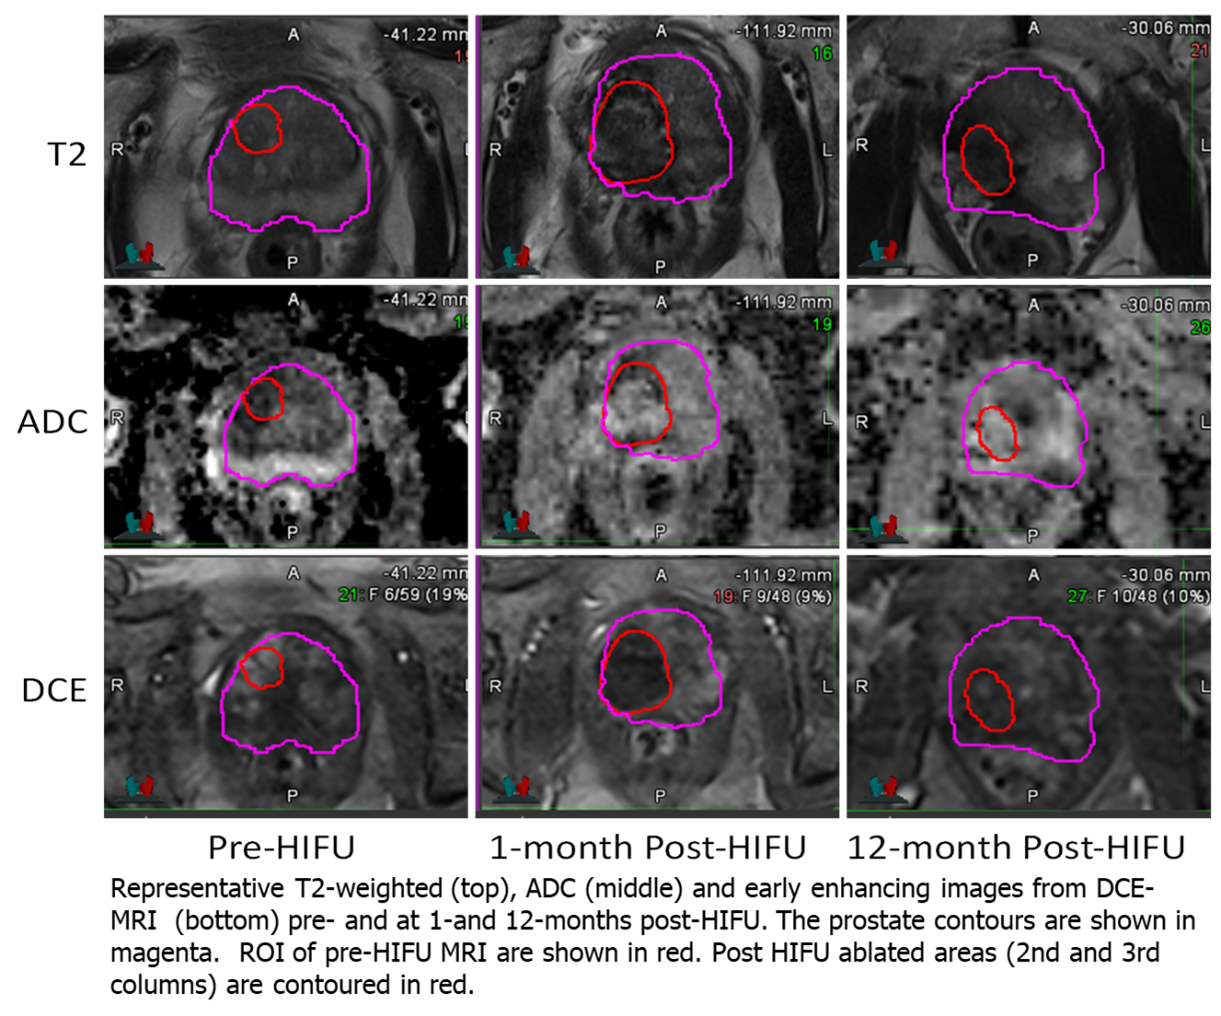
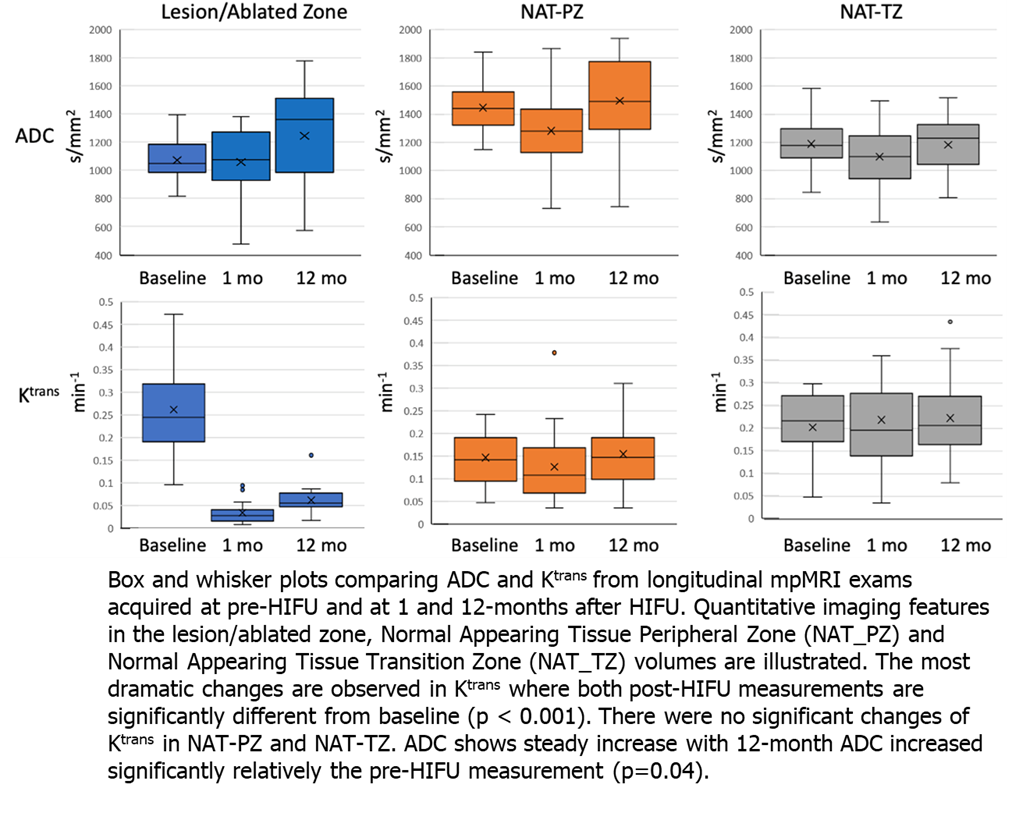
Representative segmentation volumes are illustrated in Figure 2. Pre-treatment ADC values were significantly different between the three volumes: Lesion and NAT-PZ (p<0.001); Lesion and NAT-TZ (p=0.03); and NAT-PZ and NAT-TZ (p<0.001). Lesions had the lowest ADC (mean±SD: 1078±167), followed by NAT_TZ (1190±175) and NAT_PZ (1446±184). Ktrans was also different between the Lesion and NAT-PZ (p<0.001) and NAT-PZ and NAT-TZ (p=0.03). The highest Ktrans was in the Lesion (mean±SD: 0.26±0.11), followed by NAT_TZ (0.20±0.08) and NAT_PZ (mean±SD: 0.15±0.06). The longitudinal changes of ADC and Ktrans before and after HIFU are shown in Figure 3. The most dramatic changes are observed in Ktrans where both 1-month and 12-month post-HIFU measurements are significantly decreased in the ablated zone compared to the pre-treatment lesion (p<0.001). There were no significant changes of Ktrans in NAT-PZ and NAT-TZ. ADC of the ablated zone does not change significantly relative to the pre-HIFU lesion ADC measurement at 1- and 12-month post-operatively (p=0.83 and p=0.07, respectively).
Discussion
Coagulative necrosis and prostatic tissue swelling is expected and contributes to the risk of post-operative urinary retention which may be seen in 2-9% of patients after HIFU3. Over time, necrotic tissue undergoes organization (fibrosis) causing prostatic volume reduction4. Challenges of TRUS (transrectal ultrasound) biopsy after HIFU are well known due to loss of zonal anatomy with ill-defined contours and heterogeneous parenchyma5. Additionally, changes in rotation make it challenging to distinguish left from right lobe during biopsy and may cause inadvertent biopsy of the opposite lobe. Importantly, if such a biopsy is positive, this changes the oncologic designation of de novo cancer versus treatment failure. Our results match prior published work that ADC values between the pre-treatment lesion and ablated zone do not change after HIFU therapy6. The lack of change in ADC occurs not because of true restricted diffusion in the ablated zone but likely due to the “blackout effect” of T2-hypointense fibrosis and scarring present as low signal foci on ADC7. Physiologically, Ktrans measures capillary permeability within the prostate tissue. Prior to treatment, lesions show higher Ktrans values due to increased permeability of the tumor microvasculature. After treatment, tissue destruction leads to a decreased blood flow to the ablated zone causing an abrupt and sustained drop in Ktrans.Conclusion
Detecting prostate cancer recurrence after HIFU therapy is a challenge for follow-up patient care. Acquiring quantitative data for post-treatment therapy may also serve to drive future algorithm-powered tools to assist clinicians with determination of treatment outcome.Acknowledgements
Research reported in this work was supported by the National Cancer Institute of the National Institutes of Health under Award Number P30CA240139, K12CA226330 and U01CA239141. The content is solely the responsibility of the authors and does not necessarily represent the official views of the National Institutes of Health.References
1. Tofts, Paul S. "Modeling tracer kinetics in dynamic Gd‐DTPA MR imaging." Journal of magnetic resonance imaging 7.1 (1997): 91-101.
2. Tofts PS, Brix G, Buckley DL, et al. Estimating kinetic parameters from dynamic contrast-enhanced T(1)-weighted MRI of a diffusable tracer: standardized quantities and symbols. J Magn Reson Imaging. 1999;10(3):223–232. doi: 10.1002/(sici)1522-2586(199909)10:3<223::aid-jmri2>3.0.co;2-s.[BA1]
3. He Y, Tan P, He M, et al. The primary treatment of prostate cancer with high-intensity focused ultrasound: A systematic review and meta-analysis. Medicine (Baltimore). 2020;99(41):e22610. doi: 10.1097/MD.0000000000022610.
4. Biermann K, Montironi R, Lopez-Beltran A, Zhang S, Cheng L. Histopathological findings after treatment of prostate cancer using high-intensity focused ultrasound (HIFU). Prostate. 2010;70(11):1196–1200. doi: 10.1002/pros.21154.
5. Rouvière O, Mège-Lechevallier F, Chapelon J-Y, et al. Evaluation of color Doppler in guiding prostate biopsy after HIFU ablation. Eur Urol. 2006;50(3):490–497. doi: 10.1016/j.eururo.2005.12.046.
6. Kim CK, Park BK, Lee HM, Kim SS, Kim E. MRI techniques for prediction of local tumor progression after high-intensity focused ultrasonic ablation of prostate cancer. AJR Am J Roentgenol. 2008;190(5):1180–1186. doi: 10.2214/AJR.07.2924.
7.
Ghafoor S, Becker AS, Stocker D, et al. Magnetic resonance imaging of the
prostate after focal therapy with high-intensity focused ultrasound. Abdom
Radiol (NY). 2020;45(11):3882–3895. doi: 10.1007/s00261-020-02577-5.
Figures