1780
Quantitative Magnetization Transfer Imaging in Glioblastoma Patients using Balanced Steady-state Free Precession on a 1.5 T MR-Linac1Medical Biophysics, University of Toronto, Toronto, ON, Canada, 2Physical Sciences Platform, Sunnybrook Research Institute, Toronto, ON, Canada, 3Radiation Oncology, Sunnybrook Health Sciences Centre, Toronto, ON, Canada
Synopsis
Keywords: Quantitative Imaging, Magnetization transfer
Quantitative magnetization transfer (qMT) imaging could be used to assess tumor response on an MR-Linac. However, qMT protocols which use an off-resonance saturation pulse are slow and does not have the 3D coverage necessary to assess tumor response. We implemented a fast 3D balanced steady-state free precession qMT protocol on the MR-Linac. Six glioblastoma patients were scanned on the MR-Linac at weekly intervals during treatment. qMT parameter maps derived using non-linear least square fitting show similar contrast to other qMT protocols. Within-subject coefficient of variation was higher than values found in literature for off-resonance qMT protocols.
Introduction
MR-linear accelerators (MR-Linacs) enable daily imaging for radiotherapy guidance. Radiation dose distributions could be adapted according to tumor response; however, current treatment response assessment methods for glioblastoma rely on gadolinium enhanced imaging which has poor specificity1. Additionally, repeated administration of gadolinium-based contrast agents can lead to adverse effects2 and may affect the dose profile of the radiation delivered3.Quantitative magnetization transfer (qMT) imaging can detect early changes in white matter microstructures which may be used to assess tumor response4,5. However, common qMT protocols which rely on off-resonance RF pulses are too slow to achieve 3D coverage in an MR-Linac treatment session.
In this abstract, we implement and evaluate the repeatability of a 3D balanced steady-state free precession (bSSFP) qMT sequence for use with an MR-Linac. While bSSFP qMT has been previously implemented on a 1.5T MRI6, hardware limitations from combining a scanner and an accelerator may affect qMT parameter quality.
Methods
Patients and data acquisition: Six glioblastoma patients received fractionated radiotherapy on a 1.5T Elekta Unity MR-Linac (Elekta, Stockholm, Sweden). A 3D bSSFP-based qMT protocol was acquired while during treatment at weekly intervals6,7. Sequences include a series of 14 bSSFP scans with varying flip angle and RF pulse duration (TRF) to modulate magnetization transfer contrast and T1/B0/B1 mapping (sequence parameters in Figure 1).Parameter fitting and analysis: The exchange rate (kf), free pool T2 (T2f) and macromolecular fraction (F) were estimated voxelwise by fitting the bSSFP scans to an analytical Bloch equation solution as the offset frequency approaches zero7 using a non-linear least-squares solver (MATLAB 2018b lsqcurvefit). The signal curve and the fitted model is shown in Figure 2. The free pool T1 is estimated using the T1 map and flip angle correction was applied using the B1 map. Due to the poor signal-to-noise ratio in the bSSFP scans, kf was constrained to 4.5 s-1 while fitting the data to improve the quality of the parameter maps.
Four regions of interest (ROIs) were defined: contra-lateral normal appearing white matter (cNAWM), contra-lateral normal appearing gray matter (cNAGM), cerebrospinal fluid (CSF) and the gross tumor volume (GTV). The cNAWM, cNAGM and CSF were created using automated segmentation with FSL FAST8. The GTV was defined at treatment planning by a radiation oncologist. The median F was calculated for each ROI.
Repeatability was evaluated in cNAWM, cNAGM and CSF. following recommendations for technical performance assessment of quantitative imaging biomarkers9. The parameter values within these ROIs to be stable across several weeks. A one-way random effects model Yij = μ + ui + εij is used to compute the within-subject standard deviation (wSD) and the within-subject coefficient of variation (wCV); Yij is the measurement, μ is the overall mean, ui is the contribution from random effects and εij is the error term. For each ROI, the median F values are fit to the model using lme, which returns the wSD. wCV can then be calculated using wSD/μ.
Results
Figure 3 shows the T2f and F maps in a single patient. There is clear contrast between white matter and gray matter. However, the values of across all ROIs are lower than what is reported in literature6.Figure 4 shows the macromolecular fraction in different ROIs. Apart from CSF, the median F appears to change between patients and treatment sessions. While the distribution of F in cNAWM appears normal in all patients, the distribution of F in GTV changes with each patient.
Repeatability metrics in cNAWM, cNAGM and CSF are shown in Figure 5.
Discussion
The previous qMT protocol we implemented on the MR-Linac took 18 minutes to acquire three 5mm thick slices5,10. In comparison, this bSSFP qMT protocol takes only 10 minutes to acquire whole brain qMT. F maps produced using bSSFP qMT show similar contrast to the previous qMT protocol. While differences in macromolecular fraction in the GTV between subjects was observed, no significant changes to macromolecular fraction within the same subject across weeks was found. The scans may be too late in treatment to be able to resolve such changes, or patients scanned may not have had progressing tumors.The wCV in cNAWM was 8.8%, which is considerably higher than the value reported in white matter ROIS in literature (4.7%)11. Several factors may contribute to the difference in repeatability metrics in this study compared to literature. Measurements were done in patients, which adds additional variability due to disease progression and ongoing chemoradiation. The use of an on-resonance bSSFP pulse sequence and the use of a MR-Linac also differs from literature. More thorough test-retest studies of bSSFP qMT on both an MR-Linac and diagnostic MRI are necessary to better estimate variability caused by these different factors.
Conclusion
bSSFP qMT was implemented on a 1.5T MR-Linac and provided 3D parameter maps within 10 minutes. Repeatability metrics were measured in six patients. The wCV in cNAWM was higher than literature values obtained with an off-resonance RF pulse. More thorough studies are necessary to conclusively determine repeatability and determine if bSSFP qMT can assess tumor treatment response.Acknowledgements
We thank the MR-Linac radiation therapists Shawn Binda, Danny Yu, Renée Christiani, Katie Wong, Helen Su, Monica Foster, Rebekah Shin, Khang Vo, Ruby Bola, Susana Sabaratram, Christina Silverson, Danielle Letterio, and Anne Carty for scanning and for their assistance with the protocol; Mikki Campbell and Aimee Theriault for study coordination; Brian Keller and Brige Chugh for MR-Linac operations; and James Stewart for data retrieval. We gratefully acknowledge the following sources of funding: Natural Sciences and Engineering Research Council (NSERC); Canadian Institutes of Health Research.References
[1] P. Y. Wen, D. R. Macdonald, D. A. Reardon, T. F. Cloughesy, A. G. Sorensen, E. Galanis, J. DeGroot, W. Wick, M. R. Gilbert, A. B. Lassman, C. Tsien, T. Mikkelsen, E. T. Wong, M. C. Chamberlain, R. Stupp, K. R. Lamborn, M. A. Vogelbaum, M. J. van den Bent, and S. M. Chang, “Updated response assessment criteria for high-grade gliomas: Response assessment in neuro-oncology working group,” Journal of Clinical Oncology, vol. 28, no. 11, pp. 1963–1972, 2010.[2] M. Rogosnitzky and S. Branch, “Gadolinium-based contrast agent toxicity: A review of known and proposed mechanisms,” BioMetals, vol. 29, no. 3, pp. 365–376, 2016.
[3] S. B. Ahmad, M. R. Paudel, A. Sarfehnia, A. Kim, G. Pang, M. Ruschin, A. Sahgal, and B. M. Keller, “The dosimetric impact of gadolinium-based contrast media in GBM brain patient plans for a MRI-LINAC,” Physics in Medicine & Biology, vol. 62, no. 16, 2017.
[4] H. Mehrabian, S. Myrehaug, H. Soliman, A. Sahgal, and G. J. Stanisz, “Quantitative magnetization transfer in monitoring glioblastoma (GBM) response to therapy,” Scientific Reports, vol. 8, no. 1, 2018.
[5] R. W. Chan, H. Chen, S. Myrehaug, E. G. Atenafu, G. J. Stanisz, J. Stewart, P. J. Maralani, A. K. Chan, S. Daghighi, M. Ruschin, S. Das, J. Perry, G. J. Czarnota, A. Sahgal, and A. Z. Lau, “Quantitative CEST and MT at 1.5T for monitoring treatment response in glioblastoma: Early and late tumor progression during chemoradiation,” Journal of Neuro-Oncology, vol. 151, no. 2, pp. 267–278, 2020.
[6] M. Gloor, K. Scheffler, and O. Bieri, “Quantitative magnetization transfer imaging using balanced SSFP,” Magnetic Resonance in Medicine, vol. 60, no. 3, pp. 691–700, 2008.
[7] F. M. Bayer, M. Bock, P. Jezzard, and A. K. Smith, “Unbiased signal equation for quantitative magnetization transfer mapping in balanced steady‐state free precession MRI,” Magnetic Resonance in Medicine, vol. 87, no. 1, pp. 446–456, 2021.
[8] Y. Zhang, M. Brady, and S. Smith, “Segmentation of brain MR images through a hidden markov random field model and the expectation-maximization algorithm,” IEEE Transactions on Medical Imaging, vol. 20, no. 1, pp. 45–57, 2001.
[9] D. L. Raunig, L. M. McShane, G. Pennello, C. Gatsonis, P. L. Carson, J. T. Voyvodic, R. L. Wahl, B. F. Kurland, A. J. Schwarz, M. Gönen, G. Zahlmann, M. V. Kondratovich, K. O’Donnell, N. Petrick, P. E. Cole, B. Garra, and D. C. Sullivan, “Quantitative imaging biomarkers: A review of statistical methods for technical performance assessment,” Statistical Methods in Medical Research, vol. 24, no. 1, pp. 27–67, Jun. 2014.
[10] R. W. Chan, L. S. P. Lawrence, R. T. Oglesby, H. Chen, J. Stewart, A. Theriault, M. Campbell, M. Ruschin, S. Myrehaug, E. G. Atenafu, B. Keller, B. Chugh, S. MacKenzie, C.-L. Tseng, J. Detsky, P. J. Maralani, G. J. Czarnota, G. J. Stanisz, A. Sahgal, and A. Z. Lau, “Chemical Exchange Saturation Transfer MRI in central nervous system tumors on a 1.5 T MR-linac,” Radiotherapy and Oncology, vol. 162, pp. 140–149, 2021.
[11] I. R. Levesque, J. G. Sled, S. Narayanan, P. S. Giacomini, L. T. Ribeiro, D. L. Arnold, and G. B. Pike, “Reproducibility of quantitative magnetization‐transfer imaging parameters from repeated measurements,” Magnetic Resonance in Medicine, vol. 64, no. 2, pp. 391–400, 2010.
Figures
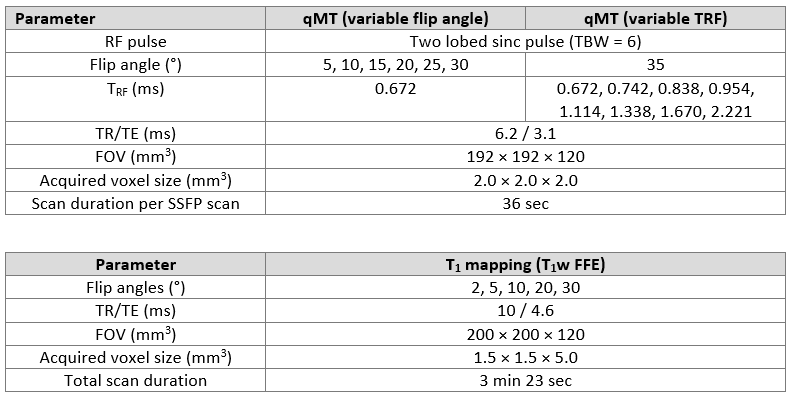
Figure 1 – MR-Linac scan protocol: The acquisition parameter for the MR-Linac SSFP scans and T1 mapping.
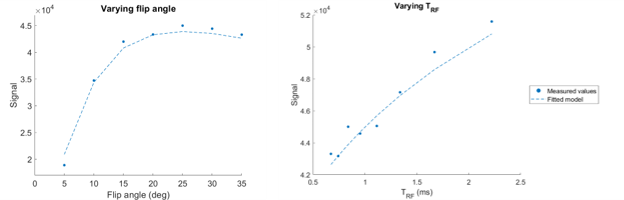
Figure 2 – Balanced steady-state free precession (bSSFP) signal curve: Measured signal as a function of flip angle and duration of RF pulse. The measured values were from a single voxel in a white matter ROI. The dotted line shows the fitted model.
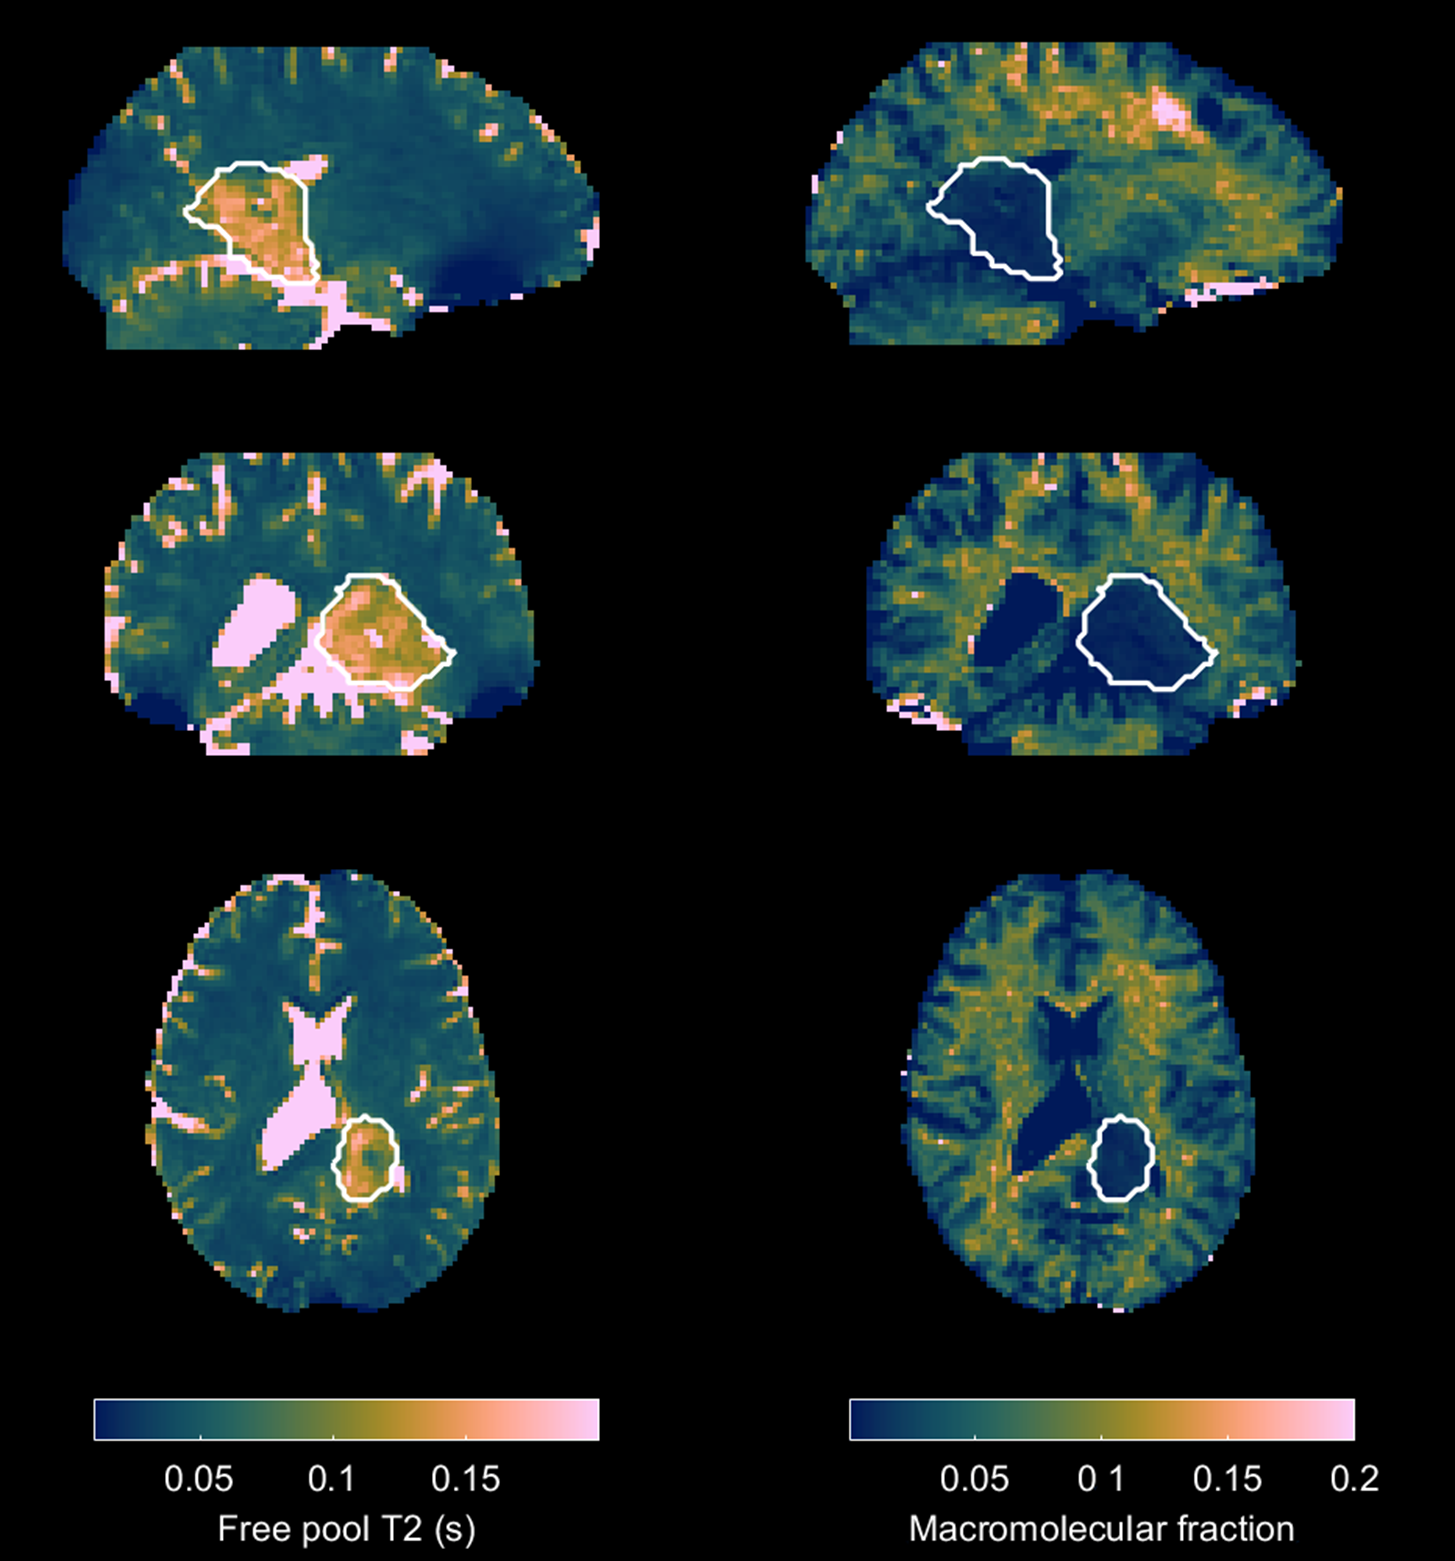
Figure 3 – Quantitative magnetization transfer imaging maps: Sagittal, coronal, and axial images of a glioblastoma patient showing free pool T2 (left) and macromolecular fraction (right).
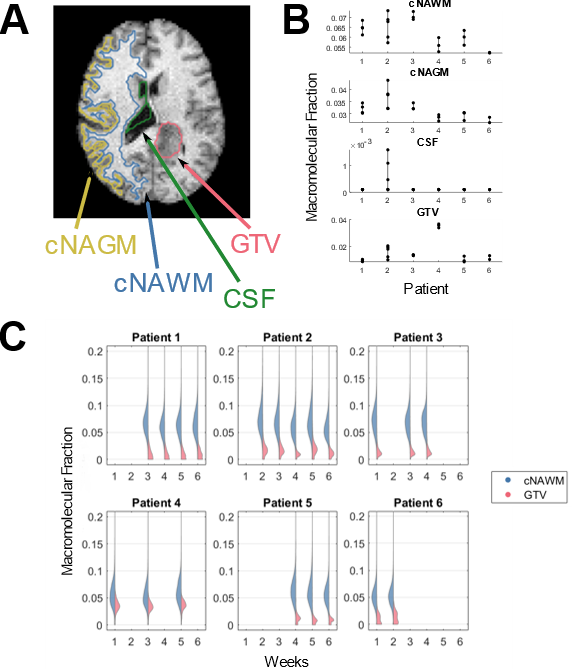
Figure 4 – Measurements of macromolecular fraction: (A) shows the contours for cNAWM, cNAGM, CSF and GTV for one patient. (B) shows median macromolecular fraction in each ROI for different patients across different subjects; the vertical lines linked scans in the same patient. (C) shows the distribution of macromolecular fraction in cNAWM and GTV.
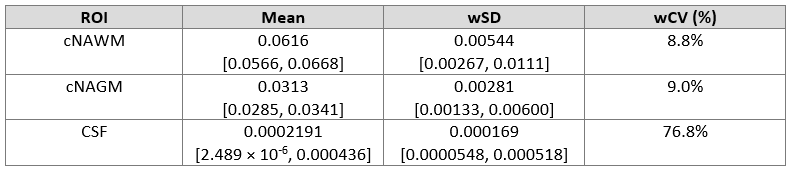
Figure 5 – Repeatability metrics: The repeatability metric for macromolecular fraction on the MR-Linac. The 95% confidence interval is in square brackets where appropriate.