1778
Improved reliability of R2* and susceptibility quantification using 3D EPI acquisition1Advanced Imaging Research Center, UT Southwestern Medical Center, Dallas, TX, United States, 2Laboratory of Functional and Molecular Imaging , NINDS, NIH, Bethesda, MD, United States, 3F.M. Kirby Research Center for Functional Brain Imaging, Kennedy Krieger Institute, Baltimore, MD, United States, 4Department of Radiology and Radiological Sciences, Johns Hopkins University, Baltimore, MD, United States, 5NMR Research Center, NINDS, NIH, Bethesda, MD, United States
Synopsis
Keywords: Quantitative Imaging, Quantitative Susceptibility mapping
The quantification of decay rate R2* and susceptibility is useful in assessment of various neurological disorders manifesting iron accumulation and myelin loss. Conventional 3D GRE acquisition is sensitive to motion and B0 fluctuation due to its long scan time. In this study, we demonstrated improved reliability of multi-shot multi-echo 3D EPI when compared to GRE, showing reduced scan time and similar accuracy.
Introduction
T2*-weighted (T2*w) gradient echo (GRE) MRI has been widely used in clinical research for high resolution MRI1,2. However, high resolution T2*w MRI is sensitive to both motion and B0 fluctuation, limiting its potential clinical application. We hypothesize that when using multi-shot multi-echo 3D echo-planar imaging (EPI) for T2*w data acquisition, the reduced scan time can improve the reliability of quantitative metrics, including R2* and susceptibility χ. In this study, we evaluated this in a group of subjects by comparing the test-retest reliability and accuracy of 3D EPI with 3D GRE.Methods
MRI experimentExperiments were performed on a 3T MRI scanner (Prisma, Siemens) with a 64-channel head-neck RF coil. Eight healthy subjects were recruited with signed consent (age: 46±20 year old, 4 males). The imaging protocol included T2*w multi-echo 3D GRE and multi-echo 3D EPI (Table 1). The major difference between GRE and EPI protocols was the EPI factor, which defines the number of k-space lines per echo. Acquisition bandwidth was chosen such that the EPI data had similar SNR per unit time and readout train length as the GRE data. Scans were repeated for test-retest measurement. In all scans, 3D EPI navigators were obtained with 6x5.6x15 mm3 spatial and 0.36 s temporal resolution for correction of head motion and B0 changes3. An MPRAGE scan with isotropic 1 mm resolution was performed for segmentation and region-based group analysis.
In another experiment, 3D EPI was used to acquire T2*w data with nearly isotropic 0.45 mm resolution in about 10 minutes. This was performed in one healthy subject on a 7 T MRI (Terra, Siemens) with a 32-channel head coil (Nova Medical) using accelerated 3D EPI and 3D GRE protocols as shown in Table 2.
Image reconstruction
The T2*-weighted images were reconstructed with a custom MATLAB software which used the navigator information to perform motion and B0 corrections 3. The images were corrected with either motion and linear B0 correction (corrected mode) or only global average B0 correction (uncorrected mode). Eddy current-related 1D phase correction was performed for EPI data.
Data analysis
The decay rate R2* was calculated using least square nonlinear fitting in MATLAB. Susceptibility χ was calculated using the JHU/KKI QSM toolbox4. These maps were aligned based on the T2*w magnitude data to correct for inter-scan motion.
Test-retest reliability was calculated as the difference of R2* and χ between two measurements. For EPI, each measurement contained averaged data from 3 or 5 scans according to the EPI factor in order to match SNR to the GRE data. In addition, agreement of R2* and χ between GRE and EPI methods were evaluated based on the mean value of different deep brain regions of interest (ROI) in the MNI space.
Results
Fig. 1 shows that with higher EPI factor or equivalently shorter single scan duration, a larger portion of voxels exhibited reduced inter-scan difference of R2* and χ and thus improved test-retest reliability. This trend applies to both corrected and uncorrected data. The average SNR in the GRE and averaged (averages of 3 or 5) EPI data at TE=14 ms was estimated to be 60 based on the noise measurement. The noise-equivalent inter-scan difference of R2* and χ based on average R2*=18 s-1 were estimated and indicated in Fig. 1. This confirmed that the test-retest reliability of GRE result is not only affected by thermal noise but also more by other sources compared to the EPI data.Fig. 2 illustrates the level of consistency of R2* and χ between corrected EPI (x5) and GRE data. In Fig. 2A, the group-average R2* difference is less than 2 s-1 without significant residual anatomical information visible except in regions where the MRI signal is low (skull) or signal fluctuation is high (ventricles and large vessels). In Fig. 2B, the group-average χ difference is low, on the order of 0.005 ppm, but with slight systematic difference, e.g. in the white matter area. We suspect that this is due to imperfect EPI phase correction for the bipolar readout gradient or different sensitivity in the MR phase signal to the applied readout gradient. Overall, ROI-average values showed high correlation, with a correlation coefficient of 1.0 and a slope of 1.000 ± 0.003 for R2* and 1.0 and 1.004 ± 0.008 for χ, respectively.
At 7 T, the high resolution T2*-weighted EPI image demonstrated similar anatomical details and brain morphology compared to the GRE image as shown in Fig. 3. It is worth noting that even with only 10 minutes of scan time, there appears to be sufficient SNR in the EPI image.
Discussion
We demonstrated improved test-retest reliability of R2* and χ quantification using multi-shot multi-echo 3D EPI sequences compared to 3D GRE, which is the commonly used acquisition method. The observed gain is attributed to reduced motion, physiology and instrument instability occurring in reduced scan time. This gain occurred while preserving measurement consistency. A very small systematic difference in χ between methods was noticed and requires further investigation to determine its origin.Conclusion
Multi-shot multi-echo 3D EPI can be a useful alternative acquisition method for quantitative T2*-weighted MRI with improved reliability and similar accuracy compared to 3D GRE in clinical applications.Acknowledgements
This work was partly supported by a faculty startup fund of UT Southwestern Medical Center and the intramural research program of the National Institute of Neurological Disorders and Stroke.References
[1] J. H. Duyn, P. van Gelderen, T.-Q. Li, J. A. de Zwart, A. P. Koretsky, and M. Fukunaga, “High-field MRI of brain cortical substructure based on signal phase,” Proc. Natl. Acad. Sci. U.S.A., vol. 104, no. 28, pp. 11796–11801, Jul. 2007, doi: 10.1073/pnas.0610821104.
[2] E. M. Haacke, S. Mittal, Z. Wu, J. Neelavalli, and Y.-C. N. Cheng, “Susceptibility-Weighted Imaging: Technical Aspects and Clinical Applications, Part 1,” AJNR Am J Neuroradiol, vol. 30, no. 1, pp. 19–30, Jan. 2009, doi: 10.3174/ajnr.A1400.
[3] J. Liu, P. van Gelderen, J. A. de Zwart, and J. H. Duyn, “Reducing motion sensitivity in 3D high-resolution T2*-weighted MRI by navigator-based motion and nonlinear magnetic field correction,” Neuroimage, vol. 206, p. 116332, 2020, doi: 10.1016/j.neuroimage.2019.116332.
[4] X. Li et al., “Multi-atlas tool for automated segmentation of brain gray matter nuclei and quantification of their magnetic susceptibility,” Neuroimage, vol. 191, pp. 337–349, May 2019, doi: 10.1016/j.neuroimage.2019.02.016.
Figures
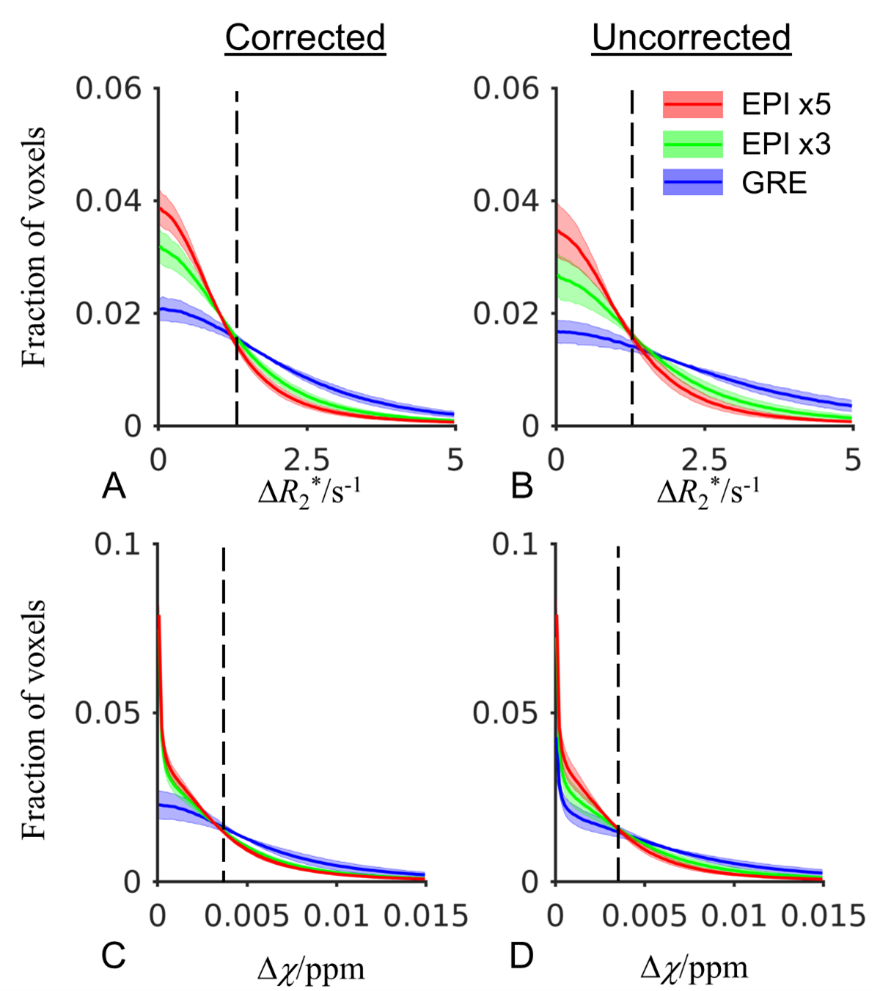
Fig. 1 Histogram showing voxelwise distribution of inter-scan difference of R2* and χ in eight subjects for the 3D EPI protocols with EPI factors of 5 and 3 and GRE at 3 T. The shaded area marks standard deviation of individual subjects. The vertical dash line indicates the noise-equivalent inter-scan difference of R2* and χ.
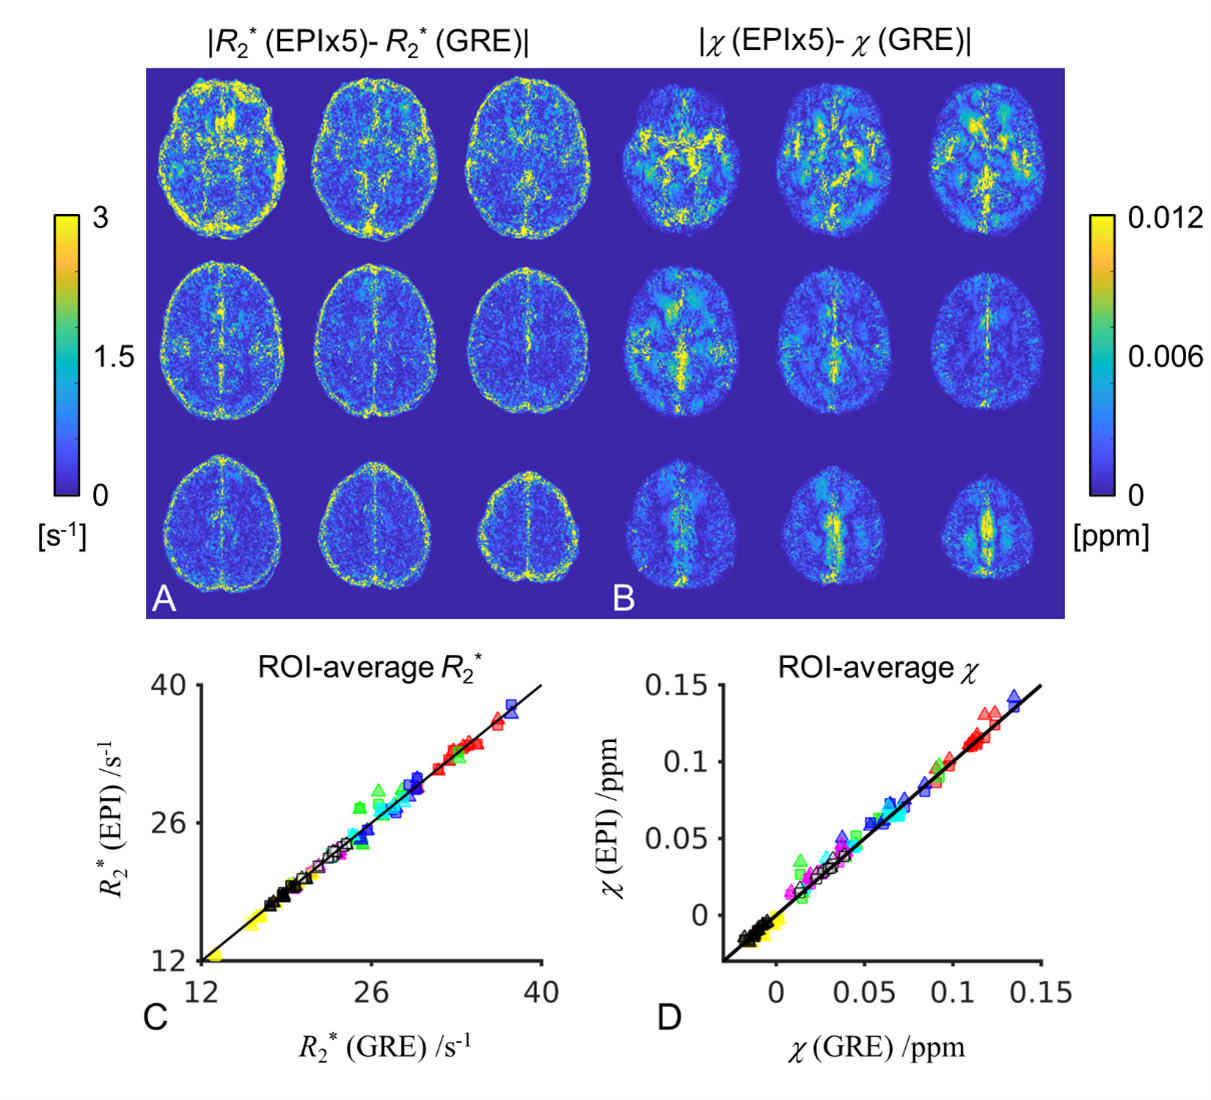
Fig. 2 (A and B) Group-level (n=8) voxelwise absolute difference of R2* and χ between EPI with EPI factor of 5 and GRE at 3 T. (C and D) ROI-average R2* and χ in EPI×5 (squares), EPI×3 (triangles) in reference to GRE in all subjects. Each data point represents one ROI mean from one subject. ROIs include 5 deep grey nuclei (substantia nigra [blue], red nucleus [green], putamen [cyan], globus pallidus [red] and caudate nucleus[magenta]) and 3 white matter regions (splenium of corpus callosum [yellow], posterior limbs of internal capsule [hollow white] and part of the optic radiation [black]).
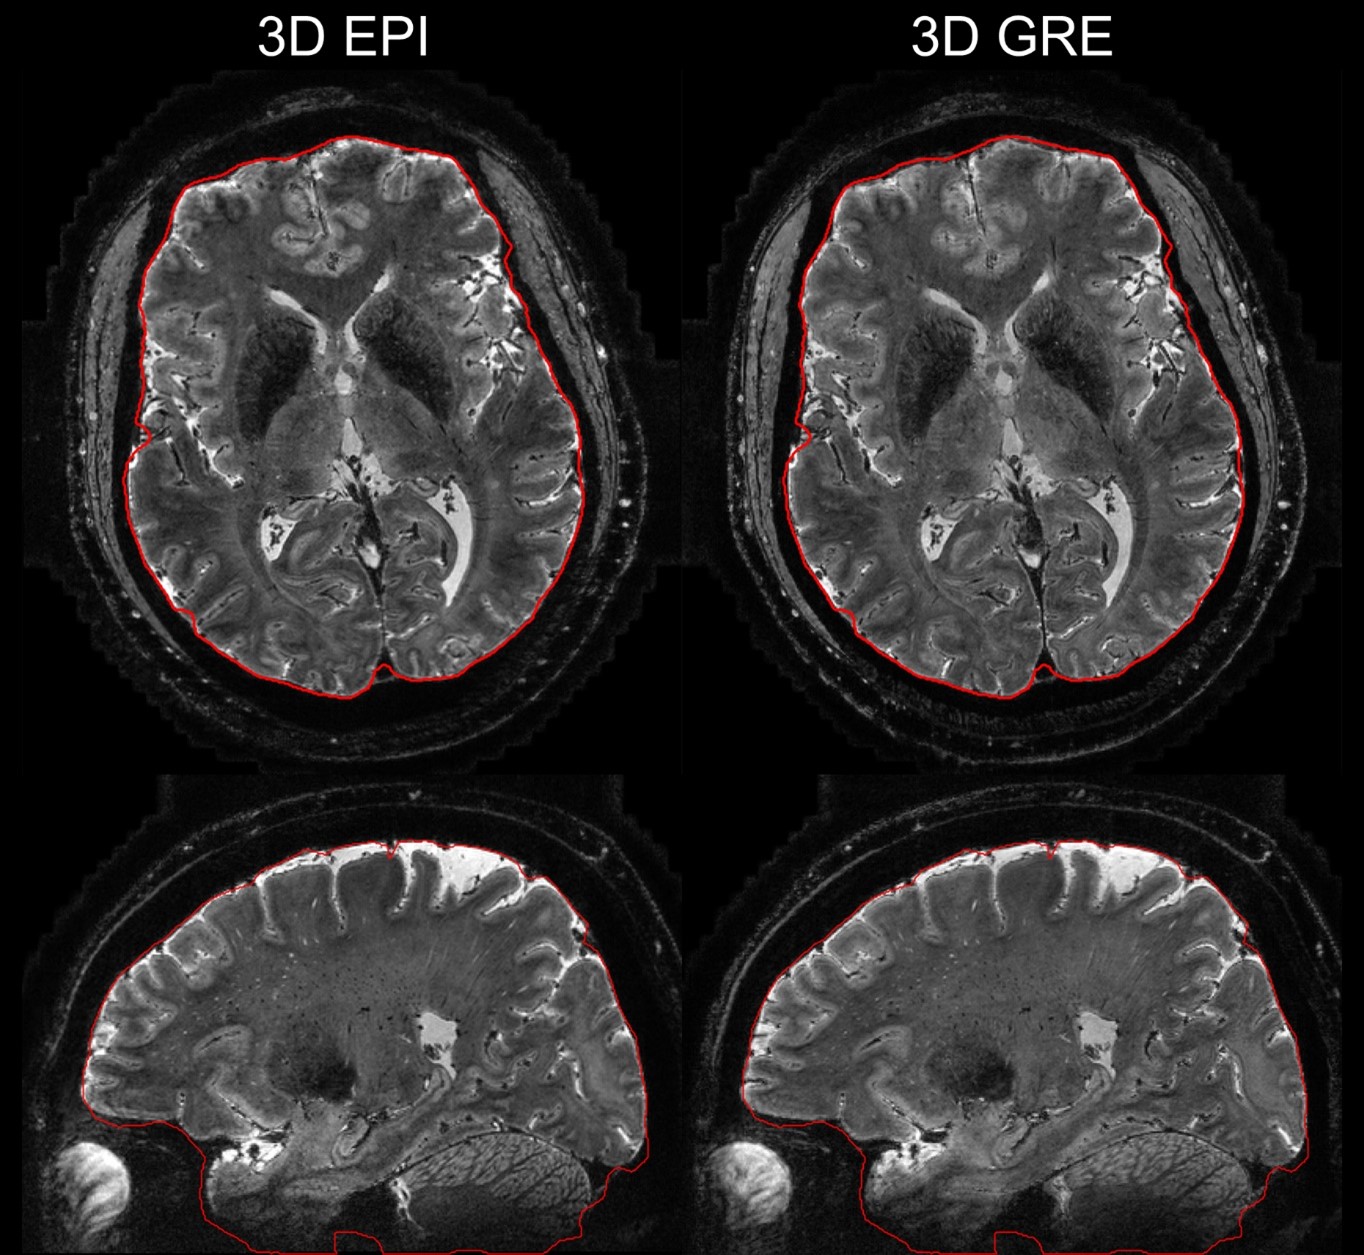
Fig. 3 T2*-weighted 0.45 mm resolution images averaged across echo times at 7 T using 3D EPI and 3D GRE acquisition. The red contour outlines the brain boundary which was derived from the GRE image. Note that the contour showed small deviation from the brain boundary in some regions due to imperfect brain extraction using the brain extraction tool (BET, FSL).
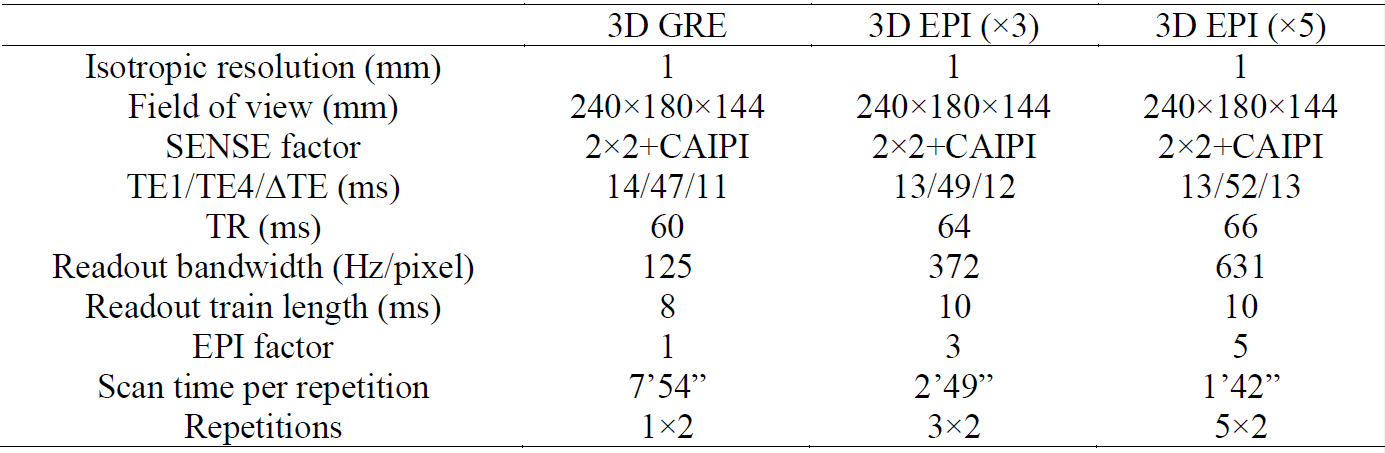
Table 1 Parameters of 3 T T2*-weighted protocols
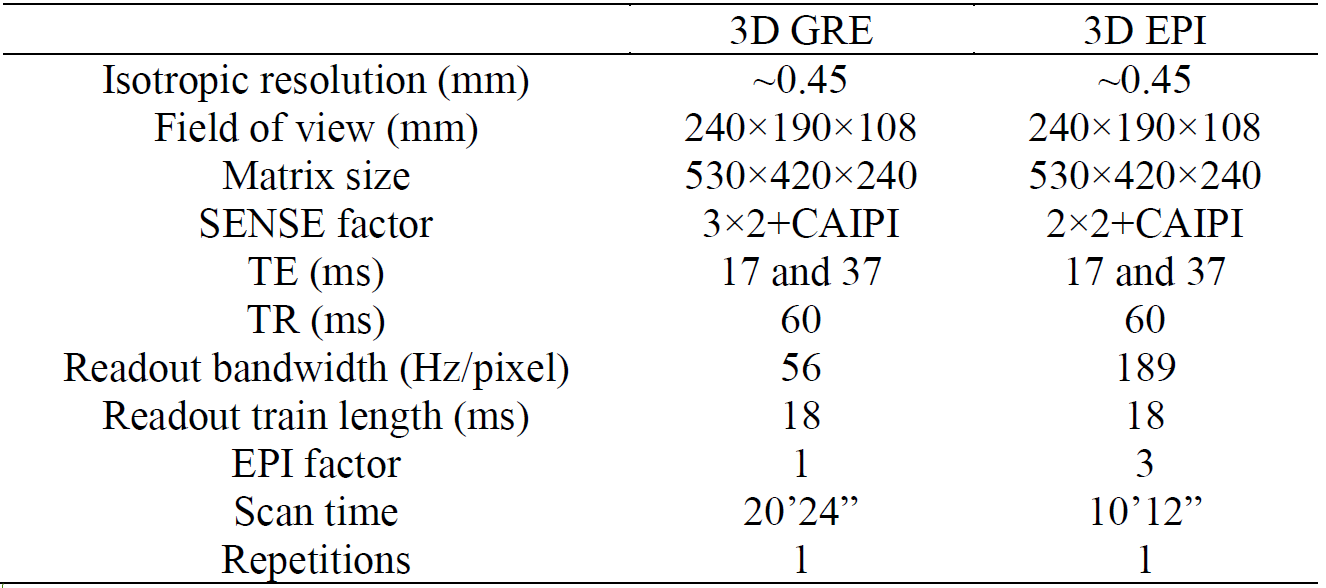
Table 2 Parameters of 7 T T2*-weighted protocols