1767
Optimization of the magnetization-prepared rapid gradient echo (MP-RAGE) sequence for 0.55 T1Department of Biomedical Engineering, University of Basel, Basel, Switzerland, 2Division of Radiological Physics, Department of Radiology, University Hospital Basel, Basel, Switzerland
Synopsis
Keywords: Low-Field MRI, Brain, MP-RAGE, low-field, white matter, gray matter
The MP-RAGE is the most commonly used sequence for structural brain imaging in clinical routine. Consequently, the optimization of imaging parameters for maximum contrast and signal is an important task. In this work, we implemented a previously developed computation and calculated optimal parameters for 0.55T. Additionally, the obtained images were compared with a gray-white matter contrast-optimized FLASH. Computing the contrast-to-noise ratio revealed a clear benefit for MP-RAGE over FLASH at mid to low resolutions, while a trend towards similar or even higher contrast-to-noise ratios for FLASH as compared to MP-RAGE at high resolutions was observed.Introduction
The MP-RAGE sequence is the workhorse for T1-weighted high grey/white matter (GM/WM) contrast in clinical routine. Developed in the 1990s1 it has been refined and used excessively, being part of almost every MRI examination today. Consequently, it does make sense to put some effort into the optimization of this sequence to get the most benefit out of it. Obviously, its signal depends on T1, which varies with field strength. Therefore, the sequence parameters which yield the maximum tissue contrast are field strength dependent. There have been studies optimizing tissue contrast for the MP-RAGE2,3. However, to our knowledge, none have dealt with 0.55T.Here, we implemented one of these computations3 to optimize MP-RAGE parameters for 0.55T. Additionally, an equivalent FLASH sequence was set up to compare the tissue contrast of both sequences.
Methods
Simulation: To obtain the optimal parameters for the MP-RAGE the computation introduced by Wang et al.3 was implemented. The signal intensity $$$s_i$$$ for the $$$i$$$-th readout depends on T1, the number of partitions N, echo-spacing τ, flip angle θ, the delay TI after the inversion pulse, before acquisition starts and the delay TD after acquisition of the inner loop, before the next inversion. The repetition time is given by $$$TR=TI+N\cdot\tau+TD$$$ and the effective inversion time by $$$TI_{\mathrm{eff}}=TI+N\cdot i_c$$$, where $$$i_c$$$ is the $$$i$$$ at which the central k-space line is acquired.The contrast between WM and GM is defined as3$$Con_{i,\mathrm{WM}-\mathrm{GM}}\propto s_{i,\mathrm{WM}}-s_{i,\mathrm{GM}}$$To ensure high signal strength, it is reasonable to optimize the sequence such that as much time as possible is used for sampling. Therefore, $$$s_i$$$ was multiplied by a penalty term $$$\sqrt{t_{\mathrm{ADC}}/\mathrm{TR}}$$$, where $$$t_{\mathrm{ADC}}=N\cdot\tau$$$ is the time during which data is acquired.
Since we aimed for four different resolutions (2mm, 1.6 mm, 1.3mm and 1.1mm isotropic), the simulation was done four times for the according, fixed partition numbers $$$N=\{80,91,112,126\}$$$. Because the contrast is mainly given by the centre of k-space, $$$s_i$$$ was evaluated at $$$i_c = \{40,52,64,72\}$$$ (the highest three resolutions were acquired with 7/8 slice partial Fourier).
The maximum τ was limited by the minimal bandwidth (130 Hz/Px) of the sequence. It depended on the used resolution and was around 11-12ms.
T1 values for GM and WM at 0.55T are reported as $$$T_{1,\mathrm{GM}}=717$$$ms and $$$T_{1,\mathrm{WM}}=493$$$ms5. The computation was done for a range around these reported and our measured values (see below).
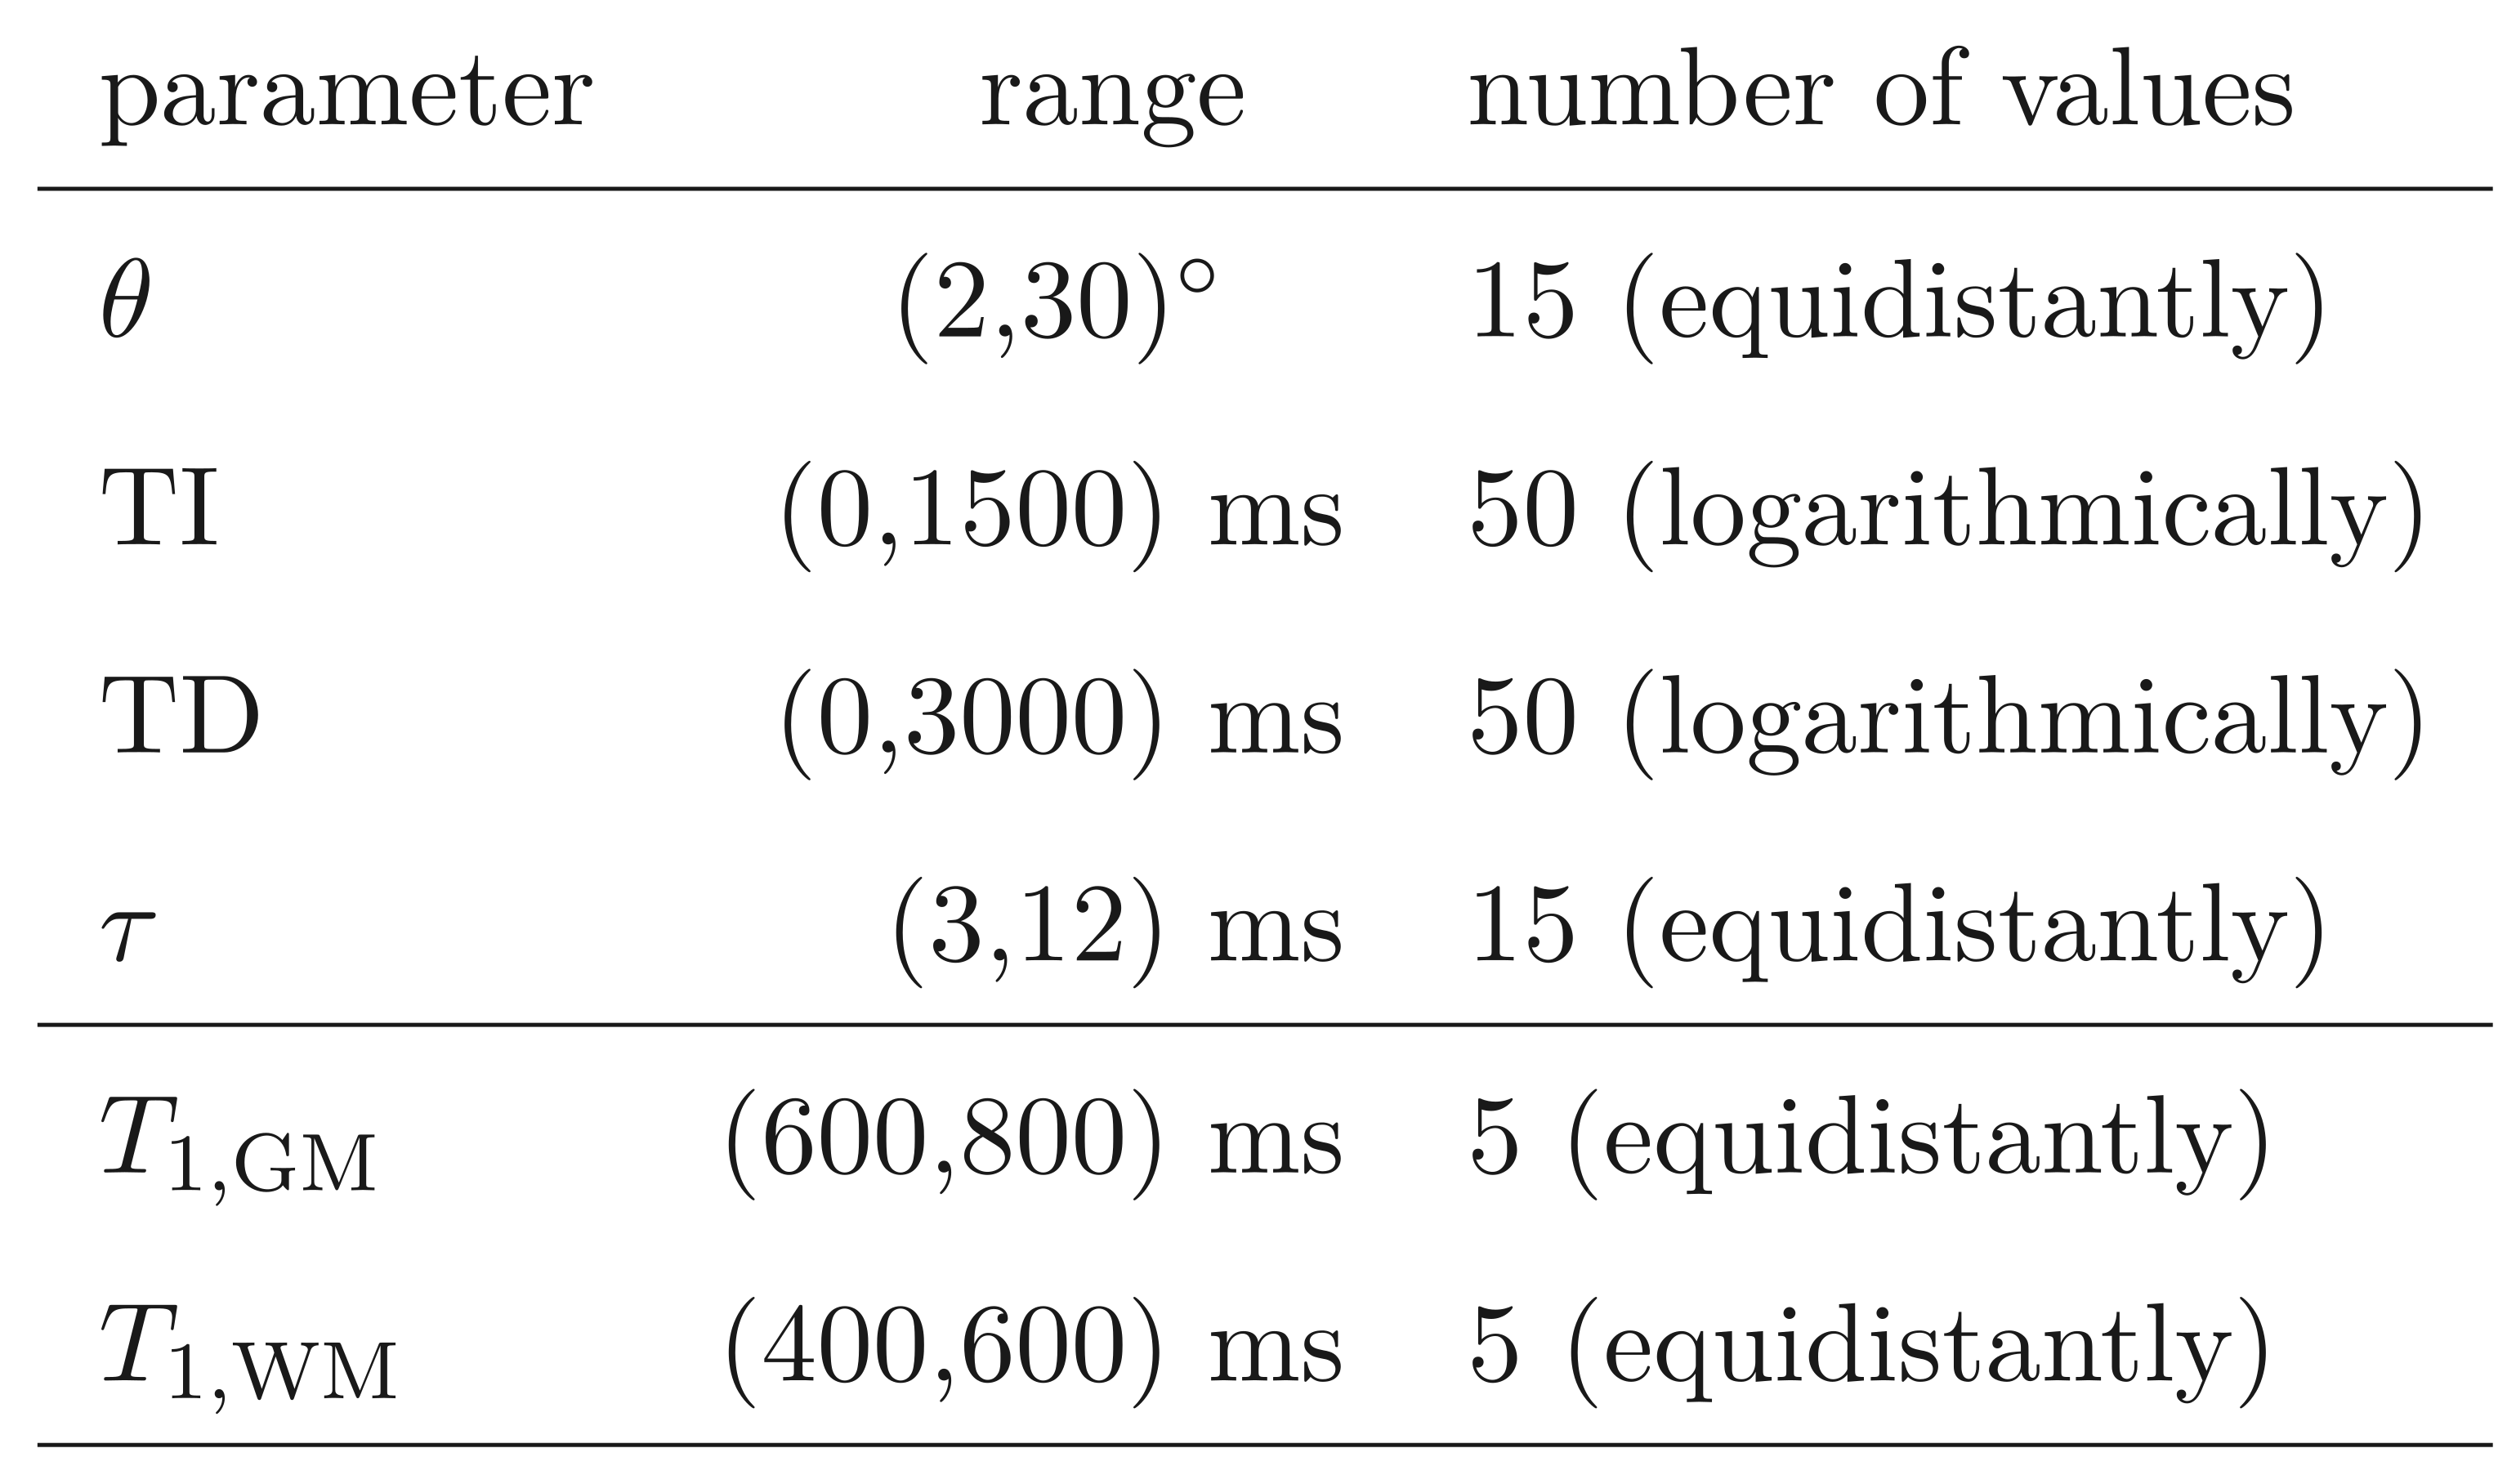
Tab.1 shows the parameter ranges for TI, τ, θ and TD which were used in the simulation and the T1 ranges for GM and WM for which the computation was done.
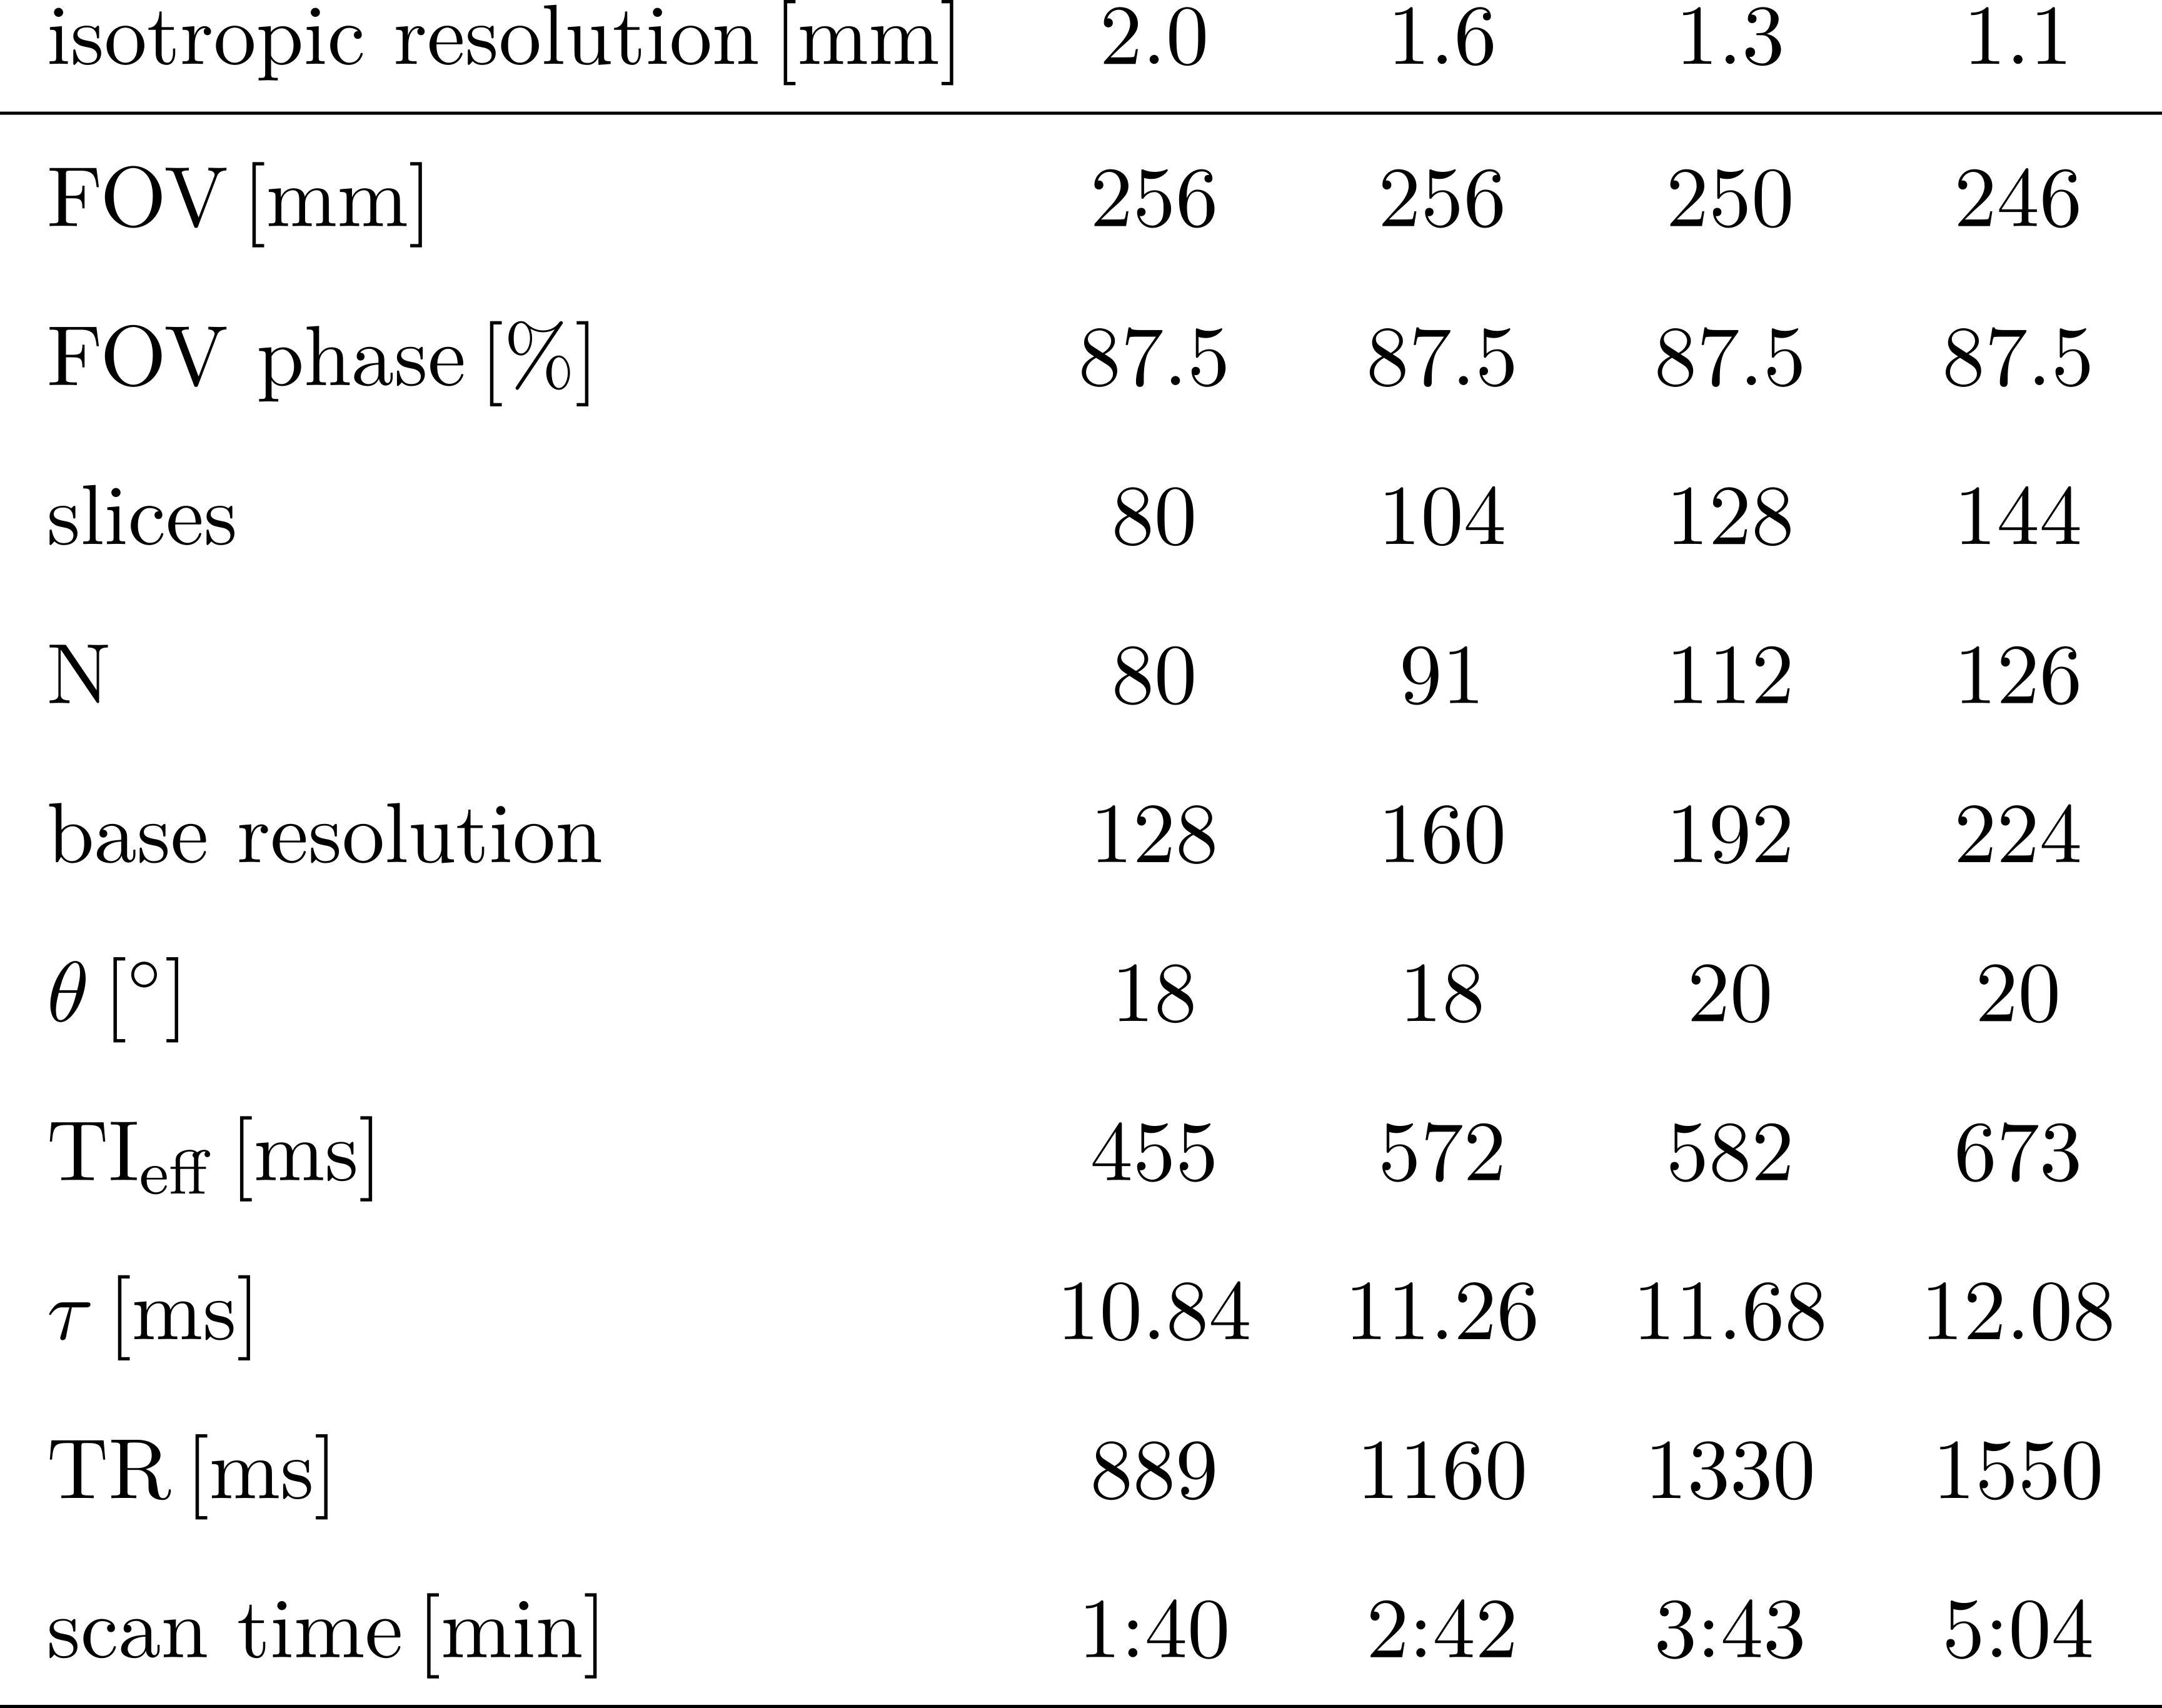
MRI: The obtained parameters were used to set up the MP-RAGE. In vivo brain scans were carried out on a healthy volunteer. Scans were done for 2.0mm, 1.6mm, 1.3mm and 1.1mm isotropic resolution. The highest three resolutions were done with 7/8 slice partial Fourier to reach shorter values for TIeff. All sequence parameters can be seen in Tab.2.
Additionally, a FLASH sequence was run with the same resolutions, TR (equivalent to τ in the MP-RAGE) and scan time. It was acquired with $$$\theta=25^\circ$$$, which showed maximum GM/WM contrast. Since there have not been many reports on tissue relaxation parameters at 0.55T, a T1 quantification was done, using the variable flip angle (VFA) method6, to substantiate the values given by Campbell-Washburn et al.5 For this, the 2.0mm resolution FLASH was additionally carried out with $$$\theta=\{3,12\}^\circ$$$.
Analysis: From the 3° and 12° FLASH, a T1 map was calculated, using the VFA method6.
The FLASH and MP-RAGE data were compared visually. Their contrast-to-noise (CNR) ratio was determined by$$\mathrm{CNR}=\frac{Con_{i,\mathrm{WM}-\mathrm{GM}}}{\sigma}$$where σ is the standard deviation of the noise in a region outside the head.
Results/Discussion
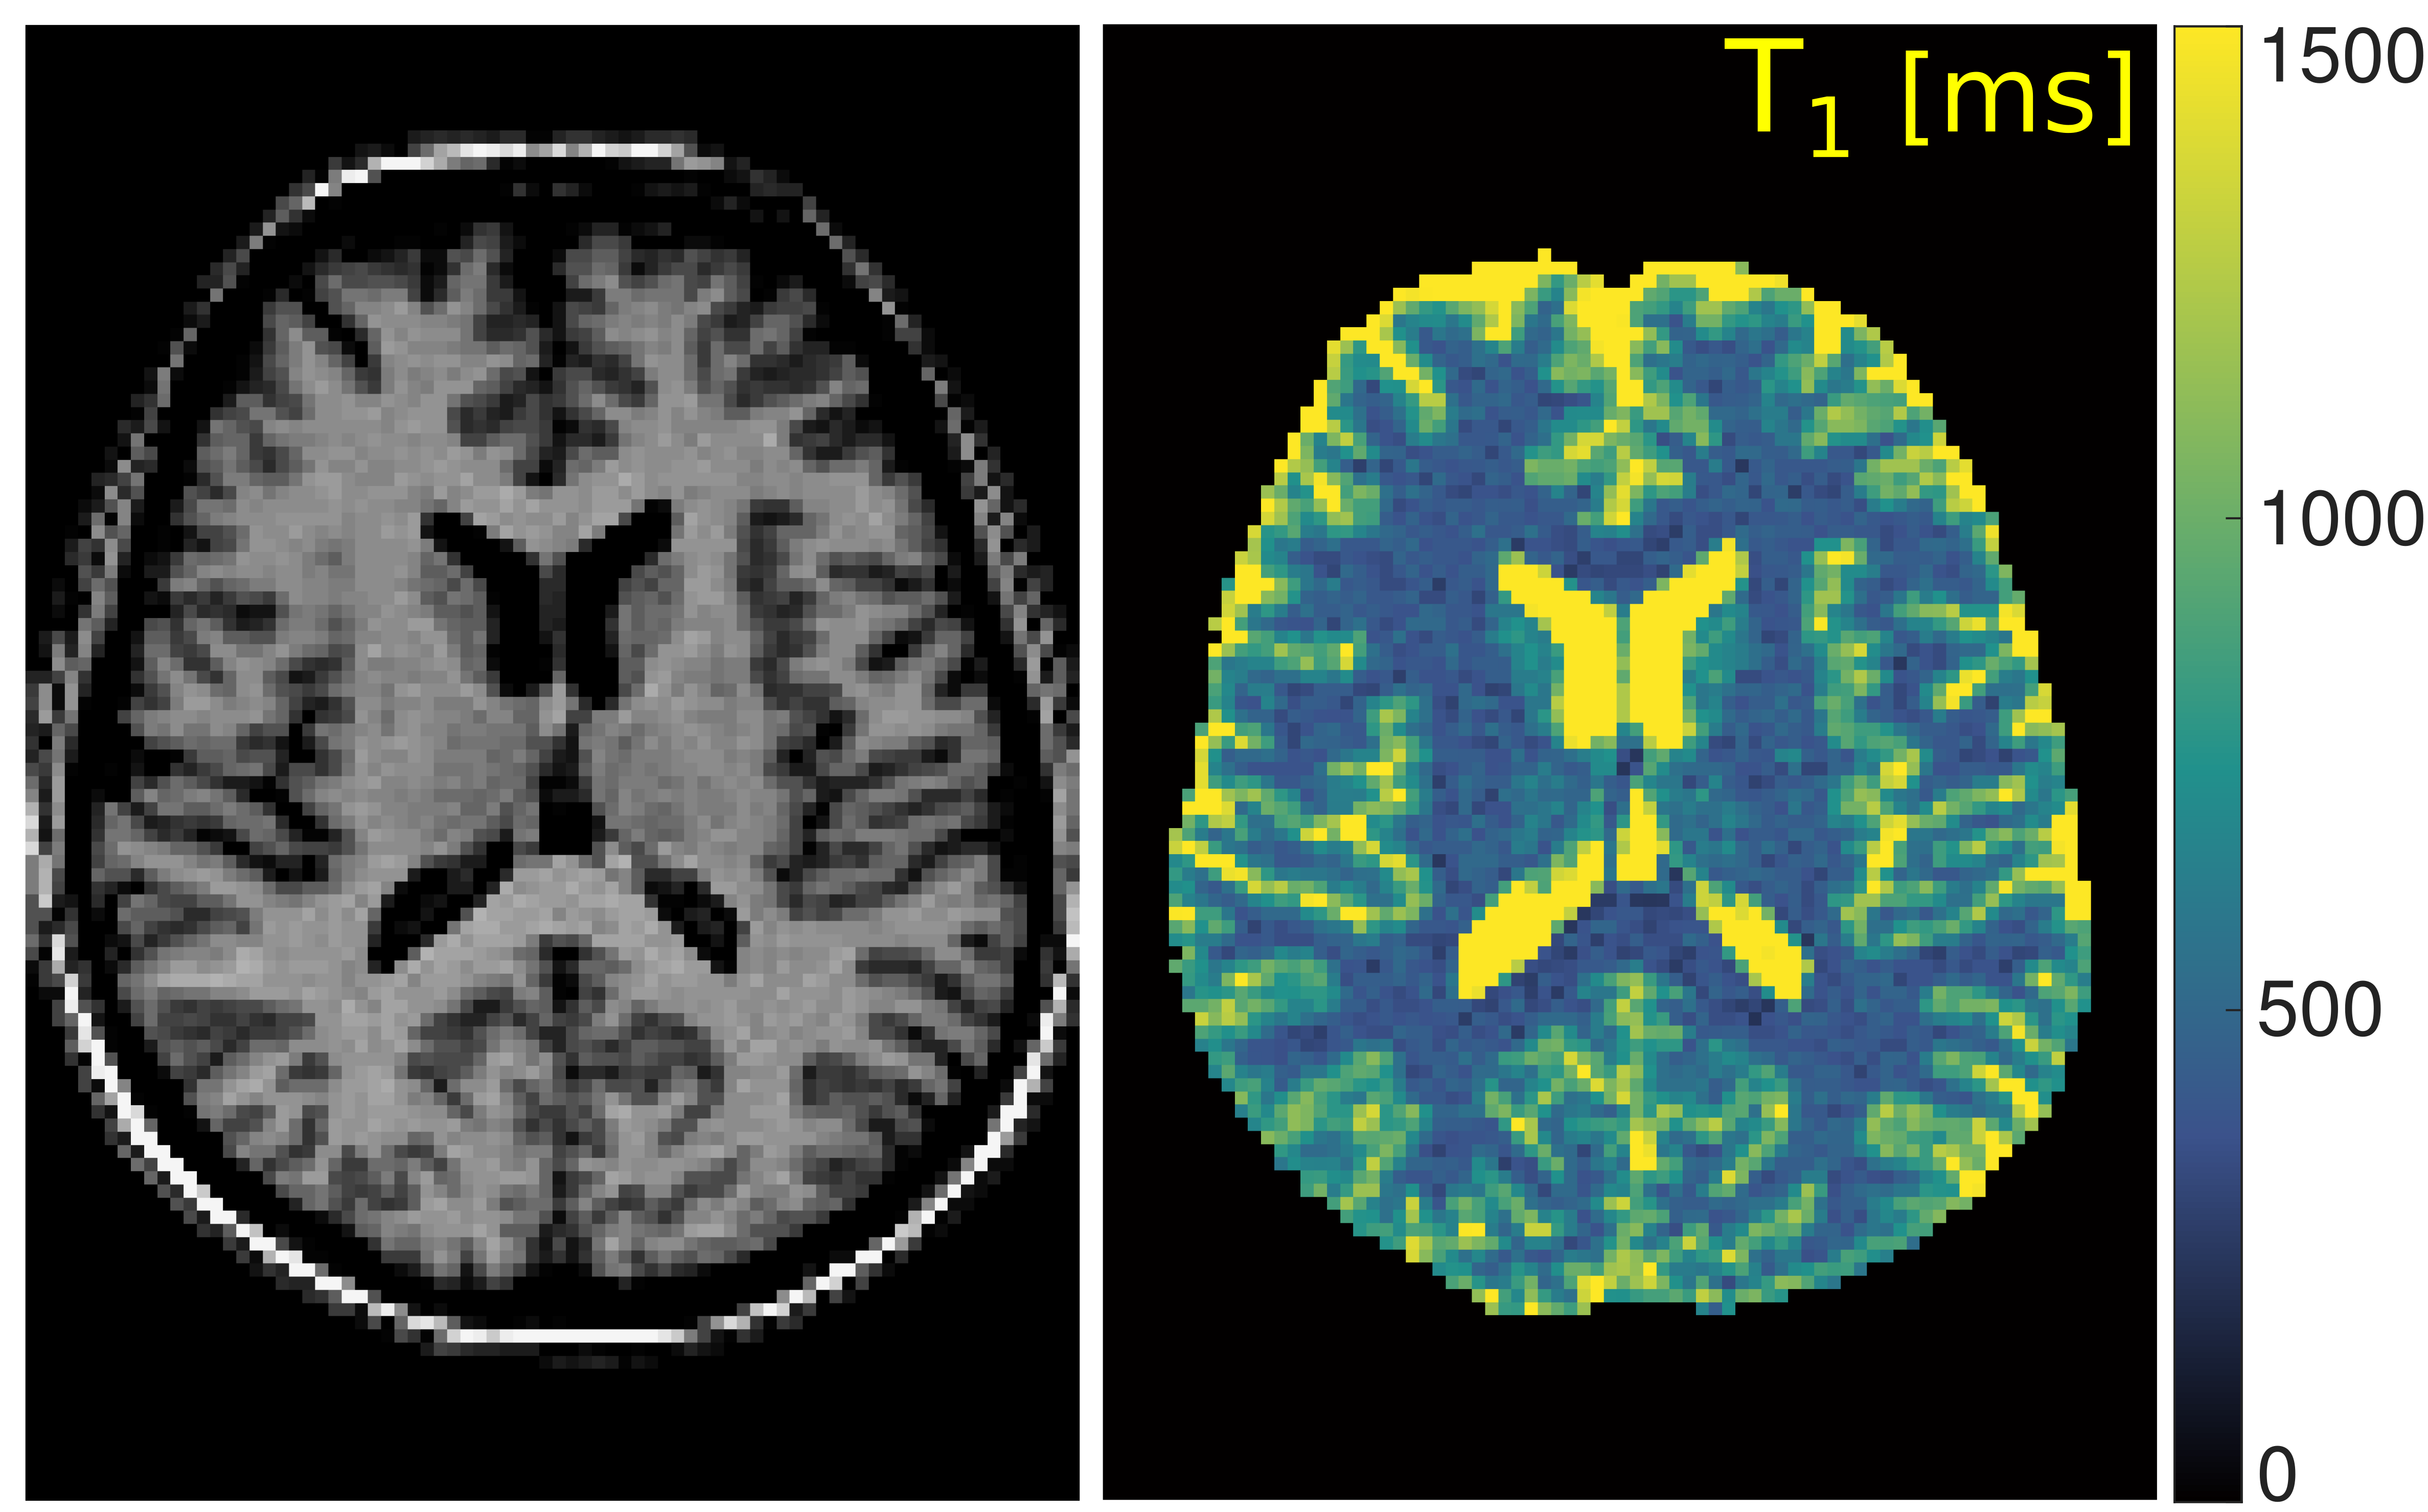
Fig.1 shows the VFA T1 map. The values ($$$T_{1,\mathrm{GM}}=730\pm60$$$ and $$$T_{1,\mathrm{WM}}=430\pm60$$$) coincide with previously reported ones5.The obtained parameters from the computation for θ and τ are included in Tab.2. The optimal τ was always the maximum τ possible. For TI and TD the simulation yielded zero as the best value. The obtained values did not differ much within the used T1 range.
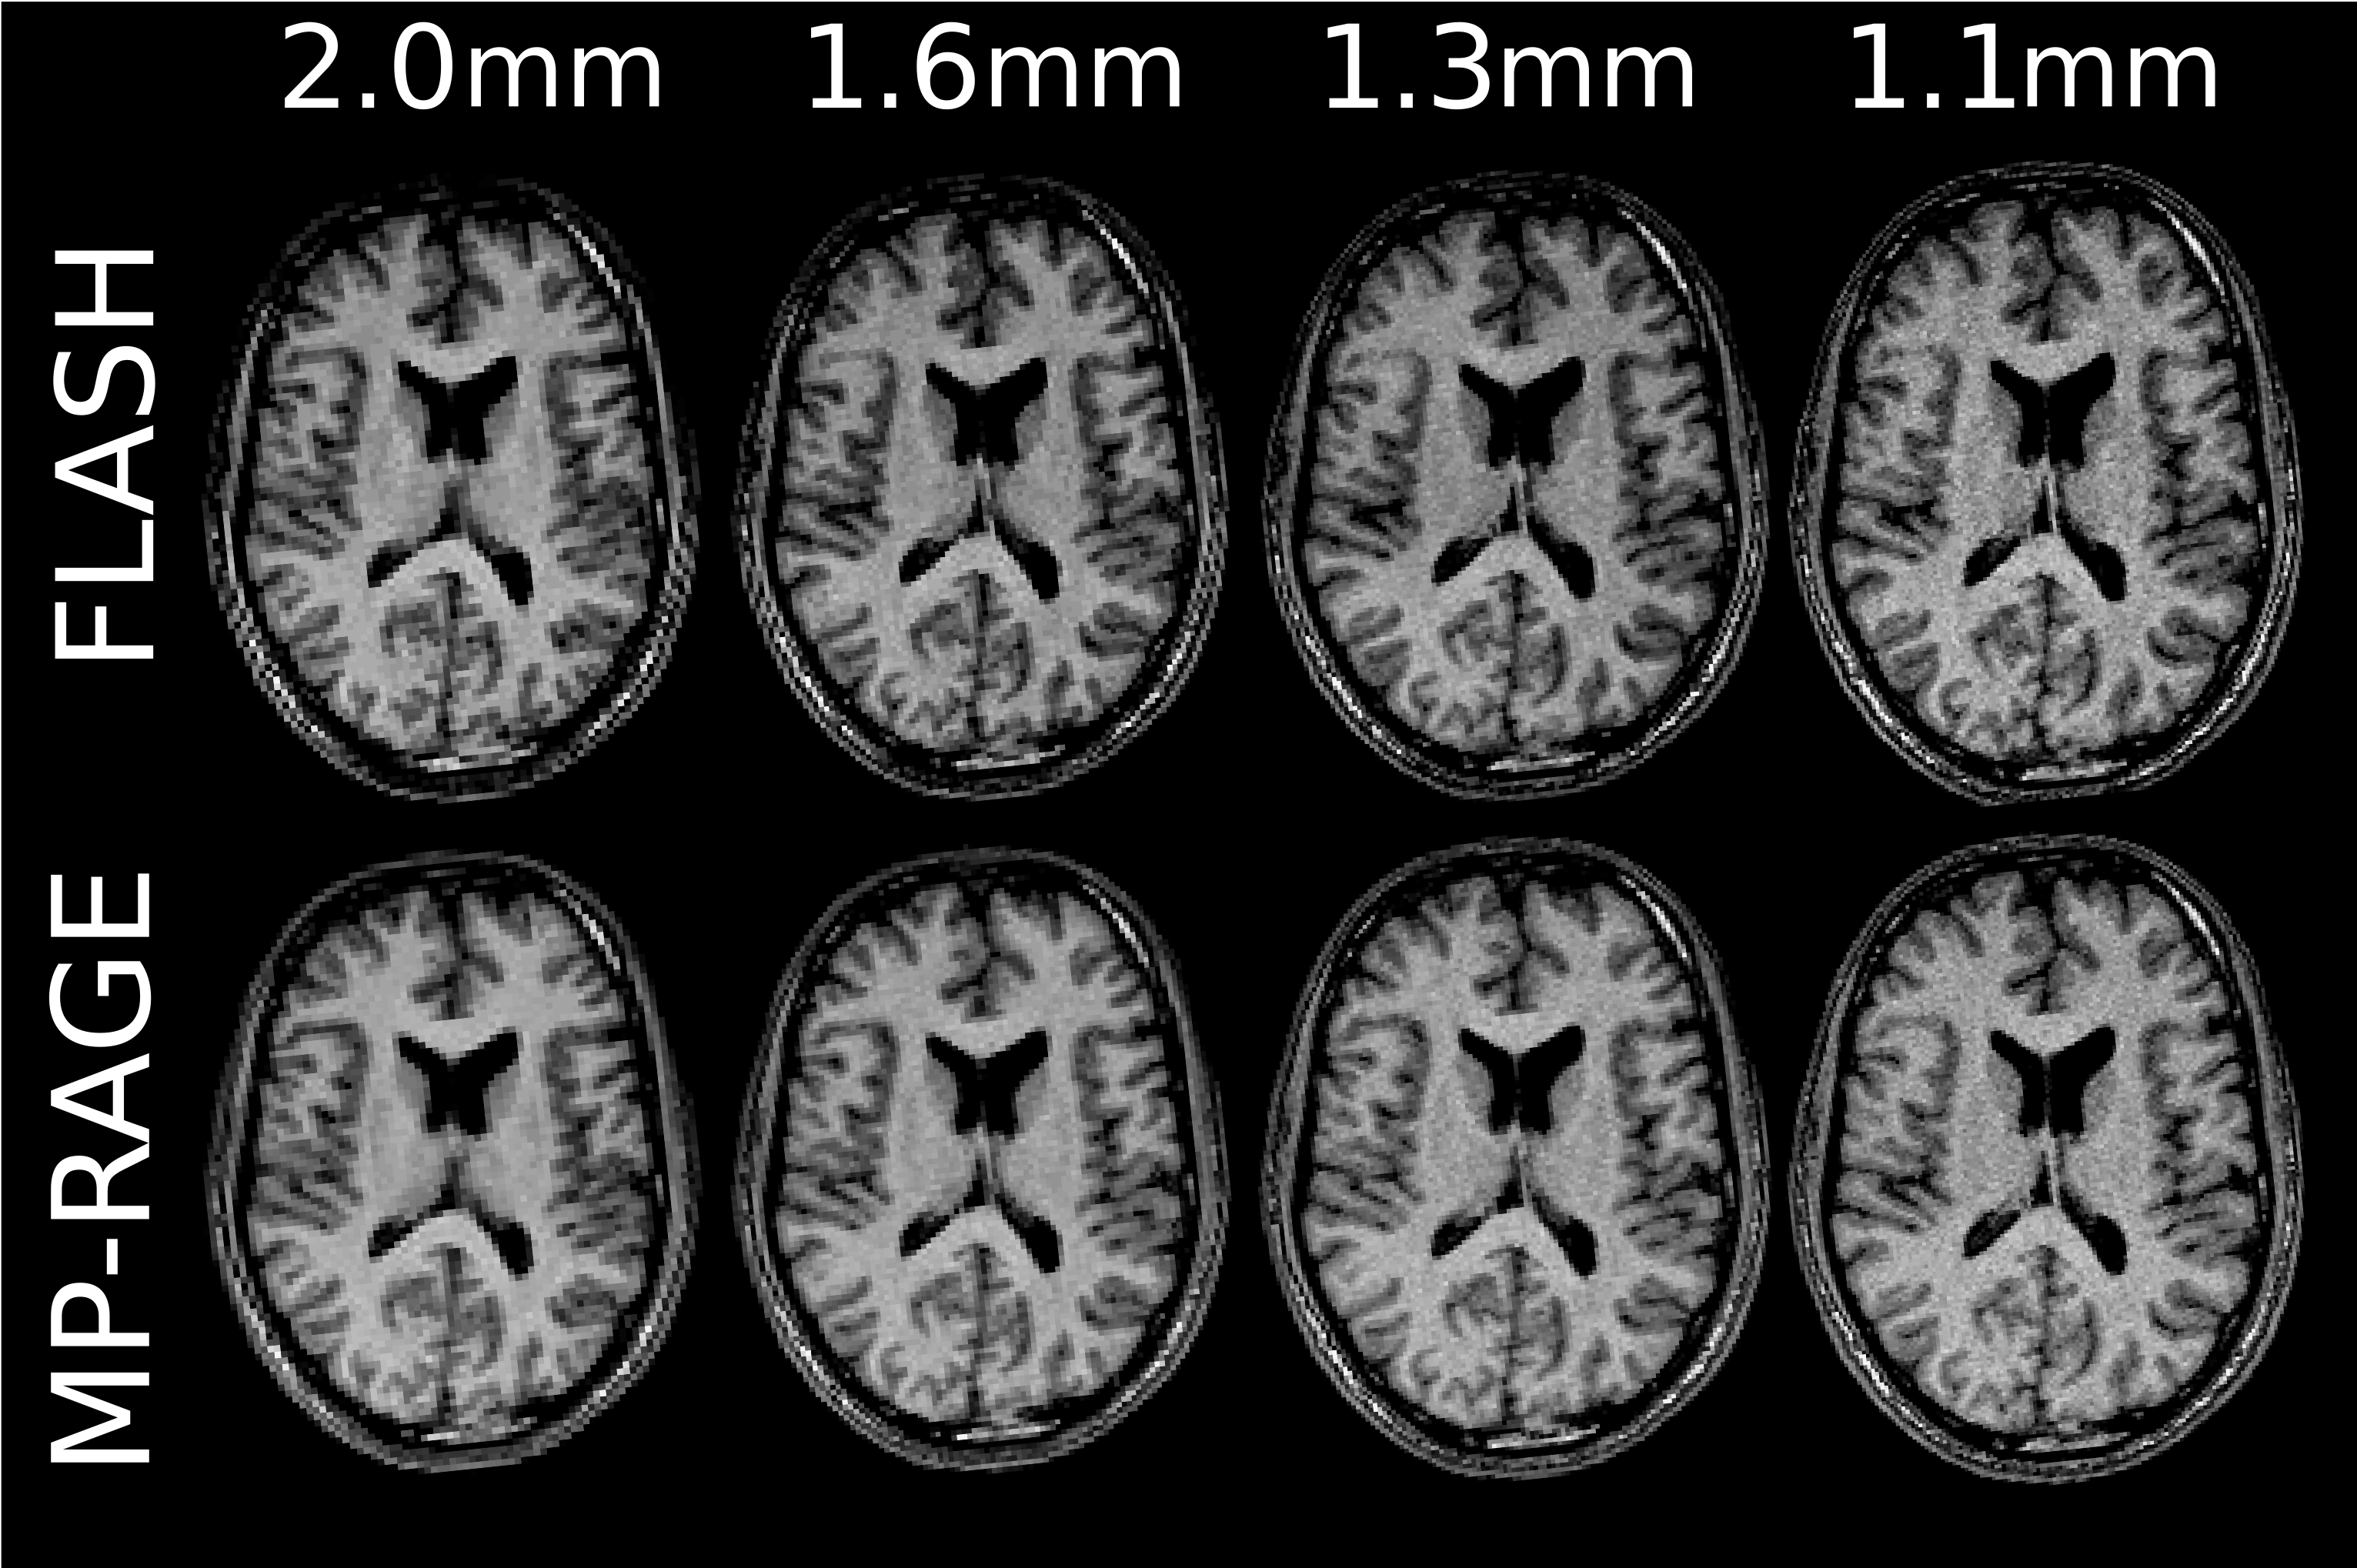
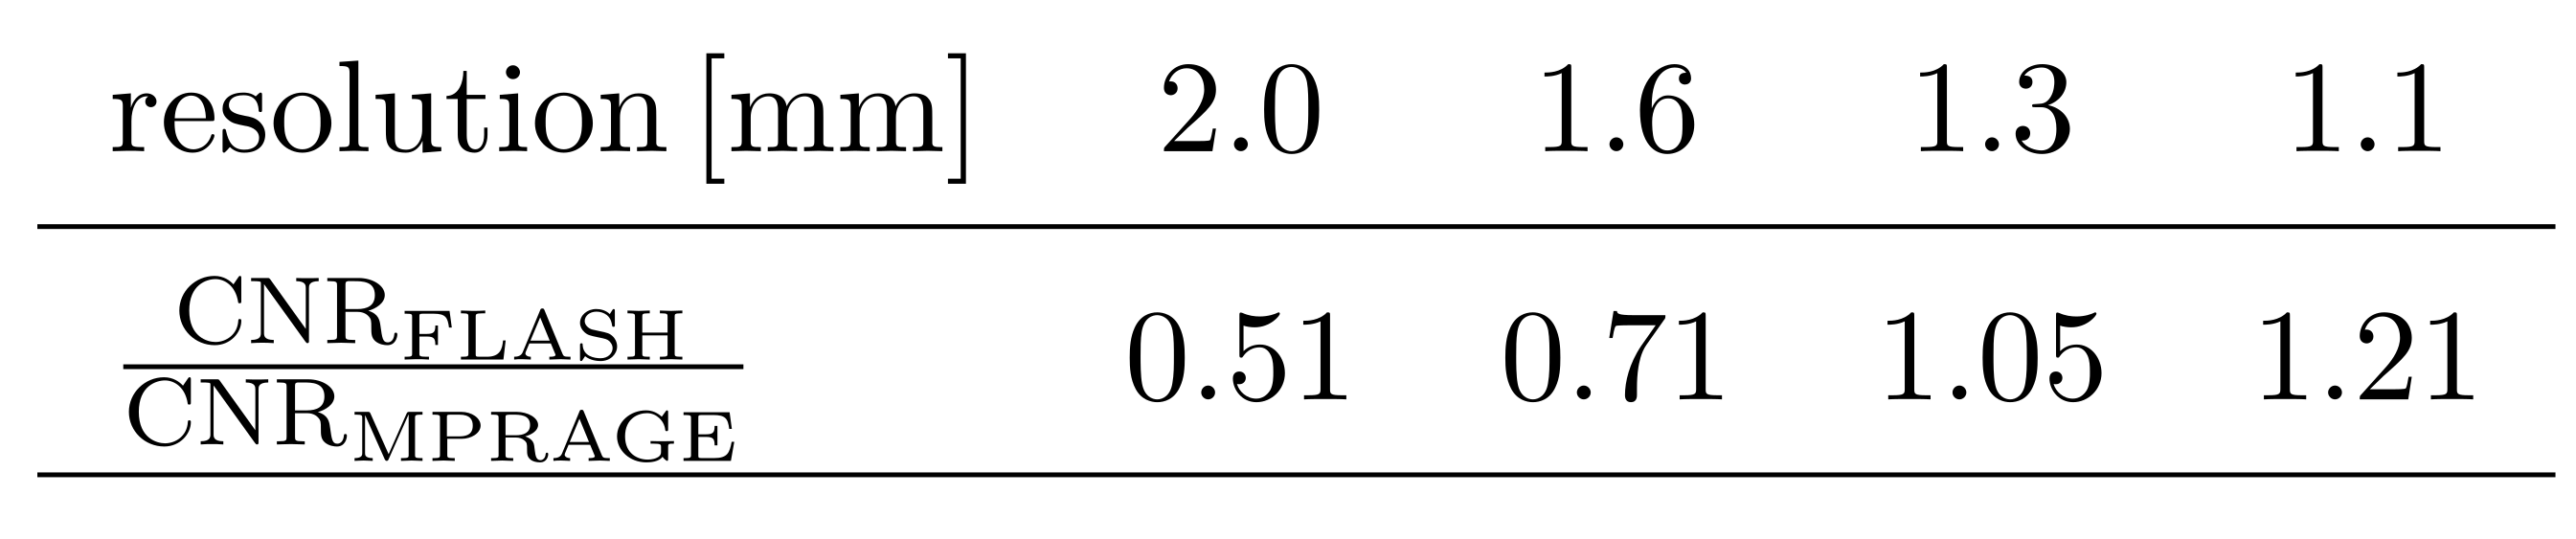
Fig.2 shows the comparison of an axial slice of the FLASH and MP-RAGE for all resolutions. Visually, there is not much difference. This is not too surprising since there have been studies, which showed that the MP-RAGE does not show superior contrast7. As can be seen in Tab.3, the ratio of the CNR for FLASH and MP-RAGE does change in favour of the FLASH towards higher resolutions.
The SNR is decent, even for higher resolution, although an increase in graininess is clearly visible. This seems to be more present in the FLASH but it must be kept in mind that the MP-RAGE is intrinsically filtered due to sampling along the inversion curve. With the current trend towards deep learning (DL) supported imaging, a denoising approach utilizing DL8 could be beneficial in this case.
Conclusion
The MP-RAGE sequence was optimized for 0.55T, using the computation proposed by Wang et al.3. Our preliminary results indicate a clear CNR benefit for MP-RAGE over FLASH at mid/low resolutions but also a trend towards higher CNR for FLASH as compared to MP-RAGE at high resolutions. With good denoising methods a 1.1mm isotropic MP-RAGE could be realized at 0.55T.Acknowledgements
This work was supported by the Swiss National Science Foundation (SNF grant No. 325230_182008).References
1. Mugler III JP, Brookeman JR. Three-dimensional magnetization-prepared rapid gradient-echo imaging (3D MP RAGE). Magn Reson Med, 1990;15:152-157.
2. Kir A, McMillan A. Optimized inversion-prepared gradient echo imaging. Journal of Magnetic Resonance Imaging, 2012;36:748-755.
3. Wang J, He L, Zheng H, Lu ZL. Optimizing the magnetization-prepared rapid gradient-echo (MP-RAGE) sequence. PloS one, 2014;9:e96899.
4. Gowland PA, Leach MO. Fast and accurate measurements of T1 using a multi-readout single inversion-recovery sequence. Magn Reson Med, 1992;26:79-88.
5. Campbell-Washburn AE, Ramasawmy R, Restivo MC et al. Opportunities in interventional and diagnostic imaging by using high-performance low-field-strength MRI. Radiology, 2019;293:384.
6. Deoni SC, Rutt BK, Peters TM. Rapid combined T1 and T2 mapping using gradient recalled acquisition in the steady state. Magn Reson Med, 2003;49:515-526.
7. Runge VM, Kirsch JE, Thomas GS, Mugler III JP. Clinical comparison of three-dimensional MP-RAGE and FLASH techniques for MR imaging of the head. Journal of Magnetic Resonance Imaging, 1991;1:493-500.
8. Moreno López, M, Frederick JM, Ventura J. Evaluation of MRI Denoising Methods Using Unsupervised Learning. Front Artif Intell, 2021:4;75.
Figures