1765
Muscle volumetry from low-field scans and its relation to performance in physical activities1Institute for Instrumentation in Molecular Imaging (i3M), CSIC, Valencia, Spain, 2Institute for Instrumentation in Molecular Imaging (i3M), Universitat Politècnica de València, Valencia, Spain, 3Tesoro Imaging SL, Valencia, Spain, 4Educación Física y Deportiva, Universitàt de València, Valencia, Spain, 5Physio MRI SL, Valencia, Spain
Synopsis
Keywords: Low-Field MRI, Low-Field MRI, Sport MRI
Here we show the results of the first systematic study performed in our low-field 72 mT MRI scanner. Calf images were acquired from 35 volunteers whose performance was measured during different physical activities before the scan. We segmented the images to determine the cross-sectional area and volume of the gastrocnemius muscles and correlated the results with the muscular activity measurements of the volunteers. We found that the medial gastrocnemius muscle volume correlates significantly with participants weight and unilateral jump capacity.Introduction
Low-field scanners can be light, low-cost and with small footprint [1], [2], opening a new window of opportunities that enable studies rarely carried out at high-field systems because of their scarce availability. In this sense, low-field MRI scanners represent a potential complement to high-field systems. We present the first systematic study carried out with our low-field 72 mT “Physio MRI” scanner. This has been previously used to demonstrate its high portability, acquiring images indoors, outdoors and at patient’s home [3], [4]. Here we show the preliminary results of image segmentation to show the relation between muscle volume and the results of sport performance tests on 35 volunteers.Methods
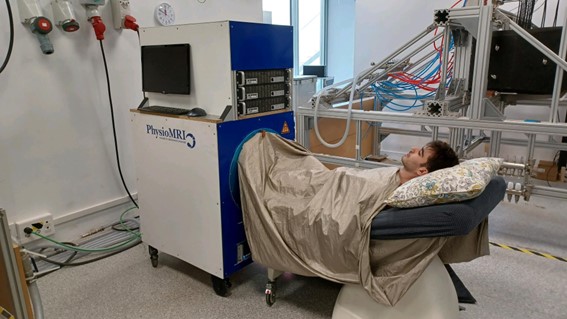
The study involved a total of 35 participants (mean (SD) age of 24.8 (4.3) years; weight of 69.2 (11.2) kg and height of 1.74 (0.1) m). Performance measurements of common explosive exercises such as counter movement and horizontal jumps were performed uni and bi-laterally. After the tests, we acquired axial images from their calves.We employed the “Physio MRI” scanner (Fig.1, [3]). This operates with a Halbach array of more than 5,000 NdFeB magnets, providing ~72 mT over a spherical region of 200 mm in diameter with homogeneity of 3,000 ppm. The system is equipped with a gradient stack capable of reaching strengths > 24 mT/m along any spatial direction. Field homogeneity can be actively shimmed with the gradients to reduce the homogeneity down to 75 ppm in a spherical volume of 100 mm in diameter. The scanner uses one of two RF solenoid coils, a small one with 15 cm diameter, 15 cm length and Q = 120 and a larger one, with 20 cm diameter, 22 cm length and Q = 67. We control the scanner with MaRCoS [4], a Red Pitaya based system (Fig. 1(g)) controlling a custom gradient driver board.
To acquire the images, we used RARE sequences. We excite with pi/2-pulses of 35 µs and refocus with pi-pulses of 70 µs. The phase cycling of the refocusing pulses follows a Carr-Purcell-Meiboom-Gill modulation. We acquired proton density weighted axial images with TR = 750 ms, echo spacing 20 ms, echo train length 5, effective echo time 20 ms, matrix size 140x120x24, and acquisition bandwidth 35 kHz. To improve the signal-to-noise ratio we averaged acquisitions for a total scan time of 15 minutes.
We filtered the acquired images with a block match 4D (BM4D) filter and saved then in NiFTI format. ITK-SNAP [5] was used for image segmentation, and matlab to obtain the cross-section areas and volumes of the muscles.
Results
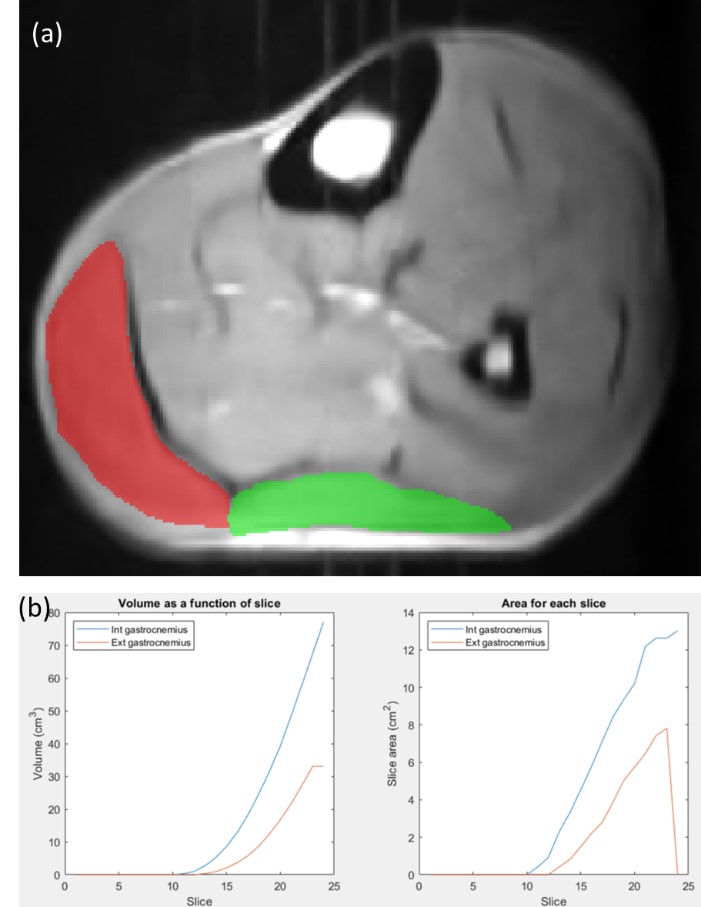
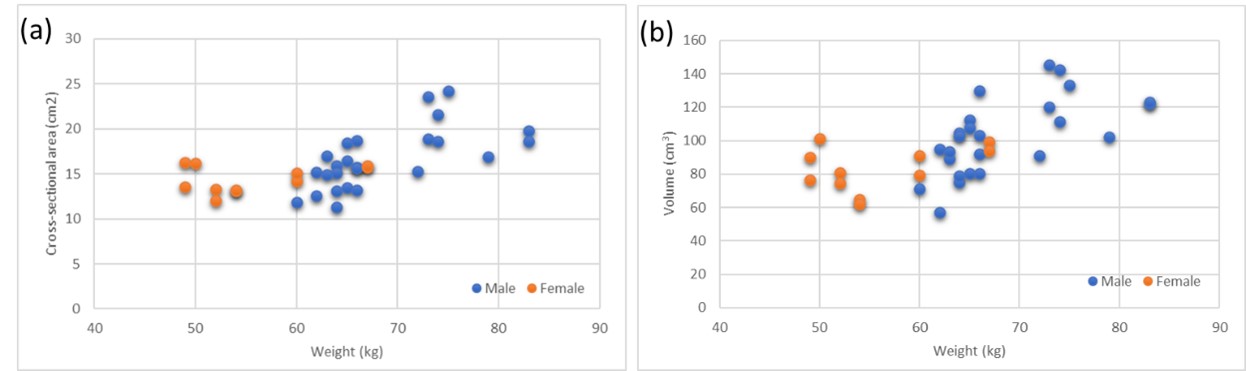
Figure 2.a shows a representative example corresponding to one of the volunteers. The image includes the segmentation of the lateral (red) and the medial (green) gastrocnemius muscle for one of the transversal slices of the 3D image. Making use of this segmentation for all the slices we could obtain the slice cross-sectional area as well as the muscle volume. Figure 2.b shows the volume (left) and area (right) as a function of the slice for this representative volunteer.Figure 3 shows the cross-sectional area (a) and the volume (b) of the medial gastrocnemius obtained from different images as a function of the weight of the volunteer. Cross-sectional area is obtained for the slice with the larger area of the medial gastrocnemius. To calculate the volume, we take as a reference the slice with the larger cross-sectional area of the medial gastrocnemius, then we measure the volume from this slice to 7.5 cm distal. We observe that there is a correlation between the volunteer weight and the area (volume) with a Pearson correlation coefficient of 0.626 (0.657). Also, a preliminary analysis of the results indicates a negative correlation between the volume of the medial gastrocnemius of the left leg with the unilateral right and left counter movement jump height (r= -0.502 and r= -0.409, respectively). The statistical significance was set at p<0.05.
Discussion/Conclusion
In this work, we studied systematically calf images acquired with our portable, low-cost and low-field “Physio MRI” scanner. A first analysis of the results indicates significant correlation between the weight and volume of the medial gastrocnemius, as well as with the cross-sectional area of the muscle. Furthermore, a preliminary analysis shows correlation between unilateral right and left counter movement jump height and the volume of the medial gastrocnemius.Acknowledgements
We acknowledge all anonymous volunteers for their participation. This work was supported by the Ministerio de Ciencia e Innovación of Spain (PID2019-111436RBC21), the European Union (IDIFEDER/2021/004), Generalitat Valenciana (CIPROM/2021/003) and Agència Valenciana de la Innovació (INNVA1/2022/4).References
[1] J. P. Marques, F. F. J. Simonis, and A. G. Webb, “Low‐field MRI: An MR physics perspective,” J. Magn. Reson. Imaging, vol. 49, no. 6, pp. 1528–1542, Jun. 2019, doi: 10.1002/jmri.26637.
[2] M. Sarracanie and N. Salameh, “Low-Field MRI: How Low Can We Go? A Fresh View on an Old Debate,” Front. Phys., vol. 8, no. June, pp. 1–14, 2020, doi: 10.3389/fphy.2020.00172.
[3] T. Guallart-Naval et al., “Portable magnetic resonance imaging of patients indoors, outdoors and at home,” Sci. Rep., vol. 12, 2022, doi: 10.1038/s41598-022-17472-w.
[4] T. Guallart‐Naval et al., “Benchmarking the performance of a low‐cost magnetic resonance control system at multiple sites in the open MaRCoS community,” NMR Biomed., no. March, pp. 1–13, 2022, doi: 10.1002/nbm.4825.
[5] P. A. Yushkevich et al., “User-guided 3D active contour segmentation of anatomical structures: Significantly improved efficiency and reliability,” Neuroimage, vol. 31, no. 3, pp. 1116–1128, 2006, doi: 10.1016/j.neuroimage.2006.01.015.
Figures