1763
Abdominal MRI at 0.55 T: Initial evaluation and optimization in healthy subjects1Radiology, University of Michigan, Ann Arbor, MI, United States, 2University of michigan, Ann arbor, MI, United States, 3Radiology, University of michigan, Ann arbor, MI, United States, 4University of Michigan, Ann arbor, MI, United States
Synopsis
Keywords: Low-Field MRI, Body, Abdomen
Abdominal MRI including MRCP was performed in 15 healthy subjects on both a 0.55T and a 1.5T MR system. Image quality (IQ) was rated by two radiologists (22 and 17 yrs experience). All sequences were rated acceptable at 0.55T. In comparison to 1.5T, IQ scores at 0.55T were higher for DWI and 3D MRCP, and lower for the other sequences. Acquisition times were longer at 0.55T for all sequences except 3D MRCP. Thus, acceptable quality abdominal images can be obtained on a commercial 0.55T system with slightly lower IQ ratings of some of the sequences compared to 1.5T.Introduction
Low-field magnetic resonance imaging (MRI) systems (B0=0.55T) for whole body imaging have recently become commercially available. These systems may suffer from reduced signal-to-noise ratio (SNR), which can limit spatial resolution and require longer scan times1. Despite this obstacle, recent studies have shown the feasibility of performing lung2,3, cardiac4,5, brain6, and abdominal7 imaging on low field systems. The purpose of this study is to compare the quality of abdominal MRI images acquired on a commercial 0.55T scanner with images acquired at 1.5T, in the same cohort of healthy subjects, and determine which sequences may be routinely deployed for abdominal imaging, and which sequences if any could benefit from optimization at 0.55T prior to initiation of clinical studies.Materials and Methods
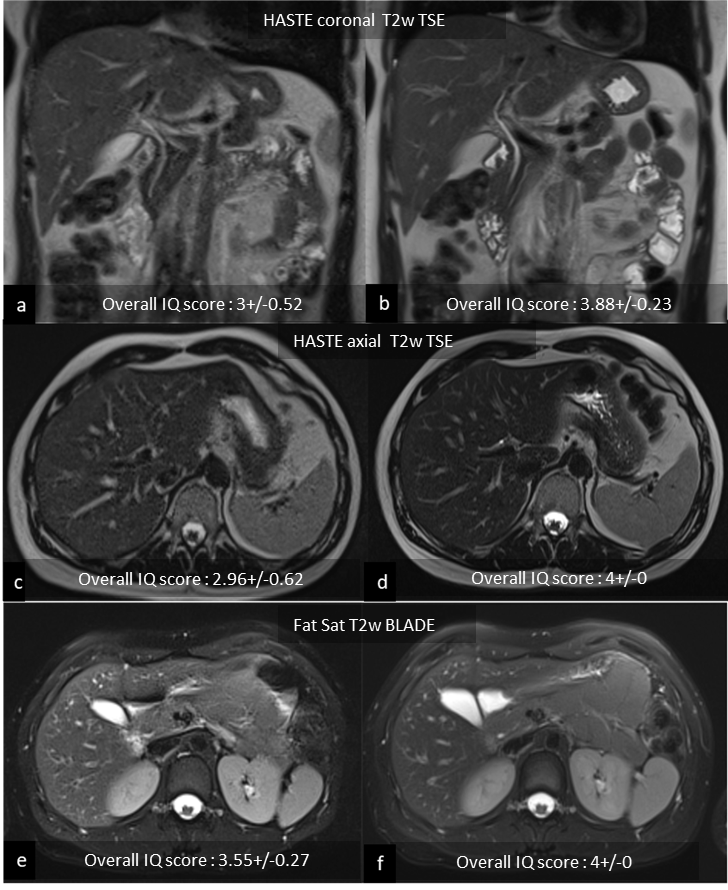
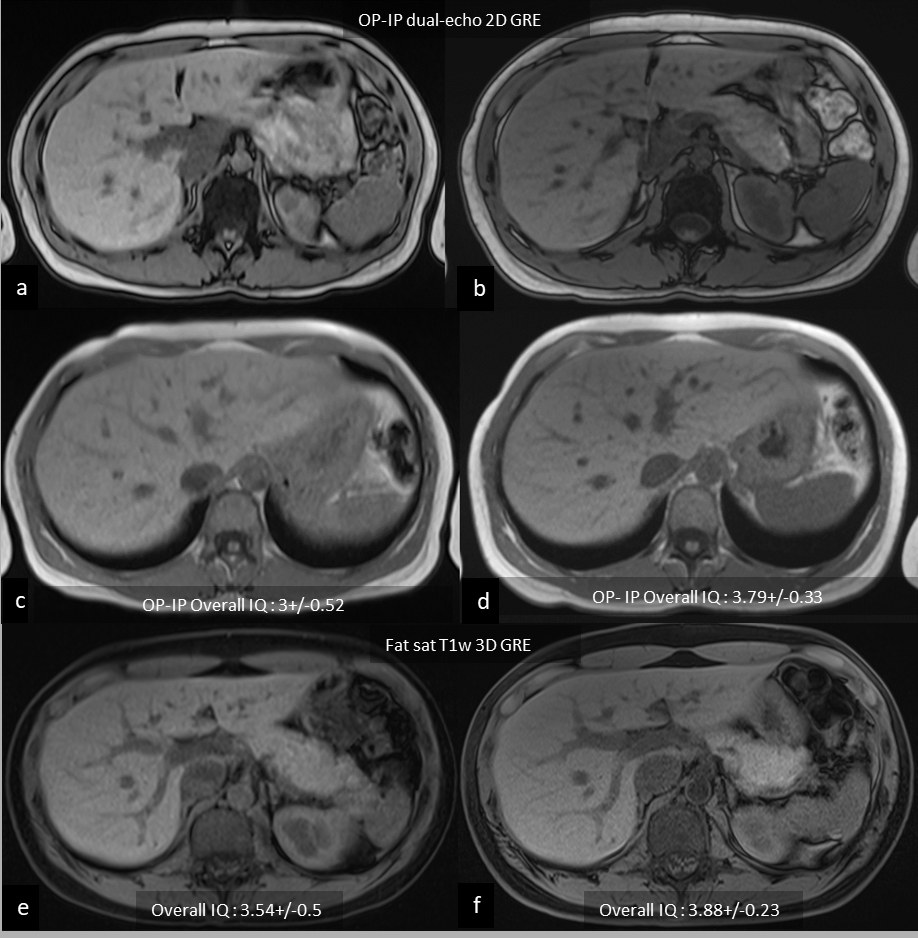
In this prospective IRB approved study, non-contrast MR imaging of the abdomen was performed in 15 healthy subjects (M:F 7:8; mean age: 37±17 yrs; range: 19-75 yrs) on both 0.55T (MAGNETOM Free.Max) and 1.5T (MAGNETOM Sola) MR systems (Siemens Healthineers, Erlangen, Germany). The protocol on both scanners included the following sequences: coronal and axial T2w HASTE, fat sat T2w BLADE, DW SS-EPI (b50 and 800), OP-IP dual-echo 2D GRE, fat sat T1w 3D GRE and respiratory triggered coronal T2w 3D TSE MRCP. Optimized sequence parameters used in this study are shown in Figure 1.Images were independently rated by two radiologists with 22- and 17-years’ experience in body MRI on a 4-point Likert scale (1: poor, 2: fair, 3: good, 4: excellent) for the following features: signal-to-noise ratio (SNR), edge definition of organs (liver, spleen, pancreas, adrenals, and kidneys), delineation of hepatic veins, artifacts, and overall image quality (IQ). MRCP images were rated for delineation of biliary and pancreatic ducts, background suppression and overall IQ. Scores of ≥2 were considered acceptable. Scan times were documented. Paired Wilcoxon sign rank test was used to test for differences between ratings. Interrater reliability (IRR) was assessed using percentage of times both readers provided concordant results for the same sequence.
Results and Discussion
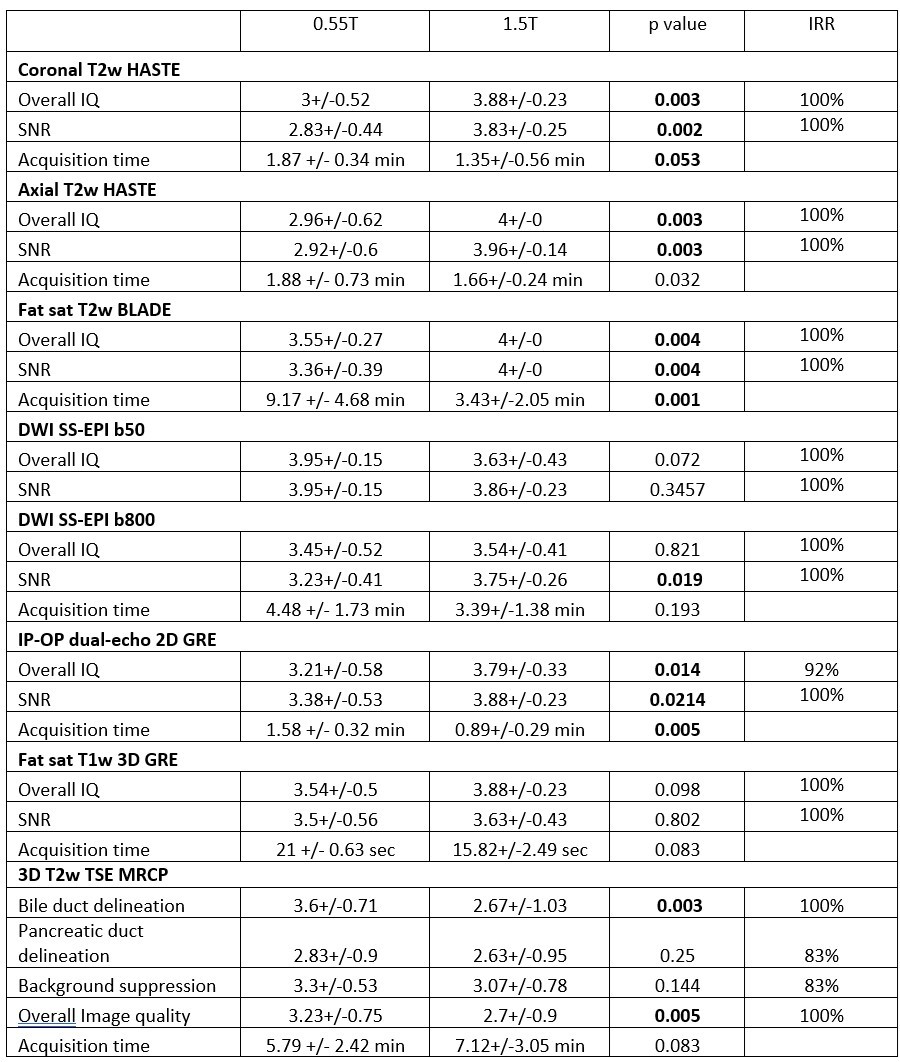
A total of 240 sequences (15 exams with 8 sequences in each at 0.55T and 1.5T) were assessed. Representative images from each sequence are shown in Figures 2 and 3. IQ scores are summarized in Figure 4.Overall IQ and SNR at 0.55T:
Compared to 1.5T, statistically significantly lower IQ and SNR scores were assigned to coronal and axial T2w HASTE, fat sat T2w BLADE, and IP-OP dual-echo 2D GRE sequences; non-statistically significantly lower IQ and SNR scores were assigned to fat sat T1w 3D GRE; and non-statistically significantly higher IQ and SNR scores for DWI b50. Non statistically significantly higher IQ scores and statistically significantly lower SNR scores were assigned to DWI b800.
Sharpness of organ edges and hepatic veins at 0.55T:
Edge definition of abdominal organs and hepatic veins was used as an indication of spatial resolution. Compared to 1.5T, statistically significantly lower scores for edge sharpness were assigned to all organs on coronal and axial T2w HASTE and IP-OP dual-echo 2D GRE, and to pancreas only on DWI b800; non statistically significantly lower scores were assigned to all organs on fat sat T2w BLADE and fat sat T1w 3D GRE, to hepatic veins on DWI b50, and to adrenals, kidneys and hepatic veins on DWI B800; non statistically significantly higher scores were assigned to all organs on DWI b50; and equal scores given to spleen on DWI b800.
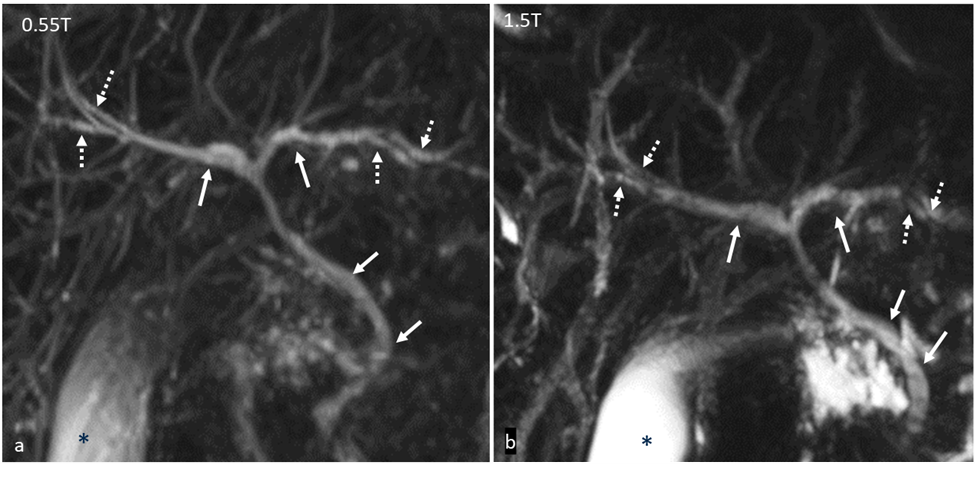
For 3D MRCP, higher scores were assigned to all IQ parameters with statistically significant difference for bile duct delineation and overall IQ (Figure 4). In our study, the signal from second order biliary radicals was found to be higher at 0.55T, compared to 1.5T (Figure 5)
Artifacts at 0.55T:
The artifacts encountered on images collected at 0.55T were central noise enhancement (n=12) and residual aliasing (n=4) related to parallel imaging, failure of fat suppression at air tissue interface (n=15), signal drop off in left lobe of liver due to cardiac motion (n=6), susceptibility artifacts from bowel gas (n=2), and respiratory motion (n=3). Artifacts on DWI were more conspicuous at 1.5T and included geometric distortion in the phase encoding direction and signal pile up at air tissue interfaces, both attributed to magnetic susceptibility effects.
Acquisition times at 0.55T:
Compared to 1.5T, acquisition times were longer for all sequences (Figure 4) except for respiratory triggered coronal T2w 3D TSE MRCP. The largest increase in acquisition time was for fat sat T2w BLADE.
Conclusion
Acceptable quality abdominal MR images can be obtained in healthy subjects at 0.55T with longer overall acquisition time compared to 1.5T. While a few sequences including 3D MRCP and DWI had higher image quality ratings at 0.55T compared to 1.5T, most sequences were rated lower at 0.55T, although with overall acceptable image quality ratings for all the sequences. Further work is needed to assess contrast-enhanced sequences, explore the suitability of the 0.55T system for specific patient populations, and determine the effect of reader experience on ratings.Acknowledgements
Siemens Healthineers for Research Grant supportReferences
1. Smith HJ. The history of magnetic resonance imaging and its reflections in Acta Radiologica. Acta Radiol. 2021 Nov;62(11):1481–98.
2. Campbell-Washburn AE, Malayeri AA, Jones EC, Moss J, Fennelly KP, Olivier KN, et al. T2-weighted Lung Imaging Using a 0.55-T MRI System. Radiol Cardiothorac Imaging. 2021 Jun 1;3(3):e200611.
3. Campbell-Washburn AE, Ramasawmy R, Restivo MC, Bhattacharya I, Basar B, Herzka DA, et al. Opportunities in Interventional and Diagnostic Imaging by Using High-Performance Low-Field-Strength MRI. Radiology. 2019 Nov;293(2):384–93.
4. Bandettini WP, Shanbhag SM, Mancini C, McGuirt DR, Kellman P, Xue H, et al. A comparison of cine CMR imaging at 0.55 T and 1.5 T. J Cardiovasc Magn Reson Off J Soc Cardiovasc Magn Reson. 2020 May 18;22(1):37.
5. Kolandaivelu A, Bruce CG, Ramasawmy R, Yildirim DK, O’Brien KJ, Schenke WH, et al. Native contrast visualization and tissue characterization of myocardial radiofrequency ablation and acetic acid chemoablation lesions at 0.55 T. J Cardiovasc Magn Reson Off J Soc Cardiovasc Magn Reson. 2021 May 6;23(1):50.
6. Rusche T, Breit HC, Bach M, Wasserthal J, Gehweiler J, Manneck S, et al. Potential of Stroke Imaging Using a New Prototype of Low-Field MRI: A Prospective Direct 0.55 T/1.5 T Scanner Comparison. J Clin Med. 2022 May 16;11(10):2798.
7. Chandarana H, Bagga B, Huang C, Dane B, Petrocelli R, Bruno M, et al. Diagnostic abdominal MR imaging on a prototype low-field 0.55 T scanner operating at two different gradient strengths. Abdom Radiol N Y. 2021 Dec;46(12):5772–80.
Figures