1760
A SNR and contrast comparison study at 0.11T, 0.25T, 1.5T and 3T MRI systems1School of Biomedical Engineering, Shanghai Jiao Tong University, Shanghai Jiao Tong University, Shanghai, China
Synopsis
Keywords: Low-Field MRI, Low-Field MRI
Low-field MRI systems have seen a renaissance recently due to improvements in technology and its low costs. However, properties like SNR, T1 and T2 values of low fields have caused a lot of concern because they always change with field strengths. This study conducted the SNR comparison based on phantom and fitted the quantitative mapping of human brains at 0.11T, 0.25T, 1.5T and 3T to design a set of protocols enabling similar contrasts of the typical clinical images at different fields. The impacts of lowered magnetic field strengths on imaging quality were shown in this study.Introduction
Low-field MRI systems have seen a renaissance recently[1, 2] due to improvements in technology both in hardware and software[3] as well as their low costs[4, 5]. The decrease of the magnetic field strength can provide advantages such as slower decay rate due to longer T2, the reduced SAR and more economic magnets[1, 6], while properties like signal-to-noise ratio (SNR), T1 and T2 values of low fields have caused a lot of concern because they’re different at different fields. This study conducted the SNR comparison based on phantom and fitted the quantitative mapping of human brains at 0.11T, 0.25T, 1.5T and 3T MRI, according to which a set of protocols was optimized to obtain the similar clinical contrasts of the human brain to showcase the potential impact of altered magnetic field properties on imaging quality, image contrast and quantitative parameters between 0.11T, 0.25T, 1.5T and 3T MRI.Methods
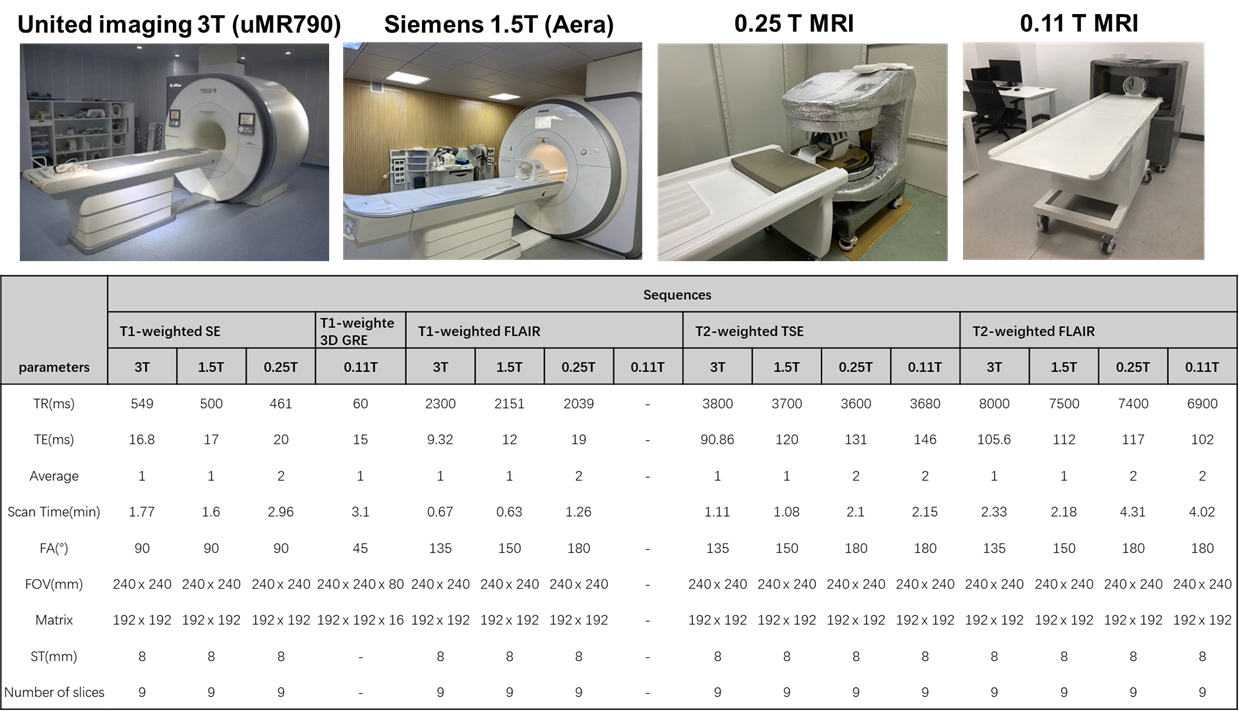
On the top row in Fig. 1 shows the four MRI systems used for comparison in this study. The 1.5T and 3.0T scanner are commercialized superconducting magnet systems while the 0.25 T and 0.11 T system are permanent magnet systems. The 0.11T system was desgined towards portable MRI applications in absence of any RF and magnetic shielding cages.A water phantom was scanned with the same parameters (TR/TE = 4000/16ms) of spin-echo sequence for the SNR comparison. With IRB approval and informed consent/assent, volunteers were scanned with Inversion Recovery Spin Echo(IR-SE) and Multi-echo Spin Echo (MESE) sequences at different fields to get the T1 and T2 of the white matter (WM), gray matter (GM) and cerebrospinal fluid (CSF) at each fields (except 0.11 T). Four other typical clinical contrast protocols were accordingly optimized, scan parameter details are shown in the table of Fig.1
Results and discussion
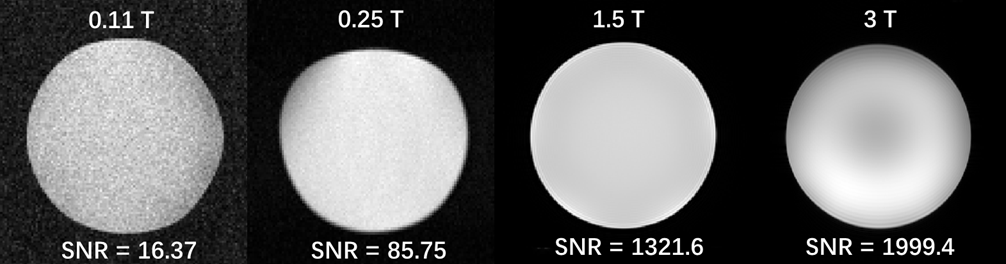
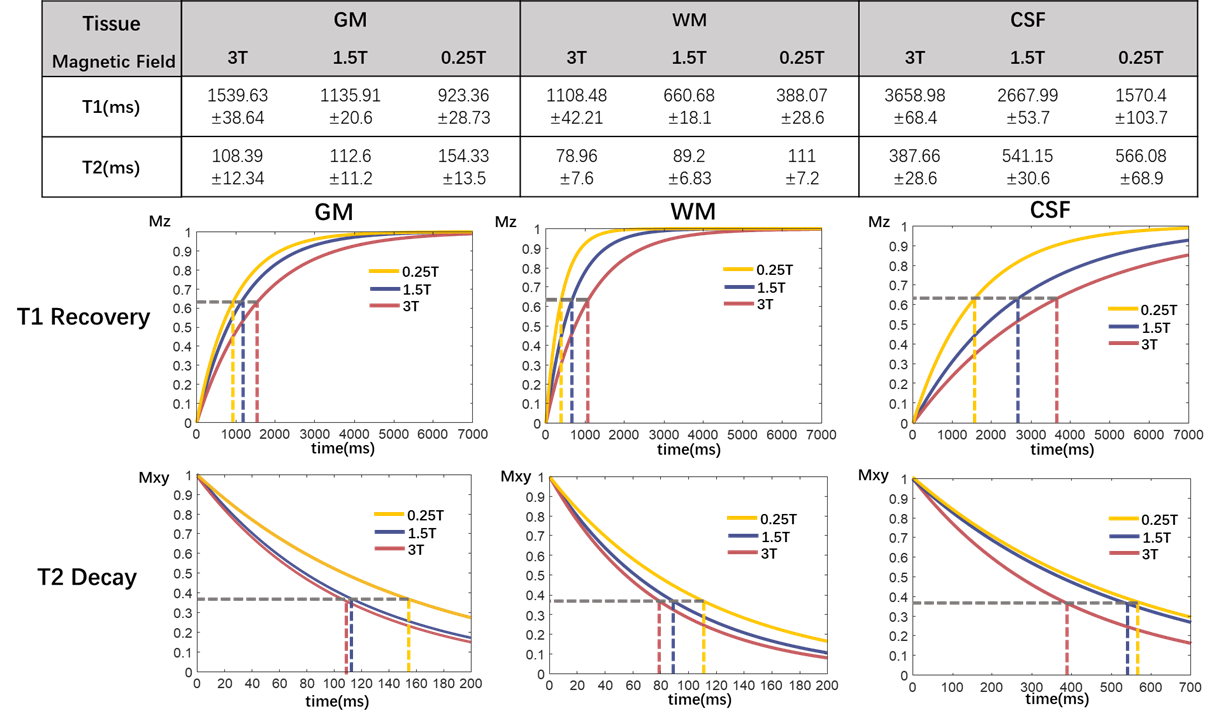
SNR test results are shown in Fig. 2. SNR of the phantom increases with the magnetic field strength. The low SNR of 0.11T is partly attributable to ongoing electromagnetic interference (EMI) environment.The T1 and T2 results and their corresponding recovery and attenuation are shown in Fig. 3. Because of the ongoing EMI, we were unable to get the quantitative values at 0.11T. For all three tissues (GM, WM and CSF), T1 decreases and T2 increases with decreasing fields, which indicates benefits like faster signal recovery and slower signal decay for imaging. The corresponding parameters designed from the quantitative values are shown in Fig. 1, in which longer TE and shorter TR of lower fields can be seen. Furthermore, because of the SAR limit, the Flip Angle at 1.5T and 3T were recommended to be less than 180 degrees for SE or TSE sequences, which is not a problem at 0.11T and 0.25T due to the reduced SAR at low-field MRI.
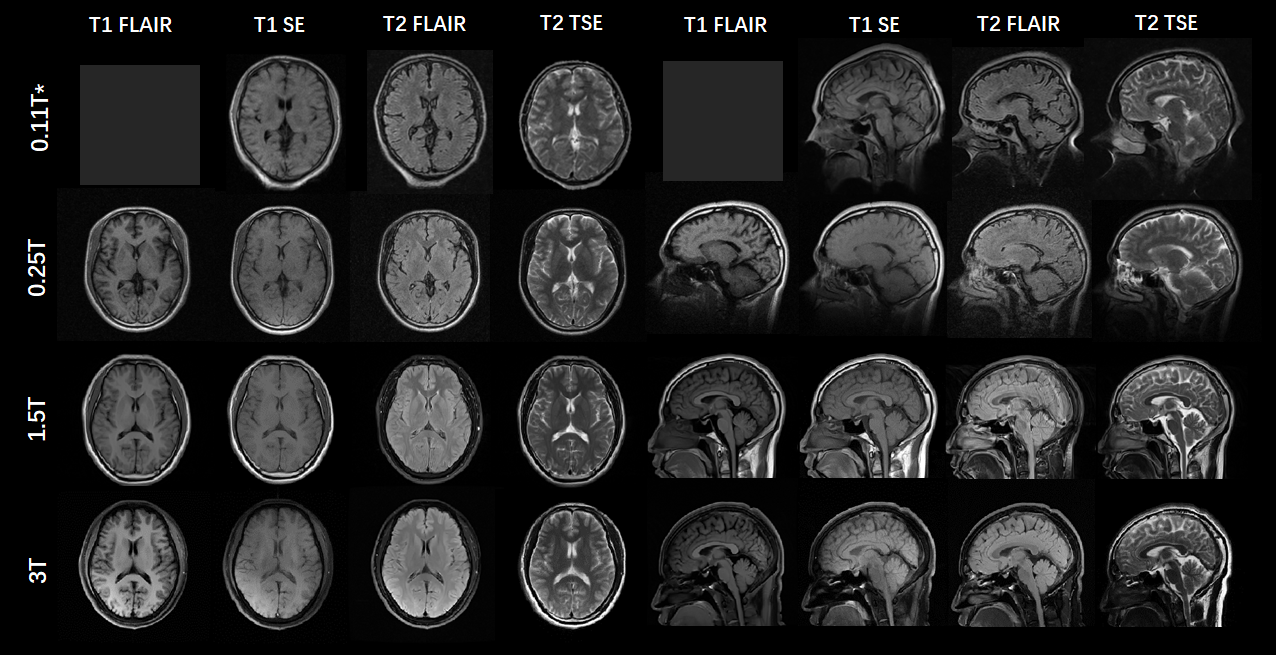
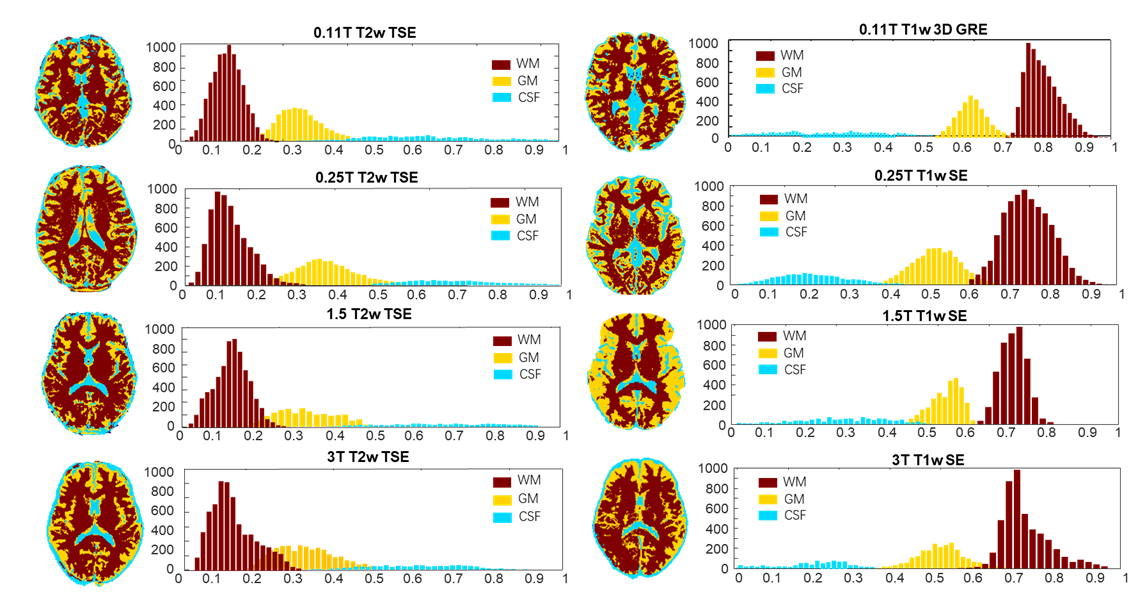
T1-weighted and T2-weighted clinical images are shown in Fig. 4. Due to the ongoing EMI at 0.11T, we were currently unable to run the T1 FLAIR sequence, and the T1-weighted image at 0.11T were actually 3D T1-weighted GRE to increase the SNR. From Fig. 4, similar contrasts can be seen at different fields. From Fig. 5, the histograms of three tissues at different fields showed similar shape, which means close contrasts thus showing great potentiality for low-field MRI in clinical applications. However, the distortion of the brain at 0.11T were very obvious, which was likely due to defective shimming condition.
Conclusion
In this work, we have shown the SNR test, quantification fitting and protocol optimization for low field-MRI. We can observe the decreased T1, increased T2, decreased SAR and standard contrasts for clinical imaging at low-field MRI, which is beneficial for clinical imaging. However, improvement is desired at low-field MRI when it comes to starved SNR and hardware technique. Even though we try to keep the fair comparison there’re still many configurations such as coil performance, spectrometer stability, gradient performance and so on, may affect the reliability. Further improvement will be carried out in the future.Acknowledgements
This work is supported by the National Natural Science Foundation of China National Science Foundation of China (No. 62001290), Shanghai Science and Technology Development Funds (21DZ1100300), and Shanghai Sailing Program (20YF1420900), and sponsored by the National Science and Technology Innovation 2030 Major Project (2022ZD0208601).References
1. Campbell-Washburn, A.E., et al., Opportunities in Interventional and Diagnostic Imaging by Using High-Performance Low-Field-Strength MRI. Radiology, 2019. 293(2): p. 384-393.
2. Marques, J.P., et al., ESMRMB annual meeting roundtable discussion:“when less is more: the view of MRI vendors on low-field MRI”. Magnetic Resonance Materials in Physics, Biology and Medicine, 2021. 34(4): p. 479-482.
3. Jimeno, M.M., J.T. Vaughan, and S. Geethanath, Superconducting magnet designs and MRI accessibility: a review. arXiv preprint arXiv:2205.08918, 2022.
4. Liu, Y., et al., A low-cost and shielding-free ultra-low-field brain MRI scanner. Nature communications, 2021. 12(1): p. 1-14.
5. Stainsby, J.B., Geron Connell, Ian Thevathasan, Gilbert Curtis, Andrew Beatty, Phil Harris, Chad Wiens, Curtis Panther, Alex. Imaging at 0.5 T with high-performance system components. in ISMRM. 2020.
6. Runge, V.M. and J.T. Heverhagen, The Clinical Utility of Magnetic Resonance Imaging According to Field Strength, Specifically Addressing the Breadth of Current State-of-the-Art Systems, Which Include 0.55 T, 1.5 T, 3 T, and 7 T. Invest Radiol, 2022. 57(1): p. 1-12.
Figures