1759
Time-Dependent OGSE Diffusion MRI with MAGNUS Ultra-High-Performance Gradient Coil for Microstructure Imaging in Glioma Brain Tumor Patients1Uniformed Services University, Bethesda, MD, United States, 2GE Research, Niskayuna, NY, United States, 3Brigham and Women's Hospital, Boston, MA, United States, 4Walter Reed National Military Medical Center, Bethesda, MD, United States
Synopsis
Keywords: Tumors, Tissue Characterization
The MAGNUS ultra-high-performance gradient coil delivers simultaneous 200 mT/m and 500 T/m/s performance on each axis, with higher peripheral nerve stimulation thresholds than whole-body gradient coils, which is particularly useful for diffusion MRI-based microstructure imaging. We used MAGNUS-enabled OGSE to assess shorter diffusion times and length scales <10 µm in four brain tumor patients with gliomas. We measured differences in time-dependent diffusivity between high-grade glioma and low-grade glioma, as well as between recurrent glioblastoma and treatment effects. The malignant lesions demonstrated greater time-dependence of diffusivity. Further investigation with additional subjects and histopathologic correlation may lead to future clinical applications.
Introduction
MAGNUS is a research head-only ultra-high-performance gradient coil that can be installed into a clinical whole-body 3.0T MRI scanner. Using a 1 MVA driver, this coil can deliver simultaneous 200 met/m and 500 T/m/s on each axis plus higher peripheral nerve stimulation thresholds than whole-body gradient coils, which is useful for microstructure imaging1. Oscillating gradient spin-echo (OGSE) diffusion MRI can probe shorter diffusion times and tissue lengths than pulsed gradient spin-echo (PGSE) on preclinical scanners, but it has been limited by gradient performance on clinical scanners2. We explored the application of MAGNUS-enabled OGSE in assessing length scales <10 µm and time-dependent diffusivity in patients with gliomas.Methods
Under an ongoing IRB-approved protocol, two subjects undergoing pre-biopsy evaluation for suspected brain tumor and two subjects with recurrent enhancing lesions after treatment of brain tumor were recruited for OGSE diffusion MRI on the MAGNUS research scanner. Cosine-modulated trapezoidal waveforms were used for diffusion encoding at frequencies up to 100 Hz, and PGSE diffusion MRI was used for diffusion encoding at 0 Hz (voxel size 2 x 2 x 2 mm3).In the two pre-treatment subjects, multi-shell multi-frequency OGSE was applied to estimate intracellular volume fraction (fc) and cell radius (R), based on a two-compartment model with the intracellular compartment modeled as impermeable spheres (Figure 1). Five encoding frequencies were acquired (with b-values in parentheses): PGSE for 0 Hz (500, 1500, 2000 s/mm2), 35 Hz (500, 1500, 2000 s/mm2), 50 Hz (500, 750, 1500 s/mm2), 75 Hz (200, 400, 700 s/mm2), 100 Hz (150, 300, 400 s/mm2). Acquisition time was 8:40 minutes.
In all four subjects, single-shell, multi-frequency OGSE was applied for measurement of time-dependent diffusivity, independent of any tumor tissue modeling or cell size estimation. Five frequencies were acquired with a b-value of 450 s/mm2 and 30 diffusion-encoding directions per frequency: 0 Hz (using PGSE), 30 Hz, 60 Hz, 80 Hz, 100 Hz. Acquisition time was 15 minutes.
Results
In the two pre-treatment subjects, for each voxel in the tumor region, signals from the multi-shell multi-frequency OGSE were fitted to a two-compartment model with intracellular water diffusion in impermeable spheres and nonrestricted extracellular water diffusion3-6. Statistical averages of estimated cell size and intracellular volume fraction were calculated in each voxel. There was a significant difference in intracellular volume fraction between the biopsy-proven high-grade versus low-grade glioma (Figure 2). Estimated cell size was similar for both tumors (~5 µm) and agreed with reported values for glioma pathology7. The same estimated biological parameters were also calculated using subsamples of the frequency and b-value combinations that would be achievable on a clinical whole-body MRI scanner with lower maximum gradient strength of 80 mT/m or 125 mT/m and slew rate of 200 T/m/s (Figure 3). There was decreased sensitivity for smaller cell size when compared against the full MAGNUS data set.In all four subjects, for regions-of-interest drawn around the brain tumors and the recurrent enhancing lesions, signals from the single-shell multi-frequency OGSE were used to calculate time-dependent diffusivities as the average apparent diffusion coefficient at each frequency, f. For each ROI, the mean ADC(f) was fitted to power-law model, ADC(f) = D0 + A x f θ , in order to estimate the intercept, D0, the dispersion rate, A, and the exponent, θ. There was a significant difference in time-dependent diffusivities between the biopsy-proven high-grade versus low-grade glioma, demonstrating θ of 0.69 and 0.28, respectively (Figure 4). In the post-treatment subjects with recurrent enhancing lesions, one succumbed to recurrent glioblastoma and the other resolved on follow-up imaging, consistent with treatment effects. One of two enhancing lesion ROIs in the recurrent glioblastoma showed greater time-dependence of diffusivity (θ = 0.58) when compared against the enhancing lesion due to treatment effects (Figure 5).
Discussion
For brain tumors, advanced microstructure imaging may help noninvasively differentiate among different phenotypes/genotypes, which can overlap in appearance on conventional sequences8. Techniques such as diffusion kurtosis imaging and time-dependent diffusion measure deviation from Gaussian diffusion to characterize cellular changes in tumor development and therapeutic outcome9. Time-dependent diffusion with PGSE has been used successfully to assess gliomas in both preclinical and clinical settings7,10, but it usually achieves diffusion times (t) down to ~20 ms, limiting sensitivity for structures <10 µm, based on the Einstein-Smoluchowski equation, with mean square displacement of intracellular water molecules, R2 = 6Dt (where D is 2-3 µm2/ms)11.On the other hand, time-dependent diffusion with OGSE requires high-performance gradients, but can achieve shorter effective diffusion times, for example down to ~2.5 ms at 100 Hz using cosine-modulated waveforms (t = 1/4f), which is helpful for characterizing structures <10 µm. We have applied MAGNUS-enabled OGSE to estimate differences in biological parameters and time-dependent diffusivity between a high-grade glioma and a low-grade glioma, using higher frequencies and shorter diffusion times than previously described7,11. We have also compared time-dependent diffusivity metrics between a recurrent glioblastoma versus treatment effects, based on previous reports of diffusion imaging for monitoring of treatment response5,10,12.
Conclusion
We have shown the feasibility of MAGNUS-enabled OGSE in assessing shorter diffusion times and length scales <10 µm in glioma brain tumor patients. Further investigation with additional subjects and histopathologic correlation may lead to future clinical applications.Acknowledgements
The views expressed in this abstract are those of the authors and do not reflect the official policy or position of the Uniformed Services University of the Health Sciences, Walter Reed National Military Medical Center, the Department of Defense, or the U.S. Government.References
1. Foo TKF, Tan ET, Vermilyea ME, et al. Highly efficient head-only magnetic field insert gradient coil for achieving simultaneous high gradient amplitude and slew rate at 3.0T (MAGNUS) for brain microstructure imaging. Magn Reson Med. 2020 Jun; 83(6): 2356-2369.
2. Tan ET, Shih RY, Mitra J, et al. Oscillating diffusion-encoding with a high gradient-amplitude and high slew-rate head-only gradient for human brain imaging. Magn Reson Med. 2020 Aug; 84(2): 950-965.
3. Jiang X, Li H, Xie J, et al. Quantification of cell size using temporal diffusion spectroscopy. Magn Reson Med. 2016 Mar; 75(3): 1076-85.
4. Jiang X, Li H, Xie J, et al. In vivo imaging of cancer cell size and cellularity using temporal diffusion spectroscopy. Magn Reson Med. 2017 Jul; 78(1): 156-164.
5. Jiang X, Xu J, Gore JC. Quantitative temporal diffusion spectroscopy as an early imaging biomarker of radiation therapeutic response in gliomas: A preclinical proof of concept. Advances Rad Onc. 2019 Apr-Jun; 4: 367-376.
6. Xu J, Jiang X, Li H, et al. Magnetic resonance imaging of mean cell size in human breast tumors. Magn Reson Med. 2020 Jun; 83(6): 2002-2014.
7. Zaccagna F, Riemer F, Priest AN, et al. Non-invasive assessment of glioma microstructure using VERDICT MRI: correlation with histology. Eur Radiol. 2019 Oct; 29(10): 5559-5566.
8. Smits M, van den Bent MJ. Imaging Correlates of Adult Glioma Genotypes. Radiology. 2017 Aug; 284(2): 316-331.
9. Reynaud O. Time-Dependent Diffusion MRI in Cancer: Tissue Modeling and Applications. Frontiers in Physics. 2017 Nov; 5(58).
10. Roberts TA, Hyare H, Agliardi G, et al. Noninvasive diffusion magnetic resonance imaging of brain tumour cell size for the early detection of therapeutic response. Sci Rep. 2020 Jun 8; 10(1): 9223.
11. Maekawa T, Hori M, Murata K, et al. Differentiation of high-grade and low-grade intra-axial brain tumors by time-dependent diffusion MRI. Magn Reson Imaging. 2020 Oct; 72: 34-41.
12. Portnoy S, Fichtner ND, C Dziegielewski, et al. In vitro detection of apoptosis using oscillating and pulsed gradient diffusion magnetic resonance imaging. NMR Biomed. 2014 Jan; 27: 371–380.
Figures
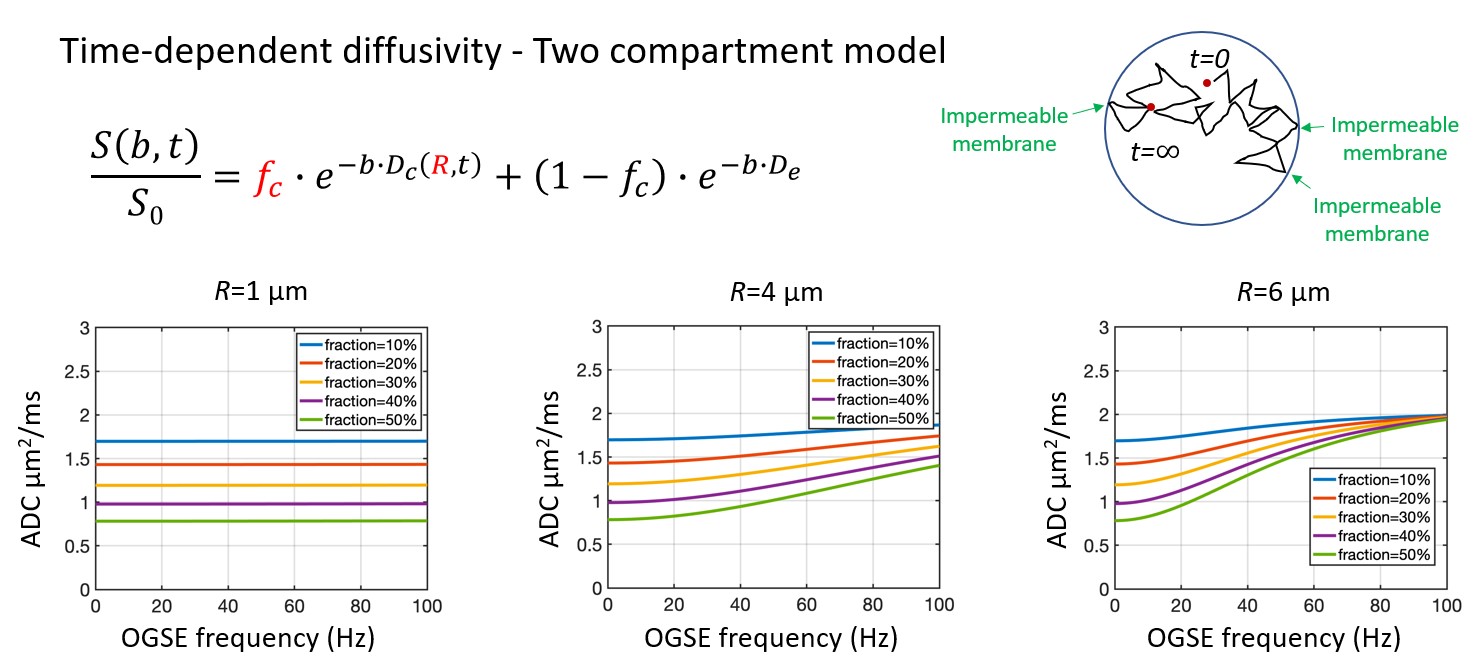
Two-compartment model with signal contribution from both time-dependent diffusivity in the intracellular compartment (impermeable spheres) plus Gaussian diffusivity in the extracellular compartment for tumor microstructure imaging. Multi-shell multi-frequency OGSE was applied to estimate intracellular volume fraction (fc) and cell radius (R), which can be used to calculate cell density (3fc/4πR3). Bottom row are simulations of diffusivities versus frequency for varying combinations of cell sizes and intracellular volume fractions.
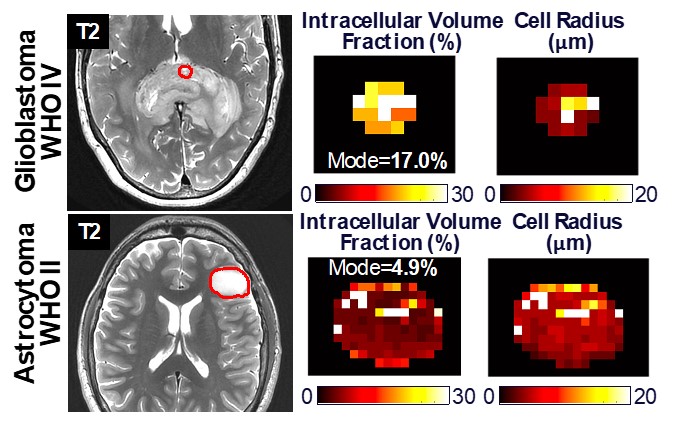
Multi-shell multi-frequency OGSE in two subjects with brain tumors before surgical biopsy (red circles) with a splenial high-grade glioma (top row) and a left frontal low-grade glioma (bottom row). Signal change with different b-values and frequencies in a two-compartment model was used to estimate intracellular volume fraction (fc) and cell radius (R) to be approximately 17% and 4-5 µm in the high-grade glioma, versus 5% and 5 µm in the low-grade glioma. Differences in intracellular volume fraction may reflect differences in cellularity (cell density) between the two brain tumors.
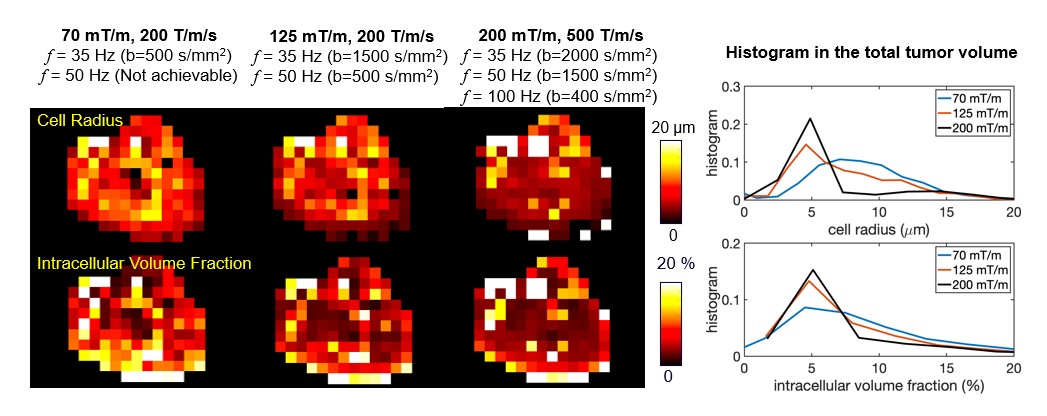
The data set from the multi-shell multi-frequency OGSE of the left frontal low-grade glioma was subsampled to include only the frequencies and maximum b-values that are available at a lower maximum gradient strength of 80 mT/m (left column) or 125 mT/m (middle column) and a slew rate of 200 T/m/s. There was decreased sensitivity for smaller cell size when compared against the full MAGNUS data set (right column). This can be seen as broadening and rightward shift of the cell radius histogram with lower gradient performance, limiting the ability to probe smaller diffusion times/lengths.
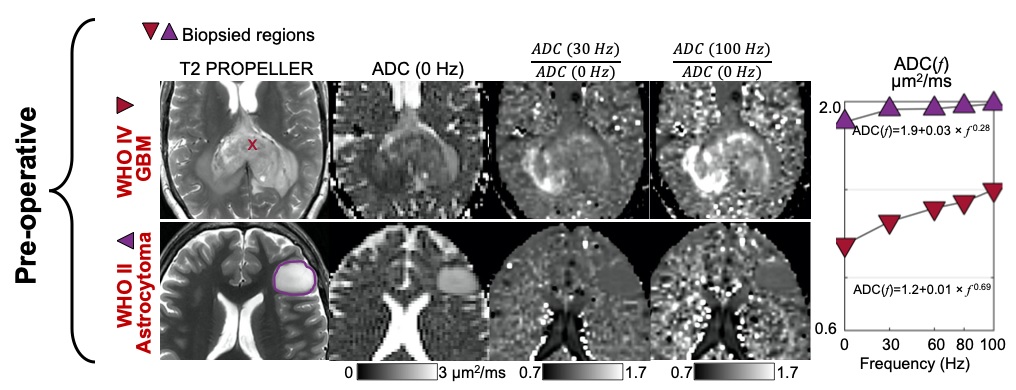
Single-shell multi-frequency OGSE in two subjects with brain tumors before surgical biopsy with a splenial high-grade glioma (top row) and a left frontal low-grade glioma (bottom row). Signal change with different frequencies was fitted to power-law model ADC(f) = D0 + A x f θ in order to estimate the intercept D0, the dispersion rate A, and the exponent θ. The differences in D0 and θ may reflect differences in cellularity (cell density) between the two brain tumors. Higher signal on ADC (100 Hz) / ADC (0 Hz) may reflect higher cellularity and is more conspicuous than on ADC (30 Hz) / ADC (0 Hz).
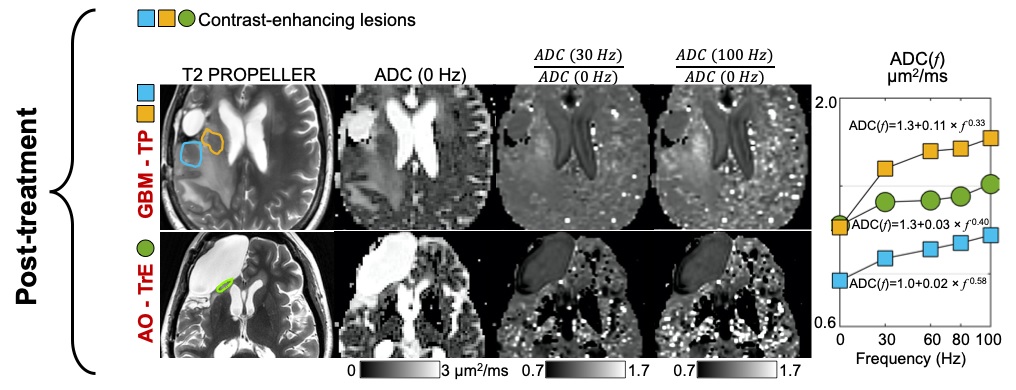
Single-shell multi-frequency OGSE in two subjects with recurrent enhancing lesions in the post-treatment setting for a glioblastoma (top row) and anaplastic oligodendroglioma (bottom row). Signal change with different frequencies was fitted to power-law model ADC(f) = D0 + A x f θ in order to estimate the intercept D0, the dispersion rate A, and the exponent θ. Higher signal on ADC (100 Hz) / ADC (0 Hz) may reflect higher cellularity in the recurrent glioblastoma (top row) versus the treatment effects (bottom row) and is more conspicuous than on ADC (30 Hz) / ADC (0 Hz) at a lower frequency.