1755
Characterising glioma heterogeneity with diffusion-relaxation MRI and InSpect1Centre for Medical Image Computing and Department of Computer Science, University College London, London, United Kingdom, 2Champalimaud Research, Champalimaud Foundation, Lisbon, Portugal, 3Institute for Research & Innovation in Health (i3S), University of Porto, Porto, Portugal
Synopsis
Keywords: Tumors, Microstructure
We characterise ex-vivo mouse brain tumours with combined T2-diffusion MRI and InSpect, a data-driven unsupervised learning technique that identifies distinct tissue components. We hence reveal heterogeneous tumour structures without imposing a biophysical model.Introduction
Combined diffusion-relaxation MRI can yield improved characterisation of tissue microstructure compared to separate diffusion and relaxation scans[1]. This has been demonstrated extensively in the brain, including in-vivo[2-7] and ex-vivo[8,9] studies. Moreover, it has been demonstrated that diffusion-relaxation can enhance sensitivity to tissue damage[8]. Diffusion-relaxation studies have utilised a variety of analysis approaches, including biophysical modelling[7,10], signal representations[11], and data-driven approaches [9,12,13].In this study, we acquire a rich T2-diffusion dataset in a healthy mouse brain and mice bearing glioma tumours at ultra-high field with very high resolution. We analyse our data with a signal representation model and InSpect[13], a data-driven unsupervised learning technique that automatically identifies and maps tissue components based on their spectral properties. We reveal clear contrast between healthy tissue and tumours, and uncover within-tumour heterogeneity, without imposing an explicit biophysical model.
Methods
All animal experiments were preapproved by the competent national and international authorities and were carried out according to EU Directive 2010/63.Mouse model: Gliomas were induced in C57BL/6J mice by intracranial stereotactic injection of GL261 cells [14].
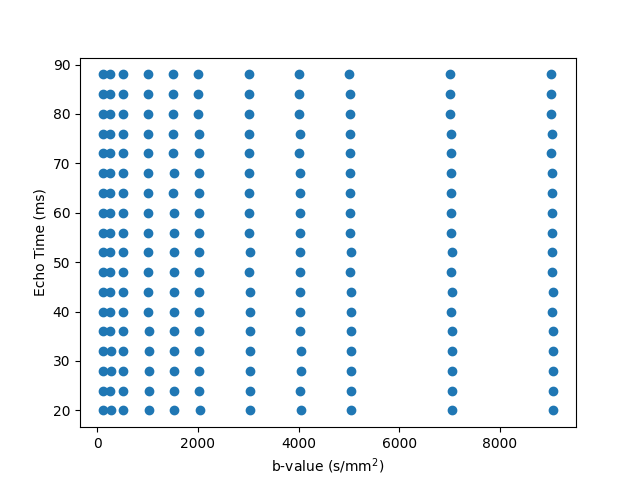
Ex-vivo experiments: One control brain and three glioma brains (2-3 weeks post inoculation) were extracted following transcardial perfusion with 4% paraformaldehyde and mounted in 10 mm NMR tubes. MRI data was acquired on a 16.4T Aeon Ascend Bruker scanner equipped with a unique cryocoil and the samples were kept at 37°C. T2-diffusion data was acquired with a standard PGSE-EPI sequence. Imaging parameters: TR=3000 ms, 4 shots, in-plane resolution = 0.1 x 0.1 mm2, slice thickness = 0.4 mm, matrix = 104 x 94. Diffusion parameters: δ/Δ = 3/10 ms, 10 non-zero b-values {250, 500, 1000, 1500, 2000, 3000, 4000, 5000, 7000, 9000} s/mm2 with 24 directions per shell. The entire protocol was repeated for 18 equally spaced echo times between 20 to 88 ms. The 2D grid of diffusion weightings and TEs is shown in Figure 1. Total scan time was 16h. We denoised the data with MP-PCA[15] and computed the powder-averaged data at each TE-b pair, yielding 198 volumes. We normalised the data by the lowest TE, lowest b-value volume.
Data analysis:
We first analysed the data by fitting a T2-extended mean signal kurtosis[16] model
$$S(T_2,D,K) = \exp(-T_E/T_2) \exp(-bD + b^2D^2K/6)$$
with self-supervised machine learning, akin to [8], to all volumes with $$$b < 3.5ms/μm^2$$$.
We also fit InSpect[13], an unsupervised machine learning technique that shares information across voxels to identify canonical spectral components and corresponding mappings, to the full dataset. We fit InSpect to all four scans simultaneously, and fixed five canonical spectral components.
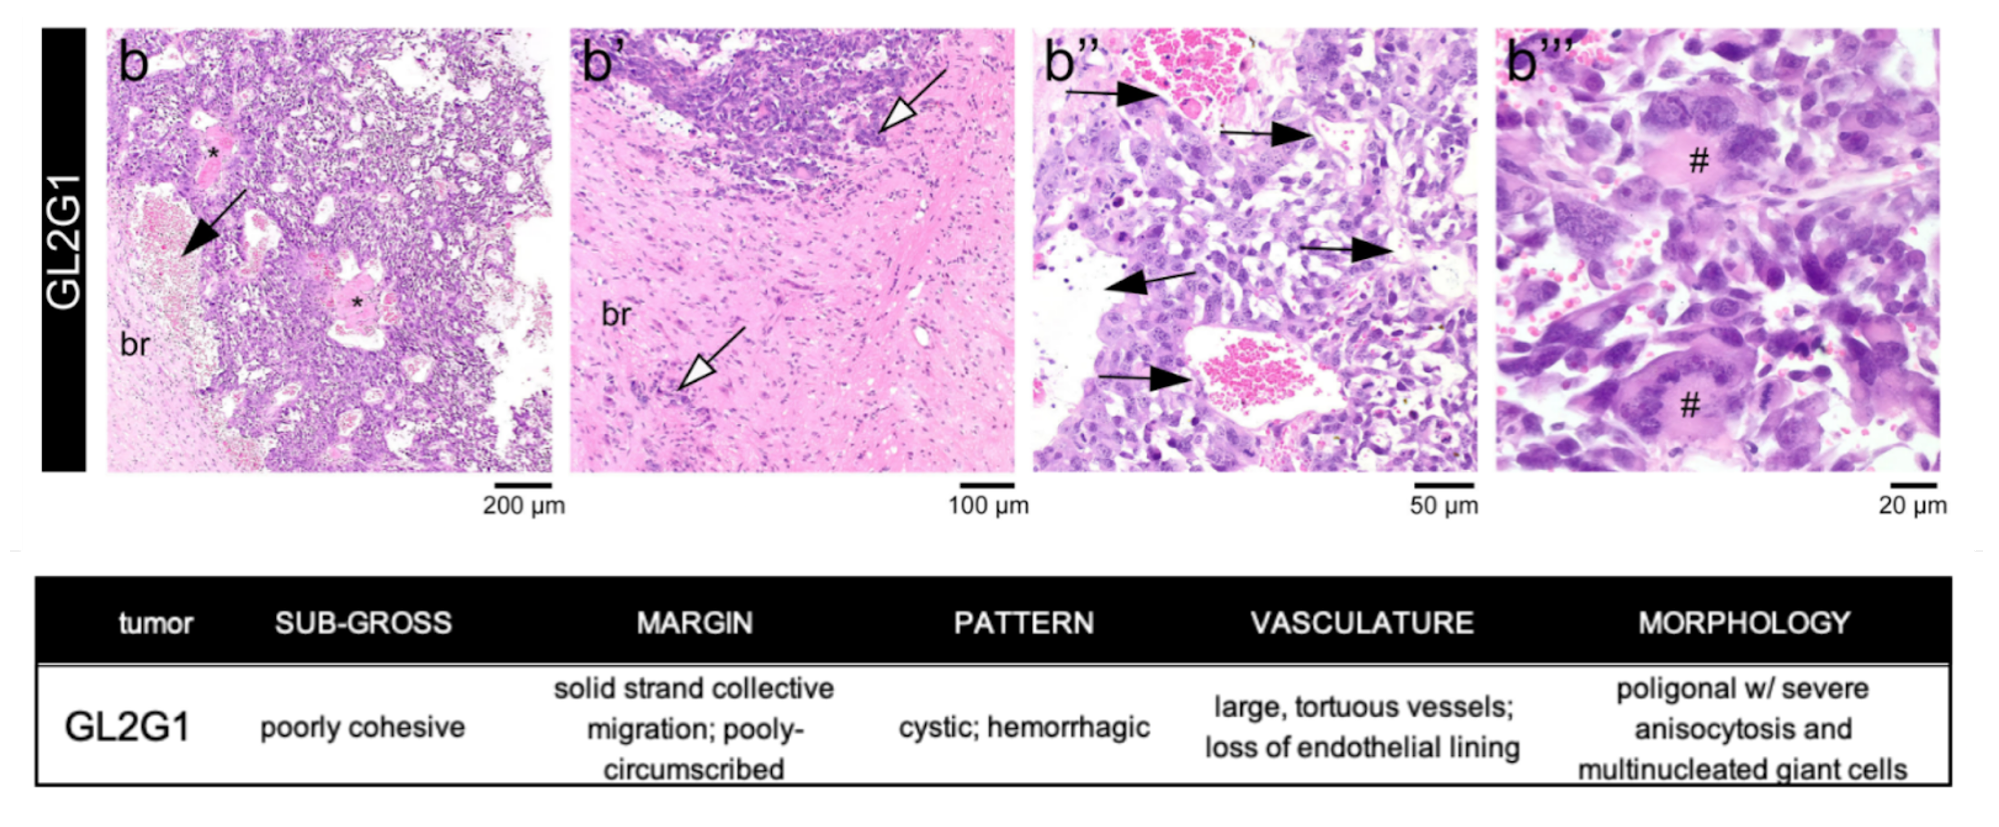
Histopathological analysis: After ex vivo MRI acquisitions, each brain was formalin-fixed, paraffin-embedded, sectioned at 4 µm from striatum to caudal hippocampus, and stained with hematoxylin and eosin. Slides were examined by an experienced pathologist using an Axioscope 5 microscope coupled to an Axiocam 208. Morphological features of the tumours are described in Figure 2.
Results
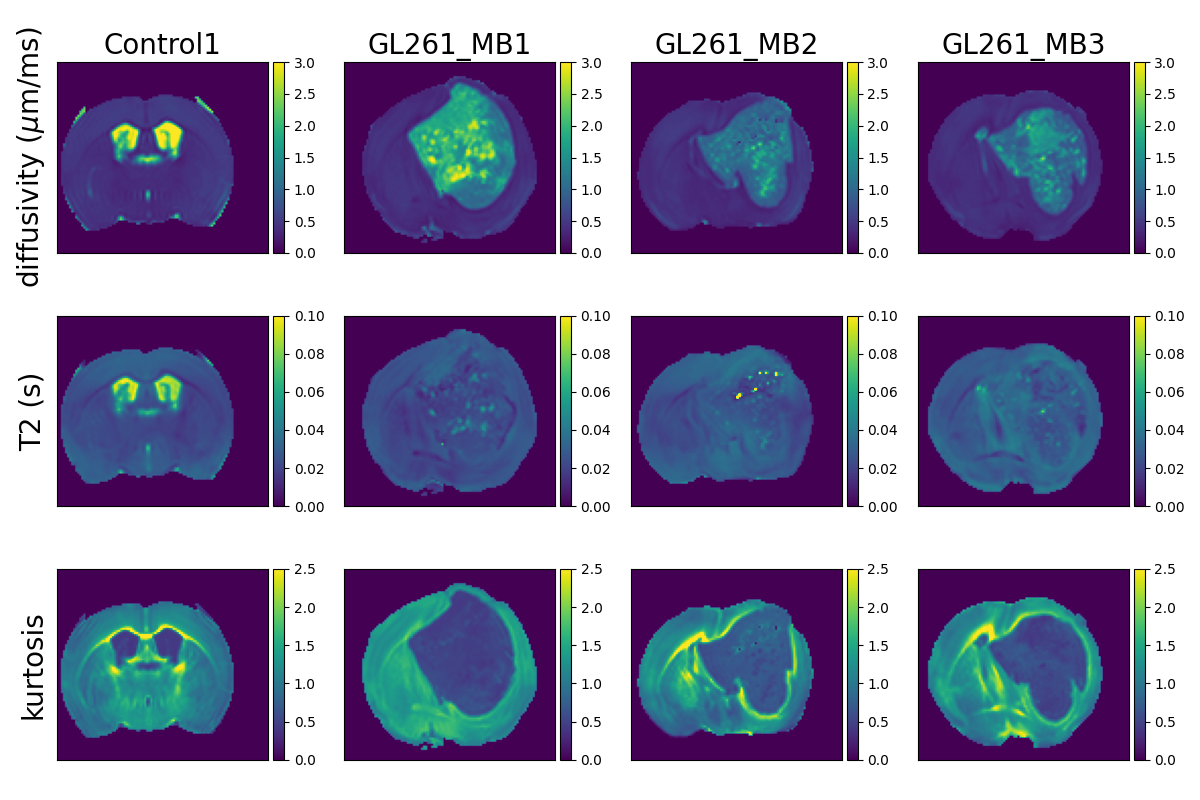
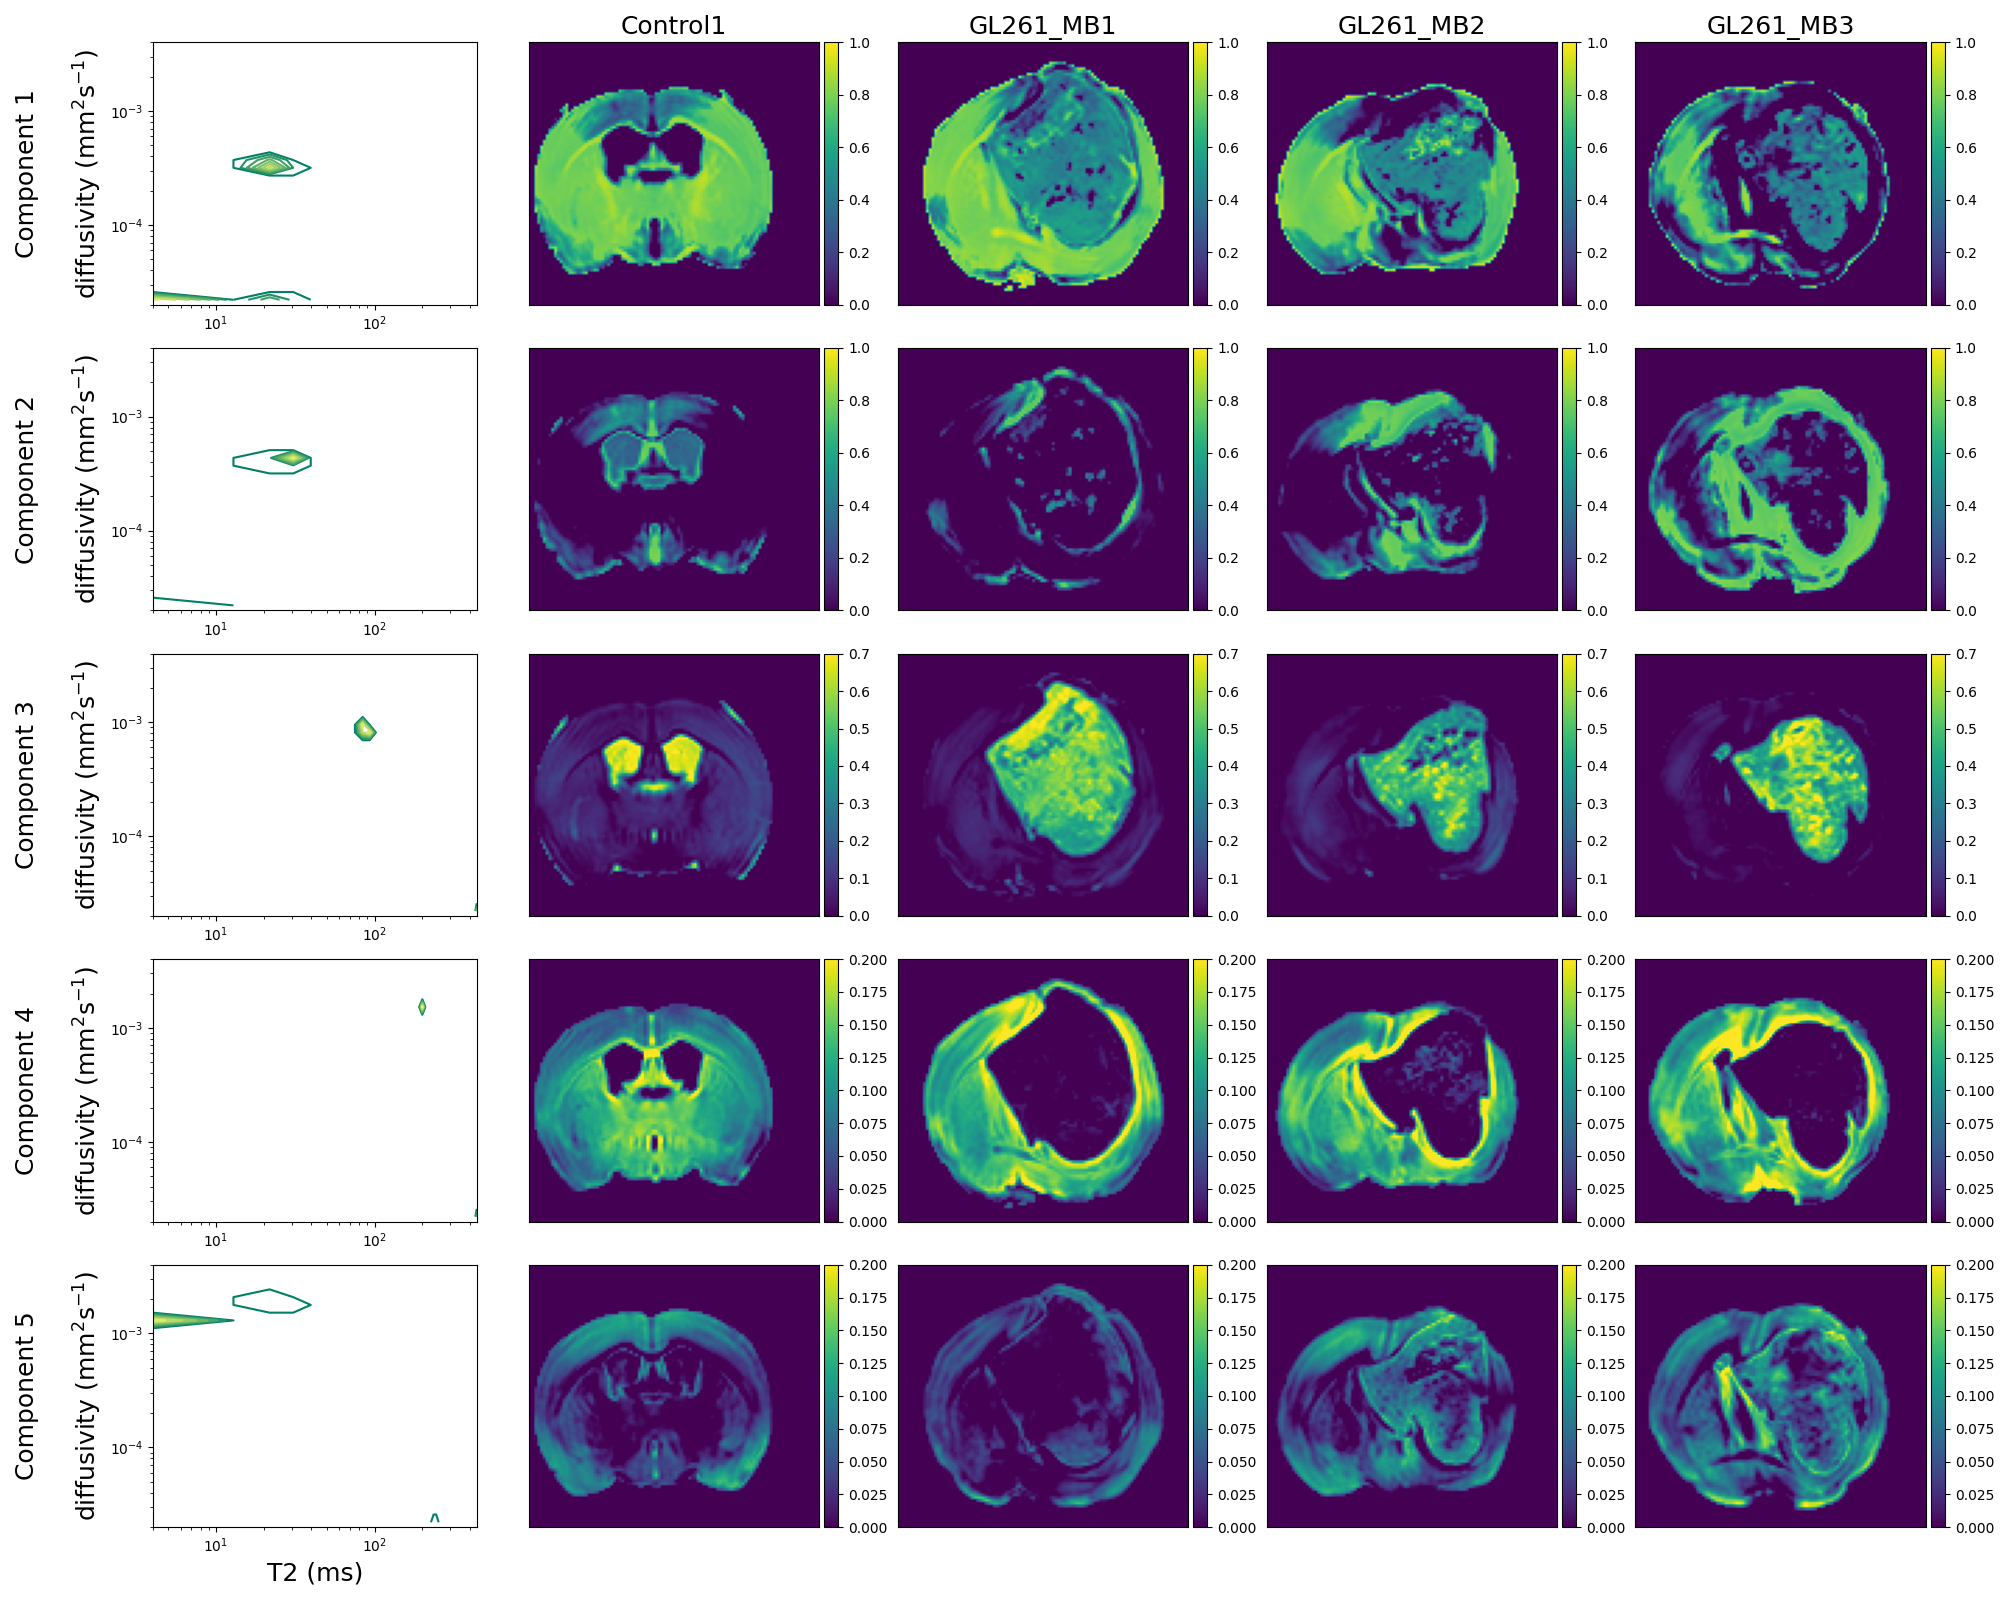
Figure 3 shows T2-kurtosis model maps for control and glioma scans. We observe clear contrast between tumour and non-tumour tissue, particularly in diffusivity and kurtosis maps. There are some small patches of high diffusivity and high T2 values within tumours, likely in areas with large vascular spaces and oedema that are characteristic to this tumour type, as illustrated by histology (Figure 2). Figure 4 shows the InSpect components across all scans.Discussion
InSpect component maps show more contrast between normal tissue and tumours than T2-kurtosis maps. In particular, component 3, which has T2 ~100ms and diffusivity ~10-3mm2/s, nearly always has zero weighting in non-CSF normal tissue but has high weighting in tumours. Conversely, component 4, which has T2 ~200ms and diffusivity ~1.5 x 10⁻³ mm2/s, nearly always has zero weighting inside the tumour but higher weighting in non-CSF normal tissue.InSpect maps also uncover tumour heterogeneity with more clarity than T2-kurtosis maps, especially in component 2 and 3 maps. The main peak of component 2 has T2 ~30 ms and diffusivity ~4 x 10⁻⁴ mm2/s, and its maps reveal small heterogeneous patches within the tumour.
We reveal less fine-grained tissue components in healthy tissue compared to previous work [17]; this is because we fit InSpect to control and glioma brains simultaneously. We took this approach as our goal is to reveal differences between tumour and healthy tissue, and within-tumour heterogeneity, rather than a detailed evaluation of normal tissue.
We fit InSpect with five components for this initial exploratory analysis - compared to four components in healthy brain tissue [17] - as we found this was sufficient to reveal tumour heterogeneity. We will explore this user-defined choice in future, to identify a number of components that parsimoniously describes glioma heterogeneity.
Conclusion
We uncover tumour heterogeneity with a high-resolution, high-field T2-diffusion acquisition and data-driven unsupervised learning. In future, we will directly compare InSpect maps with histology to associate components with specific histologic features, with the ultimate goal of improved characterisation of cellular regions, cysts, infarcts, and tumour infiltration. We will also compare our approach with biophysical models specifically designed for characterising cell bodies[18] and tumours[19].Acknowledgements
This work was supported by the EPSRC (EP/V034537/1); the National Institute for Health Research (NIHR) Biomedical Research Centre at University College London Hospitals NHS Foundation Trust and University College London. This study was supported by funding from “la Caixa” Foundation (ID 100010434) and European Union’s Horizon 2020 research and innovation programme under the Marie Skłodowska-Curie grant agreement No. 847648, fellowship code CF/BQ/PI20/11760029. RNH was supported by the Scientific Employment Stimulus 4th Edition from Fundação para a Ciência e Tecnologia, Portugal, ref 2021.02777.CEECIND. The views expressed are those of the authors and not necessarily those of the NHS, the NIHR or the Department of Health.References
[1] P. J. Slator et al., ‘Combined diffusion-relaxometry microstructure imaging: Current status and future prospects’, Magn. Reson. Med., no. June, pp. 1–25, 2021, doi: 10.1002/mrm.28963.
[2] J. Veraart, D. S. Novikov, and E. Fieremans, ‘TE dependent Diffusion Imaging (TEdDI) distinguishes between compartmental T2 relaxation times’, NeuroImage, vol. 182, pp. 360–369, 2018, doi: 10.1016/j.neuroimage.2017.09.030.
[3] J. Hutter et al., ‘Integrated and efficient diffusion-relaxometry using ZEBRA’, Sci. Rep., vol. 8, no. 1, pp. 15138–15138, Dec. 2018, doi: 10.1038/s41598-018-33463-2.
[4] T. Gong, Q. Tong, H. He, Y. Sun, J. Zhong, and H. Zhang, ‘MTE-NODDI: Multi-TE NODDI for disentangling non-T2-weighted signal fractions from compartment-specific T2 relaxation times’, NeuroImage, vol. 217, no. May, pp. 116906–116906, 2020, doi: 10.1016/j.neuroimage.2020.116906.
[5] S. De Santis, D. Barazany, D. K. Jones, and Y. Assaf, ‘Resolving relaxometry and diffusion properties within the same voxel in the presence of crossing fibres by combining inversion recovery and diffusion-weighted acquisitions’, Magn. Reson. Med., vol. 75, no. 1, pp. 372–380, Jan. 2016, doi: 10.1002/mrm.25644.
[6] J. P. de Almeida Martins, C. M. W. Tax, F. Szczepankiewicz, D. K. Jones, C.-F. Westin, and D. Topgaard, ‘Transferring principles of solid-state and Laplace NMR to the field of in vivo brain MRI’, Magn. Reson., vol. 1, no. 1, pp. 27–43, Feb. 2020, doi: 10.5194/mr-1-27-2020.
[7] B. Lampinen et al., ‘Towards unconstrained compartment modeling in white matter using diffusion-relaxation MRI with tensor-valued diffusion encoding’, Magn. Reson. Med., p. mrm.28216-mrm.28216, Mar. 2020, doi: 10.1002/mrm.28216.
[8] D. Benjamini, D. Iacono, M. E. Komlosh, D. P. Perl, D. L. Brody, and P. J. Basser, ‘Diffuse axonal injury has a characteristic multidimensional MRI signature in the human brain’, Brain, vol. 144, no. 3, pp. 800–816, Apr. 2021, doi: 10.1093/brain/awaa447.
[9] D. Kim, E. K. Doyle, J. L. Wisnowski, J. H. Kim, and J. P. Haldar, ‘Diffusion-relaxation correlation spectroscopic imaging: A multidimensional approach for probing microstructure’, Magn. Reson. Med., vol. 78, no. 6, pp. 2236–2249, 2017, doi: 10.1002/mrm.26629.
[10] V. Valindria, M. Palombo, E. Chiou, S. Singh, S. Punwani, and E. Panagiotaki, ‘Synthetic Q-Space Learning With Deep Regression Networks For Prostate Cancer Characterisation With Verdict’, in 2021 IEEE 18th International Symposium on Biomedical Imaging (ISBI), Apr. 2021, pp. 50–54. doi: 10.1109/ISBI48211.2021.9434096.
[11] L. Ning, B. Gagoski, F. Szczepankiewicz, C.-F. Westin, and Y. Rathi, ‘Joint RElaxation-Diffusion Imaging Moments to Probe Neurite Microstructure’, IEEE Trans. Med. Imaging, vol. 39, no. 3, pp. 668–677, Mar. 2020, doi: 10.1109/TMI.2019.2933982.
[12] D. Benjamini and P. J. Basser, ‘Use of marginal distributions constrained optimization (MADCO) for accelerated 2D MRI relaxometry and diffusometry’, J. Magn. Reson., vol. 271, pp. 40–45, 2016, doi: 10.1016/j.jmr.2016.08.004.
[13] P. J. Slator et al., ‘Data-Driven multi-Contrast spectral microstructure imaging with InSpect: INtegrated SPECTral component estimation and mapping’, Med. Image Anal., vol. 71, pp. 102045–102045, 2021, doi: 10.1016/j.media.2021.102045.
[14] R. V. Simões, R. N. Henriques, B. M. Cardoso, F. F. Fernandes, T. Carvalho, and N. Shemesh, ‘Glucose fluxes in glycolytic and oxidative pathways detected in vivo by deuterium magnetic resonance spectroscopy reflect proliferation in mouse glioblastoma’, NeuroImage Clin., vol. 33, p. 102932, Jan. 2022, doi: 10.1016/j.nicl.2021.102932.
[15] J. Veraart, D. S. Novikov, D. Christiaens, B. Ades-aron, J. Sijbers, and E. Fieremans, ‘Denoising of diffusion MRI using random matrix theory’, NeuroImage, vol. 142, pp. 394–406, 2016, doi: 10.1016/j.neuroimage.2016.08.016.
[16] R. N. Henriques, S. N. Jespersen, and N. Shemesh, ‘Microscopic anisotropy misestimation in spherical-mean single diffusion encoding MRI’, Magn. Reson. Med., vol. 81, no. 5, pp. 3245–3261, 2019, doi: 10.1002/mrm.27606.
[17] P. J. Slator, N. Shemesh, and A. Ianus, ‘Separating Tissue Components in Ex-vivo Mouse Brain with Joint Diffusion-Relaxation MRI and InSpect’, presented at the ISMRM 2022.
[18] M. Palombo et al., ‘SANDI: A compartment-based model for non-invasive apparent soma and neurite imaging by diffusion MRI’, NeuroImage, vol. 215, pp. 116835–116835, Jul. 2020, doi: 10.1016/j.neuroimage.2020.116835.
[19] E. Panagiotaki et al., ‘Noninvasive quantification of solid tumor microstructure using VERDICT MRI’, Cancer Res., vol. 74, no. 7, pp. 1902–1912, 2014, doi: 10.1158/0008-5472.CAN-13-2511.
Figures