1749
Identification of IDH genotype and tumor subtype of adult-type diffuse gliomas based on WHO CNS5 using histogram features of QSM and ADC
Yifan Sun1, Zheting Yang1, Yang Song2, and Rifeng Jiang1
1Fujian Medical University Union Hospital, Fuzhou, China, 2MR Scientific Marketing, Siemens Healthineers Ltd., Shanghai, China
1Fujian Medical University Union Hospital, Fuzhou, China, 2MR Scientific Marketing, Siemens Healthineers Ltd., Shanghai, China
Synopsis
Keywords: Tumors, Quantitative Susceptibility mapping, Glioma; Isocitrate dehydrogenase; WHO CNS5
Preoperative prediction of glioma histological features and biological behavior is clinically important. However, few studies reported the histogram analysis of QSM in the isocitrate dehydrogenase (IDH) genotype and subtype of gliomas. In this study, we explored the value of histogram features of QSM and ADC in predicting the IDH genotype and tumor subtype of adult-type diffuse gliomas based on the fifth edition of the World Health Organization Classification of Tumors of the Central Nervous System (WHO CNS5). We found that histogram parameters based on QSM and ADC are significantly related to the IDH genotype, tumor subtype, and proliferation of glioma.Introduction
Glioma is the most common primary intracranial tumor. Accurate preoperative classification is very important for the correct treatment and prognosis evaluation of glioma patients. isocitrate dehydrogenase (IDH) has been considered one of the most important molecular markers in gliomas, and since 2016 it has been integrated into the classification criterion of glioma. Furthermore, the recently published WHO 2021 Classification System reclassifies the adult-type diffuse gliomas into three subtypes, including (1) glioblastoma, IDH-wildtype, (2) astrocytoma, IDH-mutant, and (3) oligodendroglioma, IDH-mutant and 1p/19q-collected. However, the confirmation of IDH mutation status still depends on invasive tissue sampling and analysis, usually obtained by surgery or biopsy. Quantitative susceptibility mapping (QSM) is a relatively novel MRI technique developed in the past 10 years for quantifying the amount and spatial distribution of magnetic susceptibility. QSM can be applied for the identification of microhemorrhages and microvascularity, thereby assisting in the diagnosis of gliomas. On the other hand, the apparent diffusion coefficient (ADC) obtained from DWI may also help characterize the tumor's microenvironment by assessing the cellularity of the tissue. Therefore, the purpose of this study is to explore the value of histogram features of QSM and ADC in predicting the IDH genotype and tumor subtype of adult-type diffuse gliomas based on the WHO CNS5.Methods
This prospective study included 55 patients with glioma who underwent MRI before the surgery. Histogram features of QSM and ADC values are extracted from the tumor parenchyma. Mann-Whitney U Test was used to compare the differences in the histogram features between different IDH genotypes and between glioblastoma, IDH-wildtype, and astrocytoma, IDH-mutant due to the insufficient patients with oligodendroglioma. Receiver operating characteristic (ROC) curves were constructed to assess the corresponding diagnostic performance. The Spearman correlation analysis was used to evaluate the correlation between Ki-67 LI and each histogram feature.Results
In distinguishing between different IDH genotypes, the ADC histogram features including 10Percentile, Mean, Median, RMS and Skewness showed significant differences between different IDH genotypes (p<0.05 for all), and the 10Percentile demonstrated the highest diagnostic performance (AUC=0.753, specificity=53.85%, and sensitivity=91.67%). Similarly, the QSM histogram features including, 10Percentile, 90Percentile, Energy, IQR, Maximum, MAD, RMAD, RMS, TotalEnergy, and Variance showed significant differences between different IDH genotypes (p<0.05 for all), and the IQR demonstrated the highest diagnostic performance (AUC=0.774, specificity=70.00%, and sensitivity=81.50%). In distinguishing between different tumor subtypes, the ADC histogram features including 10Percentile and Skewness, and the QSM histogram features including 90Percentile, IQR, MAD, RMAD, RMS, and Variance showed significant differences between the astrocytoma, IDH-mutant than the glioblastoma, IDH-wildtype (p<0.05 for all), with the IQR of QSM having the highest AUC of 0.745. Additionally, the QSM histogram features including 90Percentile, Energy, IQR, Maximum, MAD, Range, RMAD, RMS, Skewness, TotalEnergy, and Variance correlated positively with Ki-67 (p < 0.05 for all), whereas the ADC histogram features including 10Percentile and Median, the 10Percentile of QSM correlated negatively with Ki-67 (p < 0.05 for all).Discussion
This study demonstrated that histogram parameters based on QSM and ADC are significantly related to the grade, subtype and proliferation of glioma. In all the QSM histogram features with statistical differences (except P10), the value of IDH wild type is higher than that of mutant type, and the value of GBM is higher than that of the astrocytoma, IDH-mutant. Histopathologically, IDH wild-type glioma and GBM are more aggressive, and immature new microvessels proliferated in the tumor are more likely to rupture and bleed. In this sense, the difference of the above QSM values is reasonable. In addition, we found that ADC values were able to differentiate the glioblastoma, IDH-wildtype from astrocytoma, IDH-mutant by delineating the diffusion difference of water molecules, and those ADC values were significantly lower in glioblastoma, IDH-wildtype. Many studies have demonstrated that ADC is a useful imaging biomarker for predicting glioma grade and IDH genotype, which consistent with our findings.Conclusions
Histogram features of QSM and ADC may aid in non-invasively identifying IDH genotype and tumor subtype of adult-type diffuse gliomas based on the WHO CNS5. Besides, these features show great potential in evaluating the proliferation activity of gliomas.Acknowledgements
No acknowledgement found.References
1. Louis DN, Perry A, Wesseling P et al. The 2021 WHO Classification of Tumors of the Central Nervous System: a summary. Neuro Oncol. 2021;23(8):1231-1251.
2. Sun H, Yin L, Li S et al. Prognostic significance of IDH mutation in adult low-grade gliomas: a meta-analysis. J Neurooncol. 2013;113(2):277-284.
3. Le Bihan D. Apparent diffusion coefficient and beyond: what diffusion MR imaging can tell us about tissue structure. Radiology. 2013;268(2):318-322.
Figures
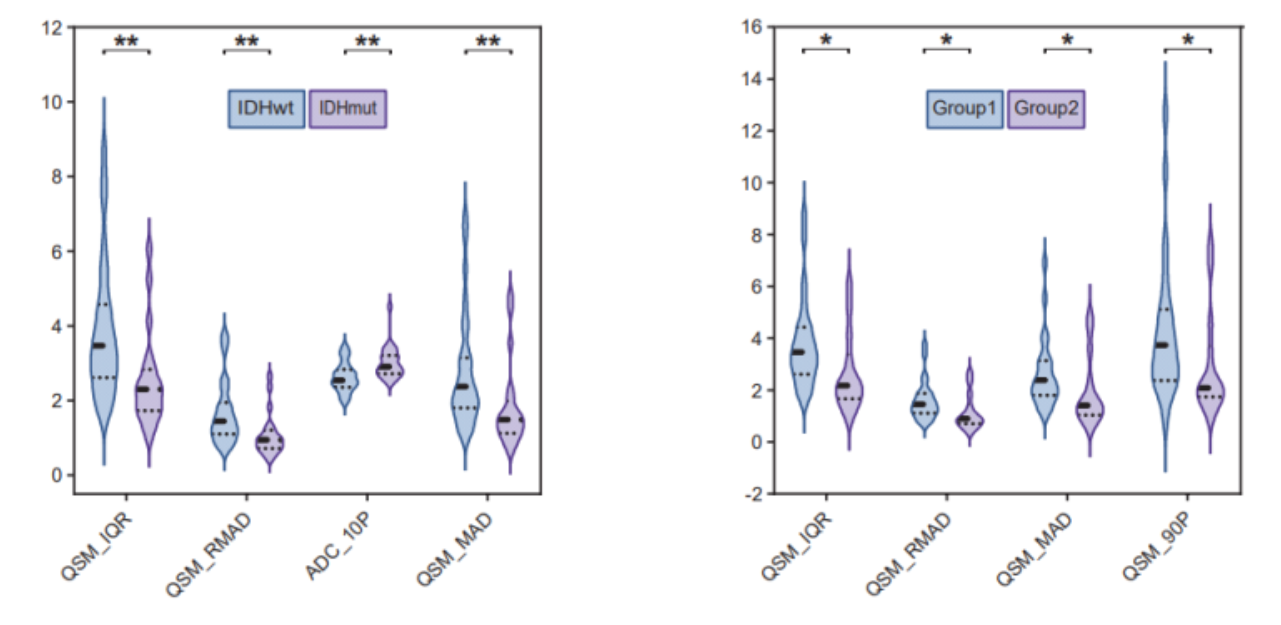
Figure 1. Box and whisker plot of representative histogram features in tumor region in the evaluation of IDH genotype and tumor subtype. Box and whisker plot shows the distribution of histogram features that could be used to identify (A) the IDH genotype and (B) the tumor subtype of adult-type diffuse gliomas based on WHO CNS5.
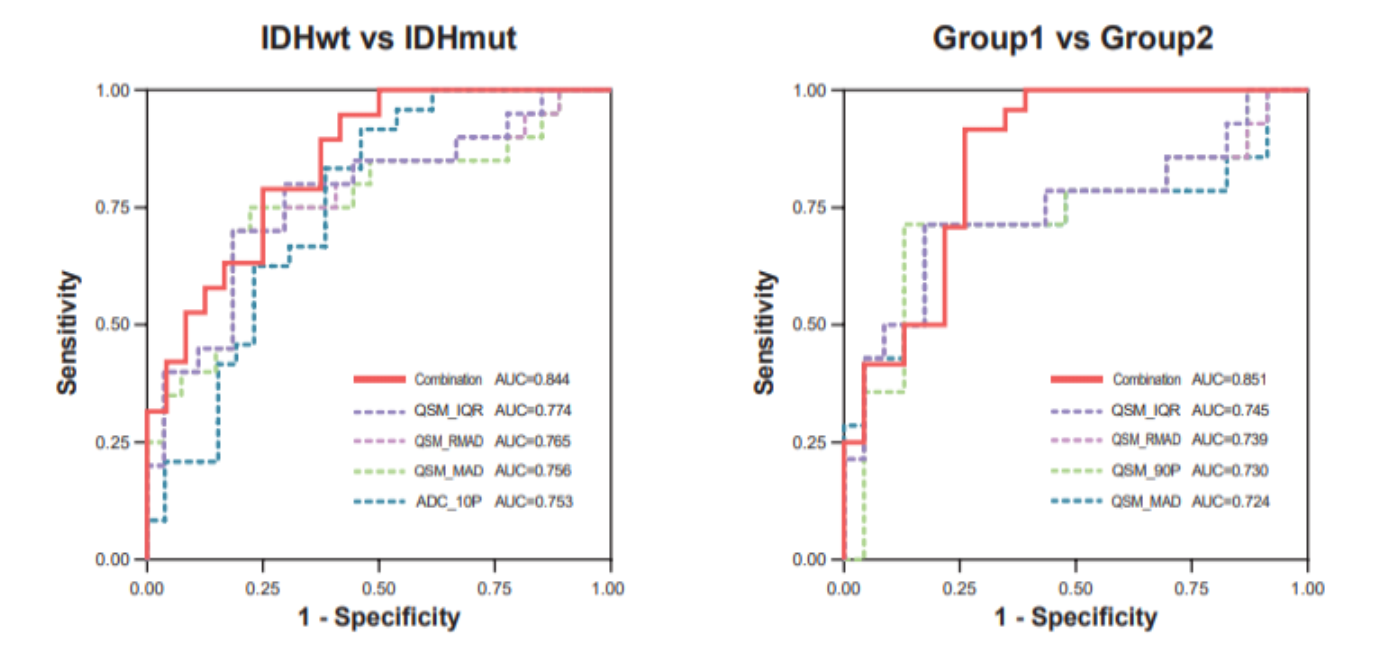
Figure 2. ROC curves with representative histogram features as well as prediction models in identifying IDH genotypes and the tumor subtypes of adult-type diffuse gliomas based on WHO CNS5. ROC curves for the representative histogram features in differentiating (A) IDH-wildtype from IDH-mutant gliomas, (B) glioblastoma, IDH-wildtype from astrocytoma, IDH-mutant.
DOI: https://doi.org/10.58530/2023/1749