1744
Effects of peritumoral T2 hyperintensities in treated gliomas on the quantification of tumour blood flow with arterial spin labeling.1Medical Physics and Biomedical Engineering, University College London Hospitals, London, United Kingdom, 2Queen Square Institute of Neurology, University College London, London, United Kingdom, 3Radiotherapy, University College London Hospitals, London, United Kingdom, 4Imaging, University College London Hospitals, London, United Kingdom
Synopsis
Keywords: Tumors, Arterial spin labelling
Elevated tumour blood flow in treated gliomas t can be indicative of disease recurrence. TBF can be visualised and quantified with arterial spin labelling with quantification performed by scaling a perfusion-weighted image by a proton density image and a brain-blood partition coefficient, assuming mapping to a fully relaxed blood magnetisation signal. However, this assumption might not hold in T2/FLAIR hyperintense areas surrounding enhancing tumour due to much higher water content. Therefore, this work investigates blood flow quantification in three tumour compartments, enabled by recent developments in AI-generated labels of tumour components.INTRODUCTION
Perfusion is an important tool to detect recurrent disease in post-treatment glioma patients. Arterial spin labelling (ASL) is a non-invasive perfusion MRI technique that has been shown to be useful in tumour assessment1,2. Most commonly, ratios between tumour ROIs of high intensities on a cerebral blood flow (CBF) map and a reference region are computed and interpreted. This approach, however, might result in an erroneous ratio if the CBF map is calculated using a voxel-by-voxel approach for scaling a perfusion-weighted image (PWI) by a proton density (PD). Areas of T2 / FLAIR which may represent post-treatment gliosis, diffuse infiltrative tumour or vascular oedema, have increasing water content resulting in the higher local T1 and T2 weighting in the PD calibration image. However, the signal intensity of fully relaxed water protons, which PD approximates, should not normally vary in space.This work aims to assess the effect of T2/FLAIR hyperintensities on the PD calibration and resulting CBF ratios using AI-generated multi-compartmental tumour segmentations.
METHODS
Patients: Sixty-nine patients (mean age 51.4 years, range 19-77 years) who received standard treatment for glioma (surgical debulking and chemoradiotherapy) and a diagnostic MRI including ASL within six months after the end of the treatment (range 1-6 months) were included in this study. The histological diagnoses comprised 41 IDHwt glioblastomas, 12 IDH mutant astrocytomas, 10 IDH mutant 1p19q co-deleted oligodendrogliomas and 6 others.Imaging: All scans were performed on a 3T scanner (Achieva or Ingenia, Philips Medical Systems, Best, The Netherlands). A clinical protocol included structural scans: 3DT1W GE pre/post gad, 2D FLAIR, SWI, DWI and a 2D EPI ASL. ASL consisted of pseudo-continuous ASL (pCASL) with 1.8s labelling and 2D post-labelling delay and background suppression (BS) and a calibration proton density image, acquired separately with readout acquisition parameters matching pCASL but without labelling or BC and with TR of 9s (three averages). All protocol sequence parameters are given in table 1.
CBF quantification: Raw ASL data were first motion corrected (DTI-TK package), par-wise subtracted, averaged and corrected for increased PLD of ascending slices and T1 relaxation using a simplified Buxton model, yielding a corrected perfusion-weighted image (PWI). Calibration was performed following consensus recommendations3, i.e. by using a separately acquired PD image and a single value of blood-brain partition coefficient of 9mL/g 3.
Segmentations: Lesion segmentation was undertaken using an in-house developed deep learning (nnU-Net derived) pipeline validated elsewhere4 with multi-compartment (enhancing, nonenhancing tumour and perilesional oedema) fidelity exceeding a Dice coefficient of 0.945.
ROI analysis: Segmentations and their flipped (contralateral) version were transferred to the ASL space using FSL by first registering low-resolution ASL data to high-resolution scans and using an inverse transform. Segmentations (tumour and contralateral) were then used to calculate mean regional PD and PWI signals. Finally, a set of ratios were computed to investigate differences in the PD calibration and resulting PWI ratios.
RESULTS:
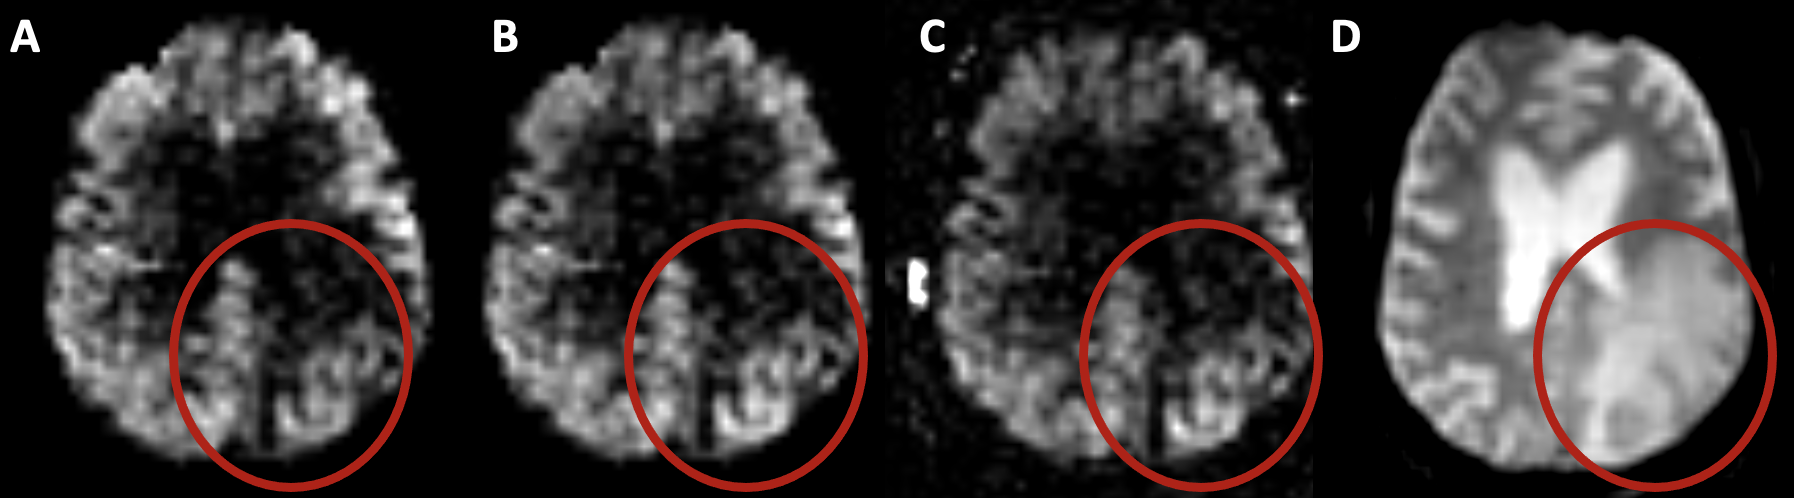
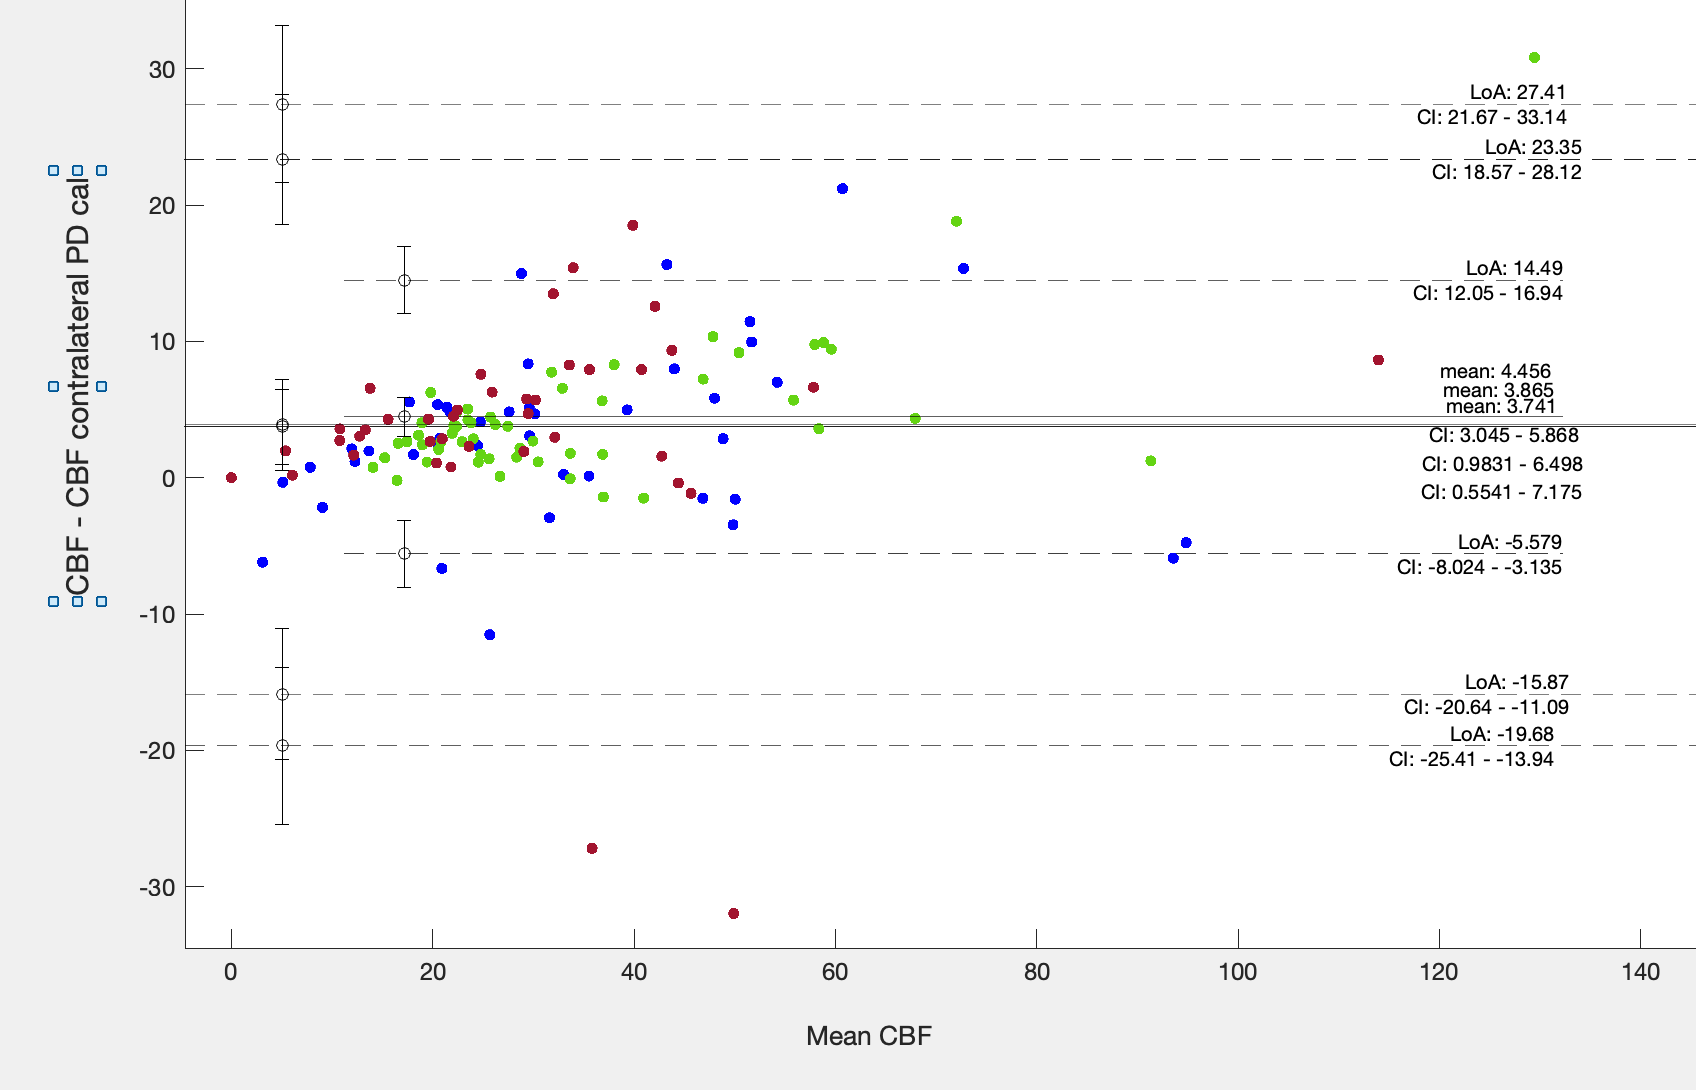
Figure 1 shows results of tumour segmentation using AI algorithm; figure 2 - ASL data with problematic region circled in read. Figure 3 shows PD calibration signal intensities of all three tumour components as ratios to their respective contralateral regions. There was a statistically significant difference in PD signal intensity within all three regions when compared to their respective contralateral segmentations (p<0.005). The mean ratio of PD image for all three regions was: 1.14,1.12 and 1.2 for oedema, enhancing and non-enhancing components, respectively. Figure 4 shows a B-A plot of standard CBF and CBF calculated using contralateral PD regions for quantification. There is a systematic bias for all three regions. T-test showed statisticaly significant difference between CBF calculated with standard and contralateral regions (P<0.005) for non-enhancing and oedema ROIs.DISCUSSION & CONCLUSION
This study investigates the effects of increased water content in the tissue around the treated tumour on ASL quantification when a long TR PD calibration method is used. The increased water content has a measurable effect on the PD calibration image which in turn underestimates CBF in the areas of T2/FAIR hyperintensity and consequently ratios to healthy tissue CBF. This can be rectified by using PD signal of contralateral healthy tissue. An alternative way to reduce the effect of fluid in the PD image would be to decrease TR of the calibration or use scanner-generated PWIs. However, these come with different shortcomings and CBF quantification errors5. More accurate quantification might reduce variance and aid broader clinical adoption of ASL.Acknowledgements
References
[1]Kong, L.et al. A meta-analysis of arterial spin labelling perfusionvalues for the prediction of glioma grade. Clin. Radiol. 72, 255–261 (2017).
[2]Brendle, C. et al. Arterial spin labeling: Pathologically proven superiority over conventional MRI for detection of high-grade glioma progression after treatment. Am. J. Neuroradiol. 29, 377–383 (2016).
[3]Alsop DC, et al. Recommended implementation of arterial spin‐labeled perfusion MRI for clinical applications: a consensus of the ISMRM perfusion study group and the European consortium for ASL in dementia. Magn Reson Med. 2015;73:102–116.
[4]Ruffle JK, et al. Translating automated brain tumour phenotyping to clinical neuroimaging arXiv:2206.06120v1
[5]Pinto J, et al. Calibration of arterial spin labeling data—potential pitfalls in post‐processing. Magn Reson Med 2020;83:1222–1234.
Figures
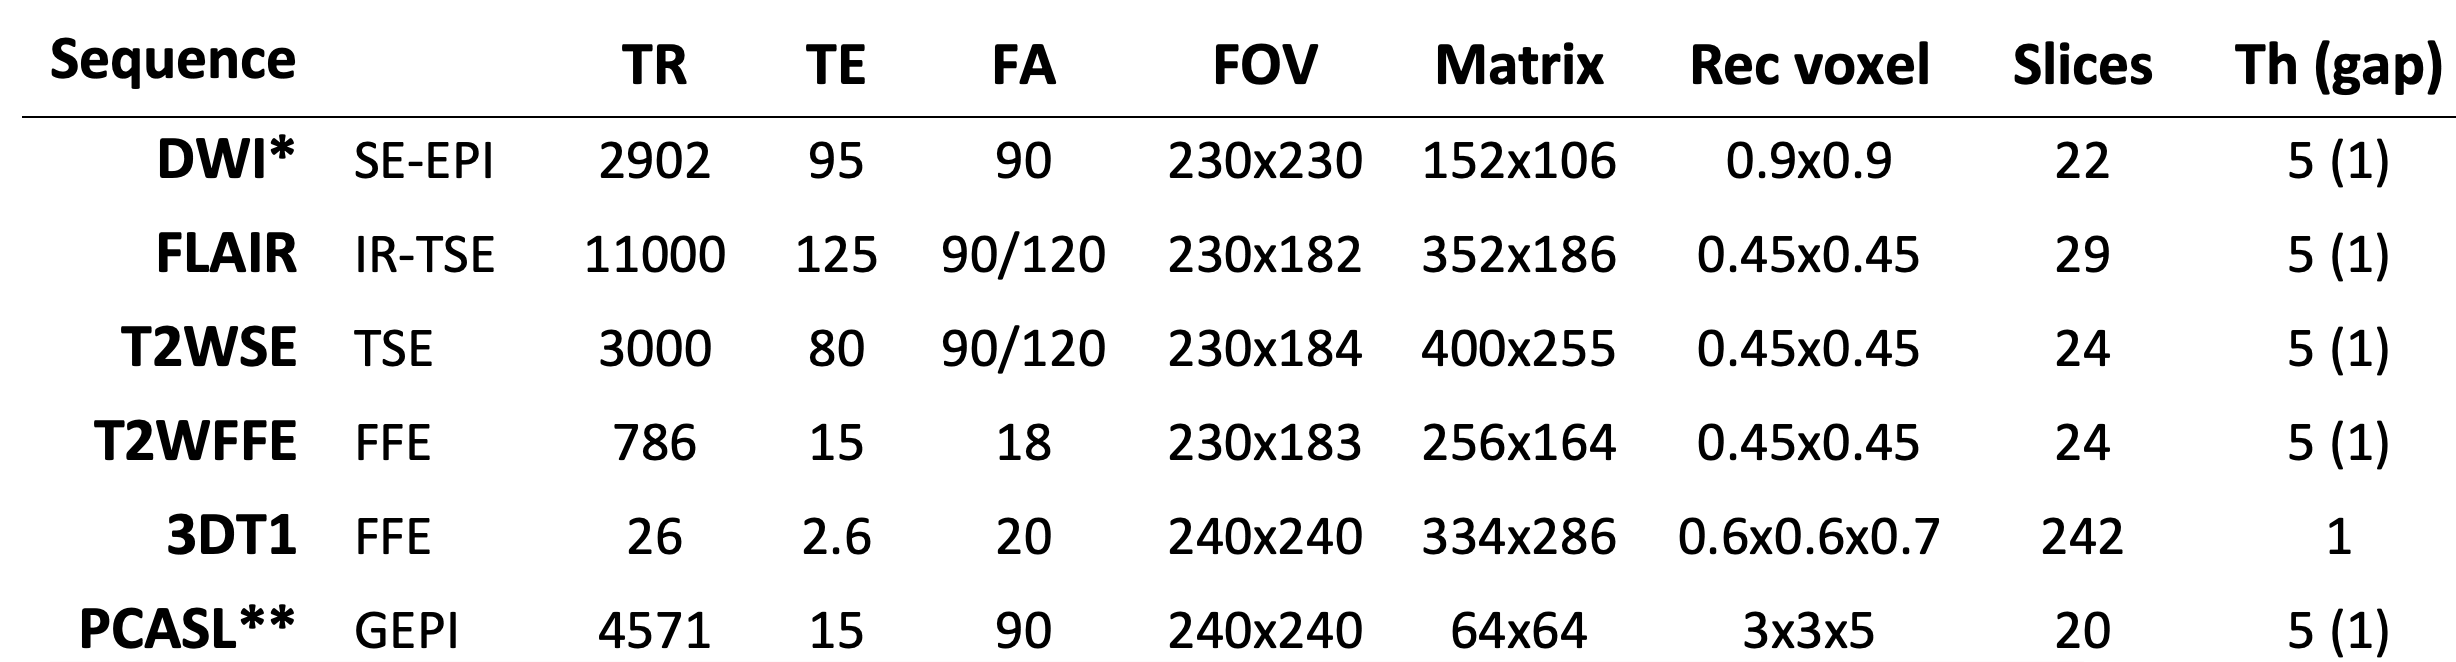
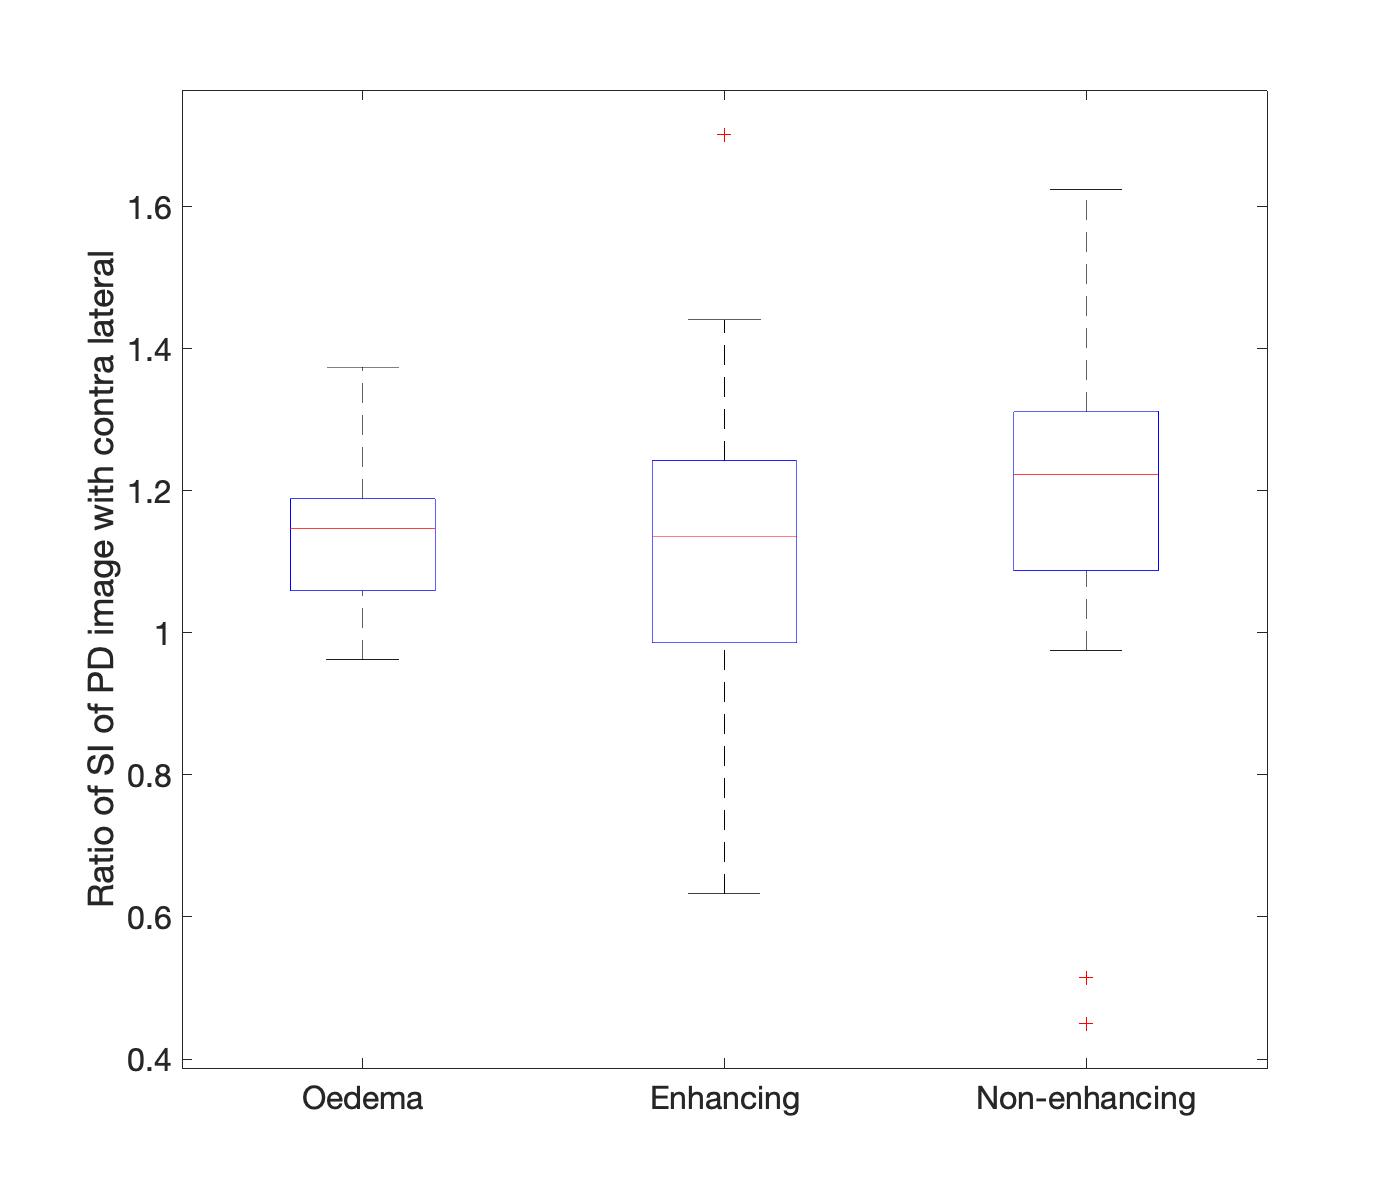
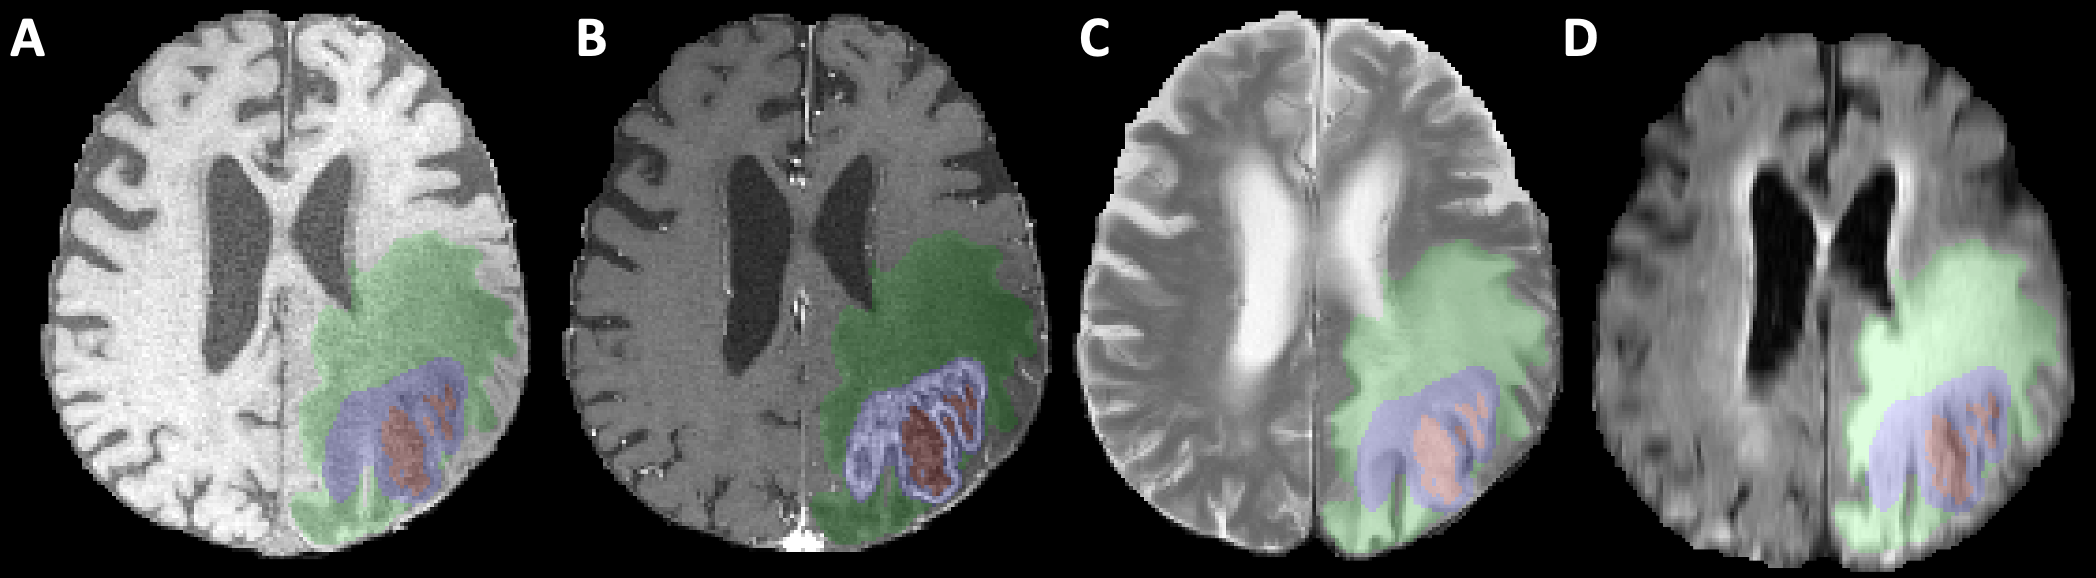
Figure 1. Example of AI tumour segmentation: red - non-enhancing tumour, blue - enhancing tumour, green - oedema displayed on A - T1W, B - gadT1W, C - T2W and D - FLAIR images.