1742
NODDI maximum abnormal signal area histogram analysis for differentiation between glioblastoma Multiforme and solitary brain metastasis1Department of MRI, The First Affiliated Hospital of Zhengzhou University, Zhengzhou, China, 2Magnetic Resonance Scientific Marketing, Siemens Healthineers Ltd., Shanghai, China, 3Magnetic Resonance Scientific Marketing, Siemens Healthineers Ltd., Wuhan, China
Synopsis
Keywords: Tumors, Diffusion/other diffusion imaging techniques, Neurite orientation dispersion and density imaging
We aim to explore the value of neurite orientation dispersion and density imaging (NODDI) maximum abnormal signal area histogram analysis for differentiation between glioblastoma Multiforme (GBM) and solitary brain metastasis (SBM). 50 patients with GBM and 50 patients with SBM confirmed by surgical pathology were enrolled and underwent MR examination. Result showed that multiple histogram parameters can significantly distinguish GBM from SBM, and the performance of logistic regression model is better than that of optimal single parameter.Introduction
Glioblastoma multiforme (GBM) and solitary brain metastasis (SBM) are common malignant brain tumors that may have similar imaging appearances to make differential diagnosis challenging. Neurite orientation dispersion and density imaging (NODDI) is a multi-sphere shell diffusion model based on the differences in diffusion of water molecules inside and out-side the cell1. NODDI can be used to quantize specific microstructure characteristics directly related to neuron morphology, and the new MRI technique is expected to provide more specific data on the microstructure changes of dendrites and axons than diffusion tensor imaging (DTI) and diffusion kurtosis imaging (DKI) analysis2,3. Kadota et al4 and Mao et al5 reported that NODDI has potential for distinguish GBM from SBM, however, the sample size was small and only mean value was analyzed, results in relatively low diagnostic performance. In previous studies, the regions of interests (ROIs) were usually placed on maximum cross-section or all-slice of tumor contrast-enhanced area or peritumoral edema area, and then the mean values were calculated4,6. Such a method is only a simple average of the tumor local characteristic values, which cannot specifically reflect the heterogeneity of tumor cells in the ROI region. Moreover, tumor local contrast-enhanced area or peritumoral edema area cannot reflect the overall heterogeneity of the tumor well, and may reduce tumor heterogeneity. Therefore, this study aimed to evaluate the value of histogram analysis based on NODDI maximum abnormal signal area (MASA, included the whole tumor area and peritumoral edema area) in differentiating between GBM and SBM.Methods
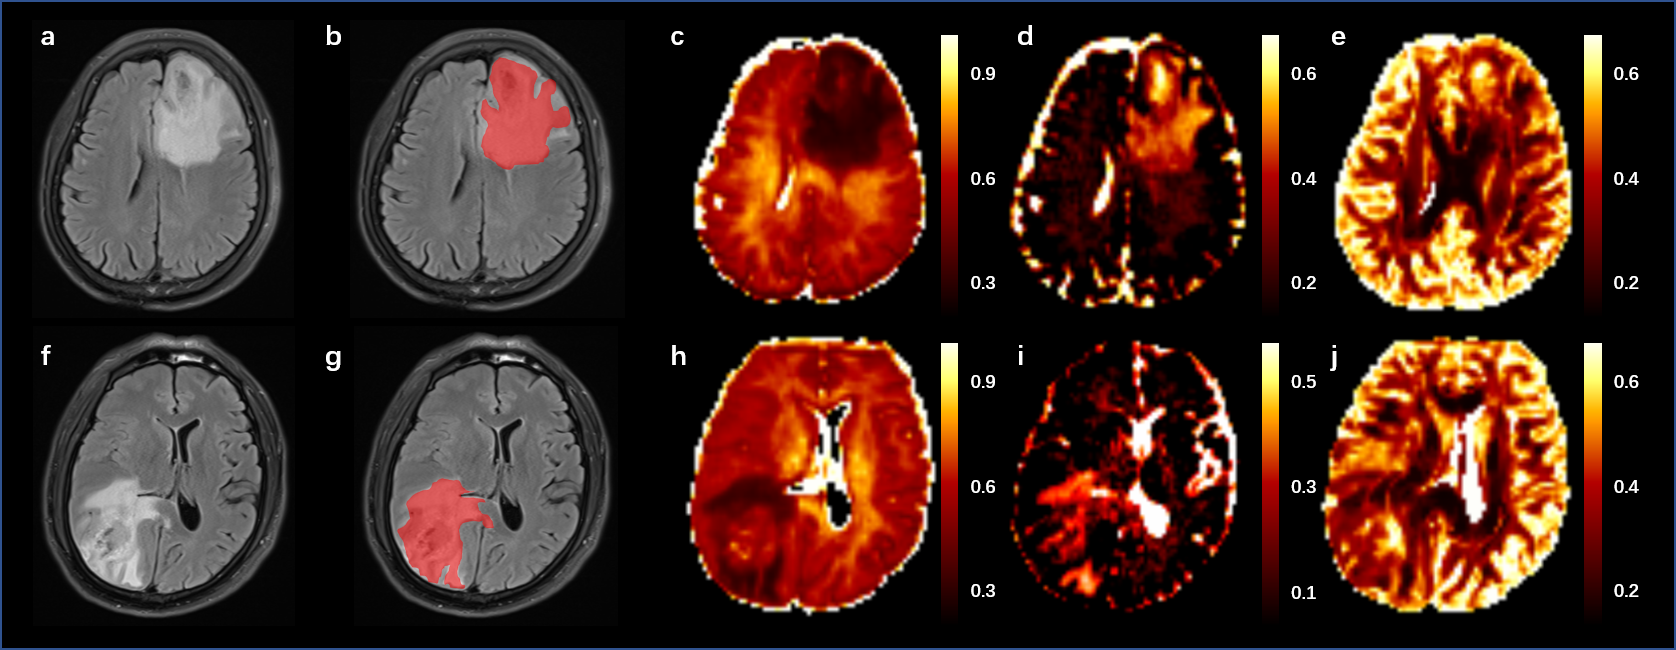
This study included 100 patients with GBM (n=50) or SBM (n=50) diagnosed by surgical histopathology who underwent MR examination within 7 days before surgery on a 3T system (MAGNETOM Prisma, Siemens Healthcare, Erlangen, Germany), which included axial T2-dark-fluid sequence and NODDI. The NODDI parameters were TR/TE = 2500/71ms; FOV = 220×220 mm; scan matrix = 100×100; 100 slices; five b values (500, 1000, 1500, 2000 and 2500 s/mm2) with 30 diffusion-encoding directions for each b value, and one b value of 0 s/mm2. An open source Amico tool (https://github.com/daducci/AMICO/) was used to fit NODDI parameter, and the parametric maps of isotropic volume fraction (ISOVF), intra-cellular volume fraction (ICVF) and orientation dispersion index (ODI) were obtained. The ROI was placed on MASA (Fig. 1). The histogram parameters (10 percentile (10th), 25 percentiles (25th), 50 percentiles (50th), 75 percentiles (75th), 90 percentiles (90th), mean, maximum (max), minimum (min), variance, skewness, and kurtosis) were extracted by MATLAB (version. R2017b; MathWorks, Natick, MA, USA). The gender distribution of patients was compared using the chi-square test. The differences of the NODDI histogram parameters and age distribution were compared using Mann–Whitney U test. Furthermore, the combination of these parameters was also studied by logistic regression analysis to discriminate GBM from SBM more accurately. Receiver operating characteristic (ROC) analyses and DeLong’s test were used to evaluate and compare the diagnosis performances of significant univariate parameters and logistic regression model, respectively. SPSS 26.0 (SPSS Inc., Chicago, IL, USA) and MedCalc 20.010 (MedCalc Software Ltd, Ostend, Belgium) were used for statistical analysis. Statistical significance was set at P < 0.05.Result
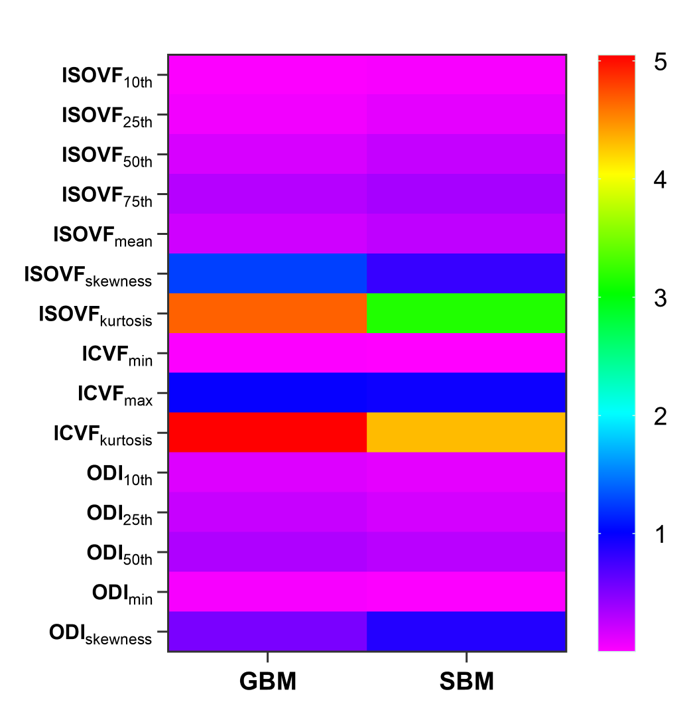
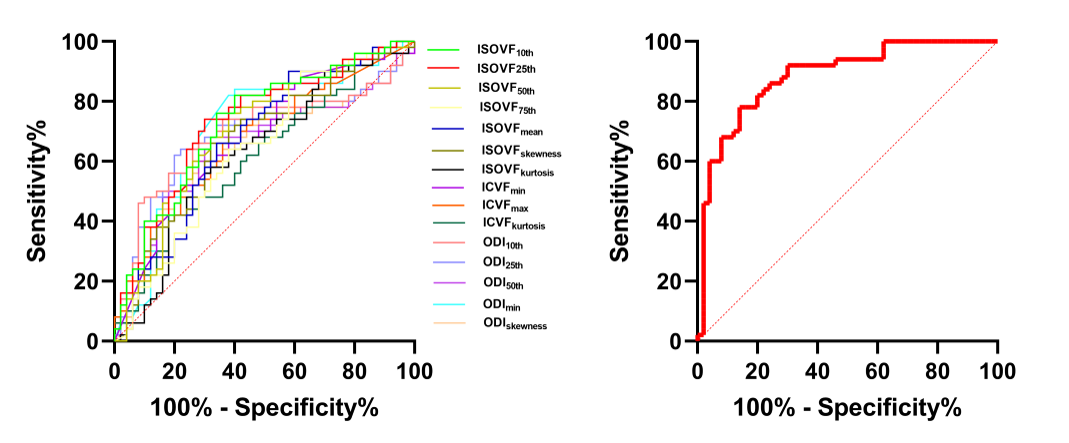
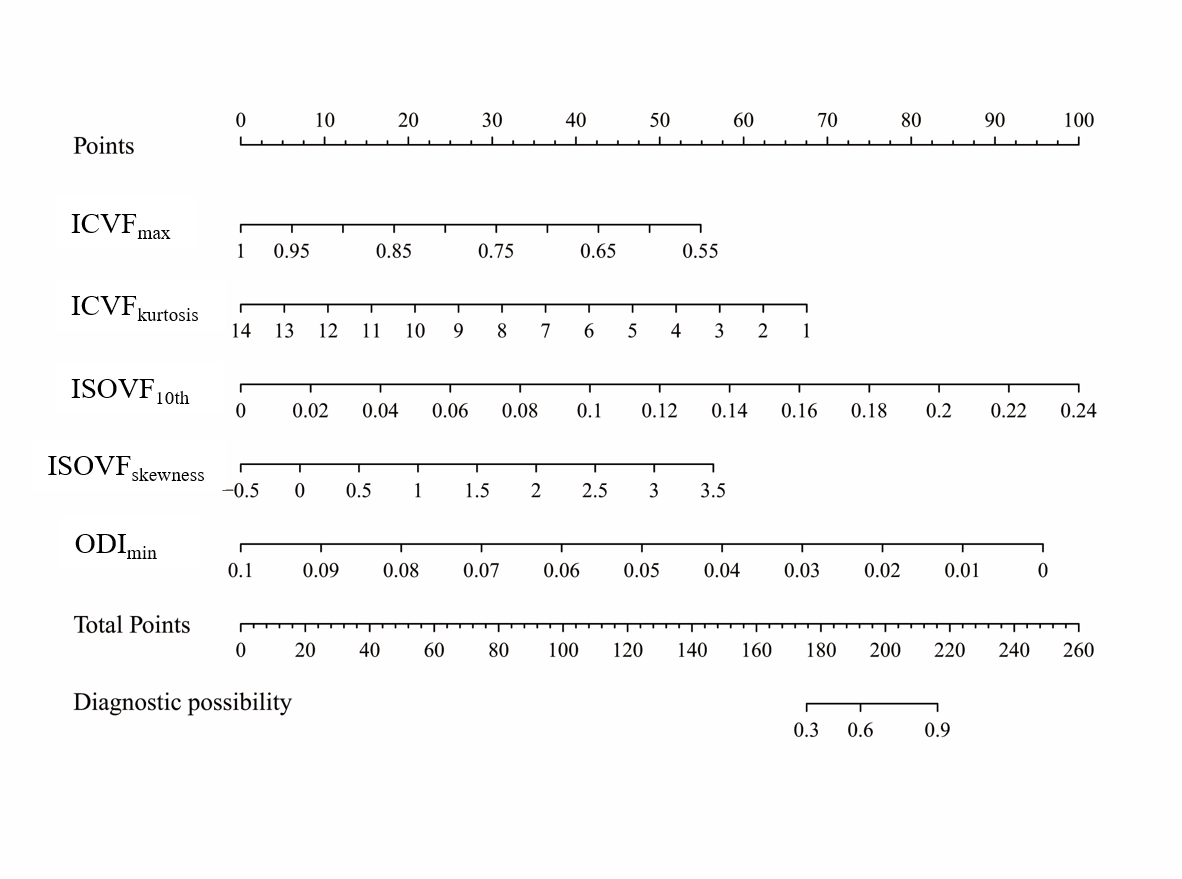
No significant difference in gender (p=0.655) or age distribution (p=0.647) between GBM and SBM. Significant differences were noted for differentiation between GBM and SBM in ISOVF10th, ISOVF25th, ISOVF50th, ISOVF75th, ISOVFmean, ISOVFskewness, ISOVFkurtosis, ICVFmin, ICVFmax, ICVFkurtosis, ODI10th, ODI25th, ODI50th, ODImin, and ODIskewness. Among them, the ISOVFskewness, ISOVFkurtosis, ICVFmin, ICVFmax, ICVFkurtosis, ODI10th, ODI25th, ODI50th, and ODImin of GBM are higher than SBM, and the other parameters are lower than SBM (Fig. 2). In univariate analysis, the ISOVF25th obtained the highest diagnostic performance, with AUC, sensitivity and specificity of 0.731, 74.00% and 68.00%, respectively. The ICVFmax, ICVFkurtosis, ISOVF25th, ISOVFskewness, and ODImin were finally incorporated into the regression equation to build logistic regression model. The AUC, sensitivity and specificity of logistic regression model were 0.884, 78.00% and 86.00%, respectively (Fig. 3). DeLong’s test revealed that the AUC of ISOVF25th was significantly different from that of logistic regression model (p=0.028). Finally, the logistic regression model is visualized by nomogram (Fig. 4).Discussion
This study evaluated the value of histogram analysis based on NODDI-MASA to distinguish GBM from SBM. Results showed that multiple histogram parameters can distinguish GBM from SBM, and the performance is better than previous studies. This may be because histogram parameter extraction based on MASA of the tumor may reflect the tumor heterogeneity more accurately and reliably and can also avoid or reduce the sampling error caused by delineating local ROI as much as possible7. In univariate analysis, the ISOVF25th had the highest differential performance, reflecting isotropic diffusion within the tissue, which was closely related to the pathogenesis of the two tumors8. However, the univariate analysis may have some limitations and cannot be analyzed comprehensively. A logistic regression model was constructed, which greatly improved the differential performance of the two tumors. Meanwhile, the prediction model can be visualized by nomogram to transform the abstract mathematical model into quantitative score evaluation and provide objective identification basis for clinical diagnosis.Conclusion
NODDI-MASA histogram analysis is helpful in differentiating GBM from SBM, in which the logistic regression model has the best diagnostic performance.Acknowledgements
We are deeply grateful to our participants and their families for their generous support for our study.References
1. Zhang H, Schneider T, Wheeler-Kingshott CA, Alexander DC. NODDI: practical in vivo neurite orientation dispersion and density imaging of the human brain. Neuroimage. 2012;61(4):1000-1016.
2. Metz MC, Molina-Romero M, Lipkova J, et al. Predicting Glioblastoma Recurrence from Preoperative MR Scans Using Fractional-Anisotropy Maps with Free-Water Suppression. Cancers (Basel). 2020;12(3):728. Published 2020 Mar 19.
3. Qi XX, Shi DF, Ren SX, et al. Histogram analysis of diffusion kurtosis imaging derived maps may distinguish between low and high grade gliomas before surgery. Eur Radiol. 2018;28(4):1748-1755.
4. Kadota Y, Hirai T, Azuma M, et al. Differentiation between glioblastoma and solitary brain metastasis using neurite orientation dispersion and density imaging. J Neuroradiol. 2020;47(3):197-202.
5. Mao J, Zeng W, Zhang Q, et al. Differentiation between high-grade gliomas and solitary brain metastases: a comparison of five diffusion-weighted MRI models. BMC Med Imaging. 2020;20(1):124. Published 2020 Nov 23.
6. Zhang G, Chen X, Zhang S, et al. Discrimination Between Solitary Brain Metastasis and Glioblastoma Multiforme by Using ADC-Based Texture Analysis: A Comparison of Two Different ROI Placements. Acad Radiol. 2019;26(11):1466-1472.
7. Wang P, Gao E, Qi J, et al. Quantitative analysis of mean apparent propagator-magnetic resonance imaging for distinguishing glioblastoma from solitary brain metastasis. Eur J Radiol. 2022;154:110430.
8. Gao A, Zhang H, Yan X, et al. Whole-Tumor Histogram Analysis of Multiple Diffusion Metrics for Glioma Genotyping [published correction appears in Radiology. 2022 Mar;302(3):E16]. Radiology. 2022;302(3):652-661.
Figures