1740
3D mTI-ASL perfusion for differentiating 1p/19q status in IDH1-mutant lower grade gliomas1Beijing Neurosurgical Institute/Beijing Tiantan Hospital, Capital Medical University, Beijing, China, 2MR Collaboration, Siemens Healthineers Ltd., Beijing, China
Synopsis
Keywords: Tumors, Arterial spin labelling
This study investigated the feasibility of using local maximum cerebral blood flow (maxCBF) in tumor area measured with multi-inversion-time ASL (mTI-ASL) to preoperatively predict the 1p/19q status in patients with IDH1-mutant lower-grade glioma (LGG). Mann-Whitney U test showed that maxCBF in the tumor region was significantly higher in 1p/19q Non-Codeleted group than Codeleted group. ROC showed maxCBF achieved high sensitivity (0.7) and specificity (0.737) in differentiation of IDH1-mutant-LGGs with distinct 1p/19q status. This finding suggested that ASL-derived maxCBF has the potential as a tool for the noninvasive preoperative characterization of 1p/19q status, thus providing evidence for individualized treatment planning.
Introduction
Glioma is the most common primary malignant brain tumor. According to the 2016 WHO criteria, lower-grade glioma (LGG, 2016 WHO grade Ⅱ-Ⅲ) is diagnosed combining histologic and molecular features, including isocitrate dehydrogenase (IDH) mutation status and 1p/19q-codeletion status 1. LGG patients with IDH1-mutant progresses more slowly and has a better prognosis than IDH1-wild type. New classification criteria further classified LGG patients with IDH1-mutant into 1p/19q co-deletions and non-deletion groups 2. Preoperatively identifying 1p/19q status in IDH1-mutant gliomas can further improve the prediction of patient outcomes and allow for a more accurate individualized treatment.Arterial spin labeling (ASL) is a completely non-invasive MR imaging method that can be used for measurement of cerebral blood flow (CBF). Recent development of multi-inversion time ASL (mTI-ASL) technique also allows it to quantify the bolus arrival time (BAT) besides CBF3. Previous studies has suggested that ASL is promising to discriminate high-grade and low-grade glioma4. However,the number of studies about the diagnostic performance of ASL to predict IDH genotype and 1p/19q codel in LGG is limited. The maximum CBF (maxCBF) in the tumor area has been reported to be more informative for glioma diagnosis5. Thus, the aim of this study was to classify 1p/19q status of IDH1-mutant LGG based on maxCBF in the tumor region derived from preoperative mTI-ASL images.
Methods
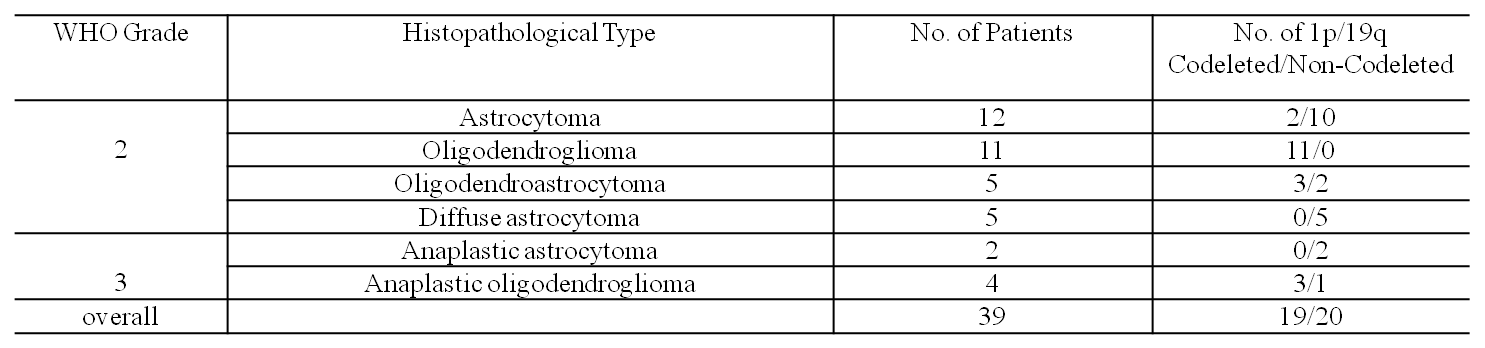
Thirty-nine patients with histologically confirmed IDH1-mutant LGGs were enrolled in this study. The IDH (IDH1, codon 132) and 1p/19q status were confirmed by immunohistochemical results. The pathological types and grades, as well as 1p/19q status of gliomas were summarized in Table 1.MRI Data were acquired on a 3T scanner (MAGNETOM Prisma, Siemens Healthcare, Erlangen, Germany) with a 20-channel head/neck coil. The scan protocol included: 3D T1 MPRAGE (TR/TE=2300/2.3ms, resolution=0.9*0.9*0.9mm3), 3D T2 FLAIR (TR/TE=5000/387ms, resolution=0.9*0.9*0.9mm3) and 3D ASL imaging. The ASL imaging were performed using a prototype pCASL sequence with the following parameters: 3D GRASE imaging with PICORE Q2TIPS labeling, TR 4350 ms, TE 20.9 ms, slice thickness 4 mm, bolus duration 1800ms, 16 TIs of 500-3950 ms with increments of 230 ms, total acquisition time 4:55 mins including an M0 scan. The calculation of CBF for a multi-TI series is based on the original formulation of Buxton et al 6.
For the tumor segmentation, a modified 3D U-net convolutional neural network (CNN) architecture proposed by Isensee et al7 was revised to use only T2 FLAIR images as network inputs and yield whole tumor segmentation. Then, the tumor segmentation results were manually corrected by an experienced radiologist in our group and used as the tumor mask. A cube region of interest (ROI) including 125 voxels was drawn around the brightest area within the tumor mask on the CBF map. The mean value in the obtained ROI represented the maxCBF of the tumor.
Statistical analyses were performed with SPSS (IBM, version 22). The quantitative maxCBF values were compared between 1p/19q co-deletions and non-deletion groups by using the Mann-Whitney U test. The α level was set at 0.05 for statistical significance. ROC curves were performed for maxCBF values to assess the area under the curve (AUC) and find the best cutoff value to discriminate 1p/19q co-deletions and non-deletion in IDH1-mutant LGG patients.
Results
Table 1 summarizes the patient pathological types and tumor grade, as well as 1p/19q status. The 1p/19q non-deletion group included 20 patients and 1p/19q co-deletions group included 19 patients.Figure 1 shows an example of T2 FLAIR, tumor segmentation mask on T2 FLAIR, CBF and maxCBF within the whole tumor mask region on the CBF map for an anaplastic oligodendroglioma.
As shown in Figure 2a, the maxCBF in the 1p/19q non-deletion group (125.17±35.88mL/100 g/min) was significantly higher (p =0.013) than the 1p/19q co-deletions group (96.29±22.31mL/100 g/min). Figure 2b shows the ROC analysis results with the AUC, sensitivity, and specificity were 0.732, 0.7 and 0.737, respectively. The ROC analysis of maxCBF showed high discrimination ability between 1p19q non-deletion and co-deletion with the optimal cutoff value of 105.2 mL/100 g/min.
Discussion and conclusion
Since accurate classification of 1p/19q statue has important clinical value, this study evaluated the diagnostic efficacy of maxCBF value derived from mTI-ASL to classify 1p/19q status in IDH1-mutant LGG patients. The most important findings were the maxCBF within tumor region is significantly higher in 1p/19q non-deletion group than in co-deletions group, and the cerebral blood flow threshold value determined by the ROC curve could be easily obtained using mTI-ASL without contrast enhancement scanning. Taken together, these results suggest that ASL may help classify the status of 1p/19q in IDH1-mutant LGG patients before surgery. The current study indicated that the maxCBF in tumor region were closely associated with 1p/19q status. However, the population was small in this study, and further investigations should enlarge the sample size to explore the association of CBF with 1p/19q status.Acknowledgements
No acknowledgement found.References
1. Wu S, Zhang X, Rui W, et al. A nomogram strategy for identifying the subclassification of IDH mutation and ATRX expression loss in lower-grade gliomas. Eur Radiol. 2022;32(5):3187-3198. doi:10.1007/s00330-021-08444-1
2. Li Y, Wei D, Liu X, et al. Molecular subtyping of diffuse gliomas using magnetic resonance imaging: comparison and correlation between radiomics and deep learning. Eur Radiol. 2022;32(2):747-758. doi:10.1007/s00330-021-08237-6
3. Martin SZ, Madai VI, von Samson-Himmelstjerna FC, et al. 3D GRASE Pulsed Arterial Spin Labeling at Multiple Inflow Times in Patients with Long Arterial Transit Times: Comparison with Dynamic Susceptibility-Weighted Contrast-Enhanced MRI at 3 Tesla. J Cereb Blood Flow Metab. 2015;35(3):392-401. doi:10.1038/jcbfm.2014.200
4. Falk Delgado A, De Luca F, van Westen D, Falk Delgado A. Arterial spin labeling MR imaging for differentiation between high- and low-grade glioma—a meta-analysis. Neuro Oncol. 2018;20(11):1450-1461. doi:10.1093/neuonc/noy095
5. Batalov AI, Zakharova NE, Pronin IN, et al. 3D pCASL-perfusion in preoperative assessment of brain gliomas in large cohort of patients. Sci Rep. 2022;12(1):2121. doi:10.1038/s41598-022-05992-4
6. Buxton RB, Frank LR, Wong EC, Siewert B, Warach S, Edelman RR. A general kinetic model for quantitative perfusion imaging with arterial spin labeling. Magn Reson Med. 1998;40(3):383-396. doi:10.1002/mrm.1910400308
7. Isensee F, Kickingereder P, Wick W, Bendszus M, Maier-Hein KH. Brain Tumor Segmentation and Radiomics Survival Prediction: Contribution to the BRATS 2017 Challenge. In: Lecture Notes in Computer Science (Including Subseries Lecture Notes in Artificial Intelligence and Lecture Notes in Bioinformatics). ; 2018:287-297. doi:10.1007/978-3-319-75238-9_25
Figures
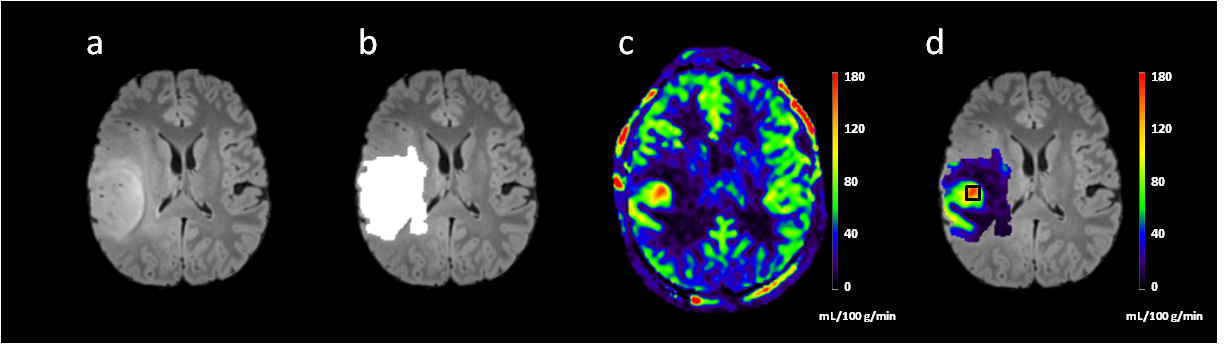
Figure 1. MR images of a 16-year-old male diagnosed with anaplastic oligodendroglioma ,WHO grade Ⅲ.(a)T2 FLAIR shows high intense mass in the left frontoparietal lobe. (b) the white region is the segmented brain tumor mask (c) CBF image showed hyperperfusion in the tumor region. (d) a cube ROI drawn around the brightest area within the tumor mask on the CBF map.
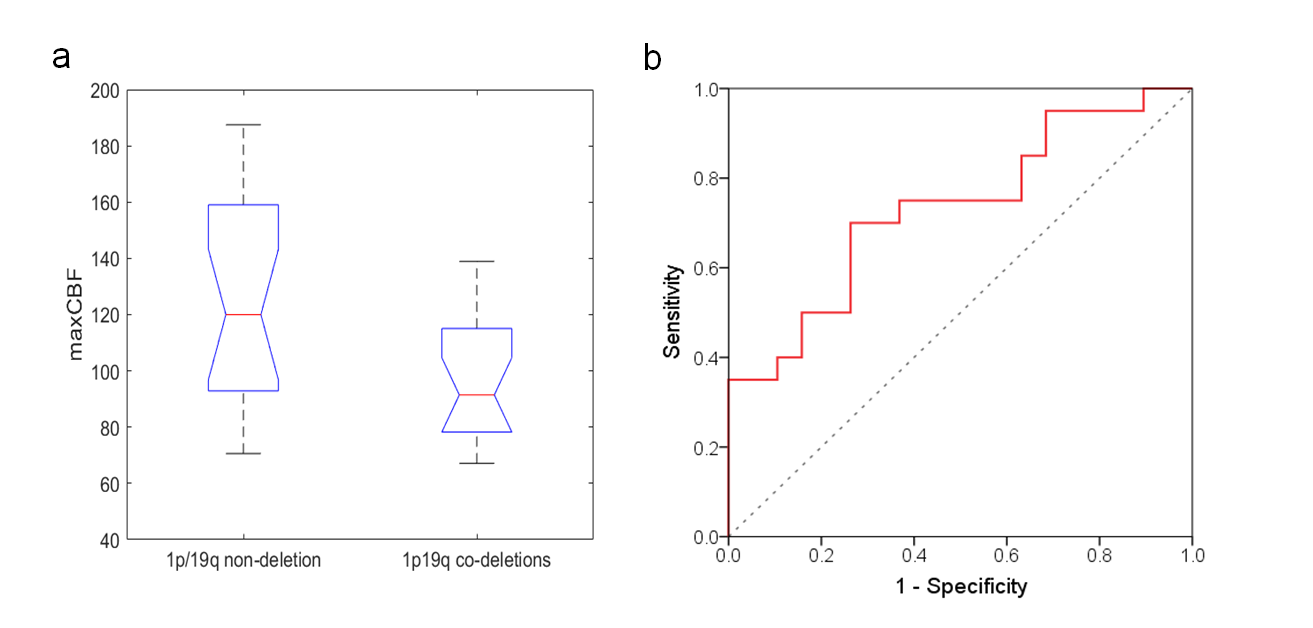
Figure 2. (a) Boxplots of maxCBF in 1p/19q non-deletion and 1p/19q co-deletions IDH1-mutant LGG patients. (b) The ROC curve for the maxCBF in differentiating the 1p/19q non-deletion and 1p/19q co-deletions groups. The maxCBF has a good diagnostic performance with an AUC of 0.732.