1736
Free Water Imaging in deep gray matter nucleus of Wilson’s Disease1Department of Neurology, Tongren Hospital, Shanghai Jiao Tong University School of Medicine, Shanghai, China, 2Shanghai Key Laboratory of Magnetic Resonance, East China Normal University, Shanghai, China, 3East China Normal University, Shanghai, China, 4Department of Neurology, Weifang People's Hospital, Weifang, China, 5Department of Neurology, Jiading Branch of Shanghai General Hospital, Shanghai Jiao Tong University School of Medicine, Shanghai, China
Synopsis
Keywords: Neurodegeneration, Diffusion/other diffusion imaging techniques, Wilson’s disease; free water imaging; quantitative susceptibility mapping.
This is the first study to use a bi-tensor free water imaging to evaluate microstructural changes in deep gray matter (DGM) nuclei of Wilson’s disease (WD). Despite the shortcomings our study manifested that free water imaging detects microstructural alterations in both normal and abnormal appearing DGM nuclei of WD patients. Correlations between free water imaging indices and neurological impairment in WD patients were also noticed. Therefore, as a promising tool, free water imaging deserves further investigation in longitudinal studies to evaluate its role in monitoring disease onset, progression, and treatment efficacy in WD patients.Introduction
The bi-tensor free water imaging may provide more specific information in detecting microstructural brain tissue alterations than conventional single tensor diffusion tensor imaging1,2. The study aimed to investigate microstructural changes in deep gray matter (DGM) nuclei of Wilson’s disease (WD) using a bi-tensor free water imaging and whether the findings correlate with the neurological impairment in WD patients.Methods
Nineteen patients with neurological form of WD (neuro-WD), 10 patients with hepatic form of WD (hep-WD), and 25 controls were enrolled in the study. Diffusion tensor images and quantitative susceptibility mapping (QSM) were acquired from all subjects using a 3T MRI system.DTI data preprocessing was first performed using FMRIB’s Software Library (FSL)3. The FSL function was applied to correct eddy and head motion with the reference volume set as the default at 0. The gradient directions were rotated in response to the eddy current corrections, and nonbrain tissue was removed from the diffusion volumes using BET. Then, free water maps and free water-corrected diffusion tensor maps were computed from eddy-and motion-corrected volumes using an open-source library diffusion in python, which implemented a minimization procedure that fits a bi-tensor model4. Finally, FAT maps were calculated from free water-corrected tensor maps. QSM reconstruction was performed using the Morphology Enabled Dipole Inversion toolbox, including phase unwrapping, field fitting, background field removal and field-to-source inversion5.
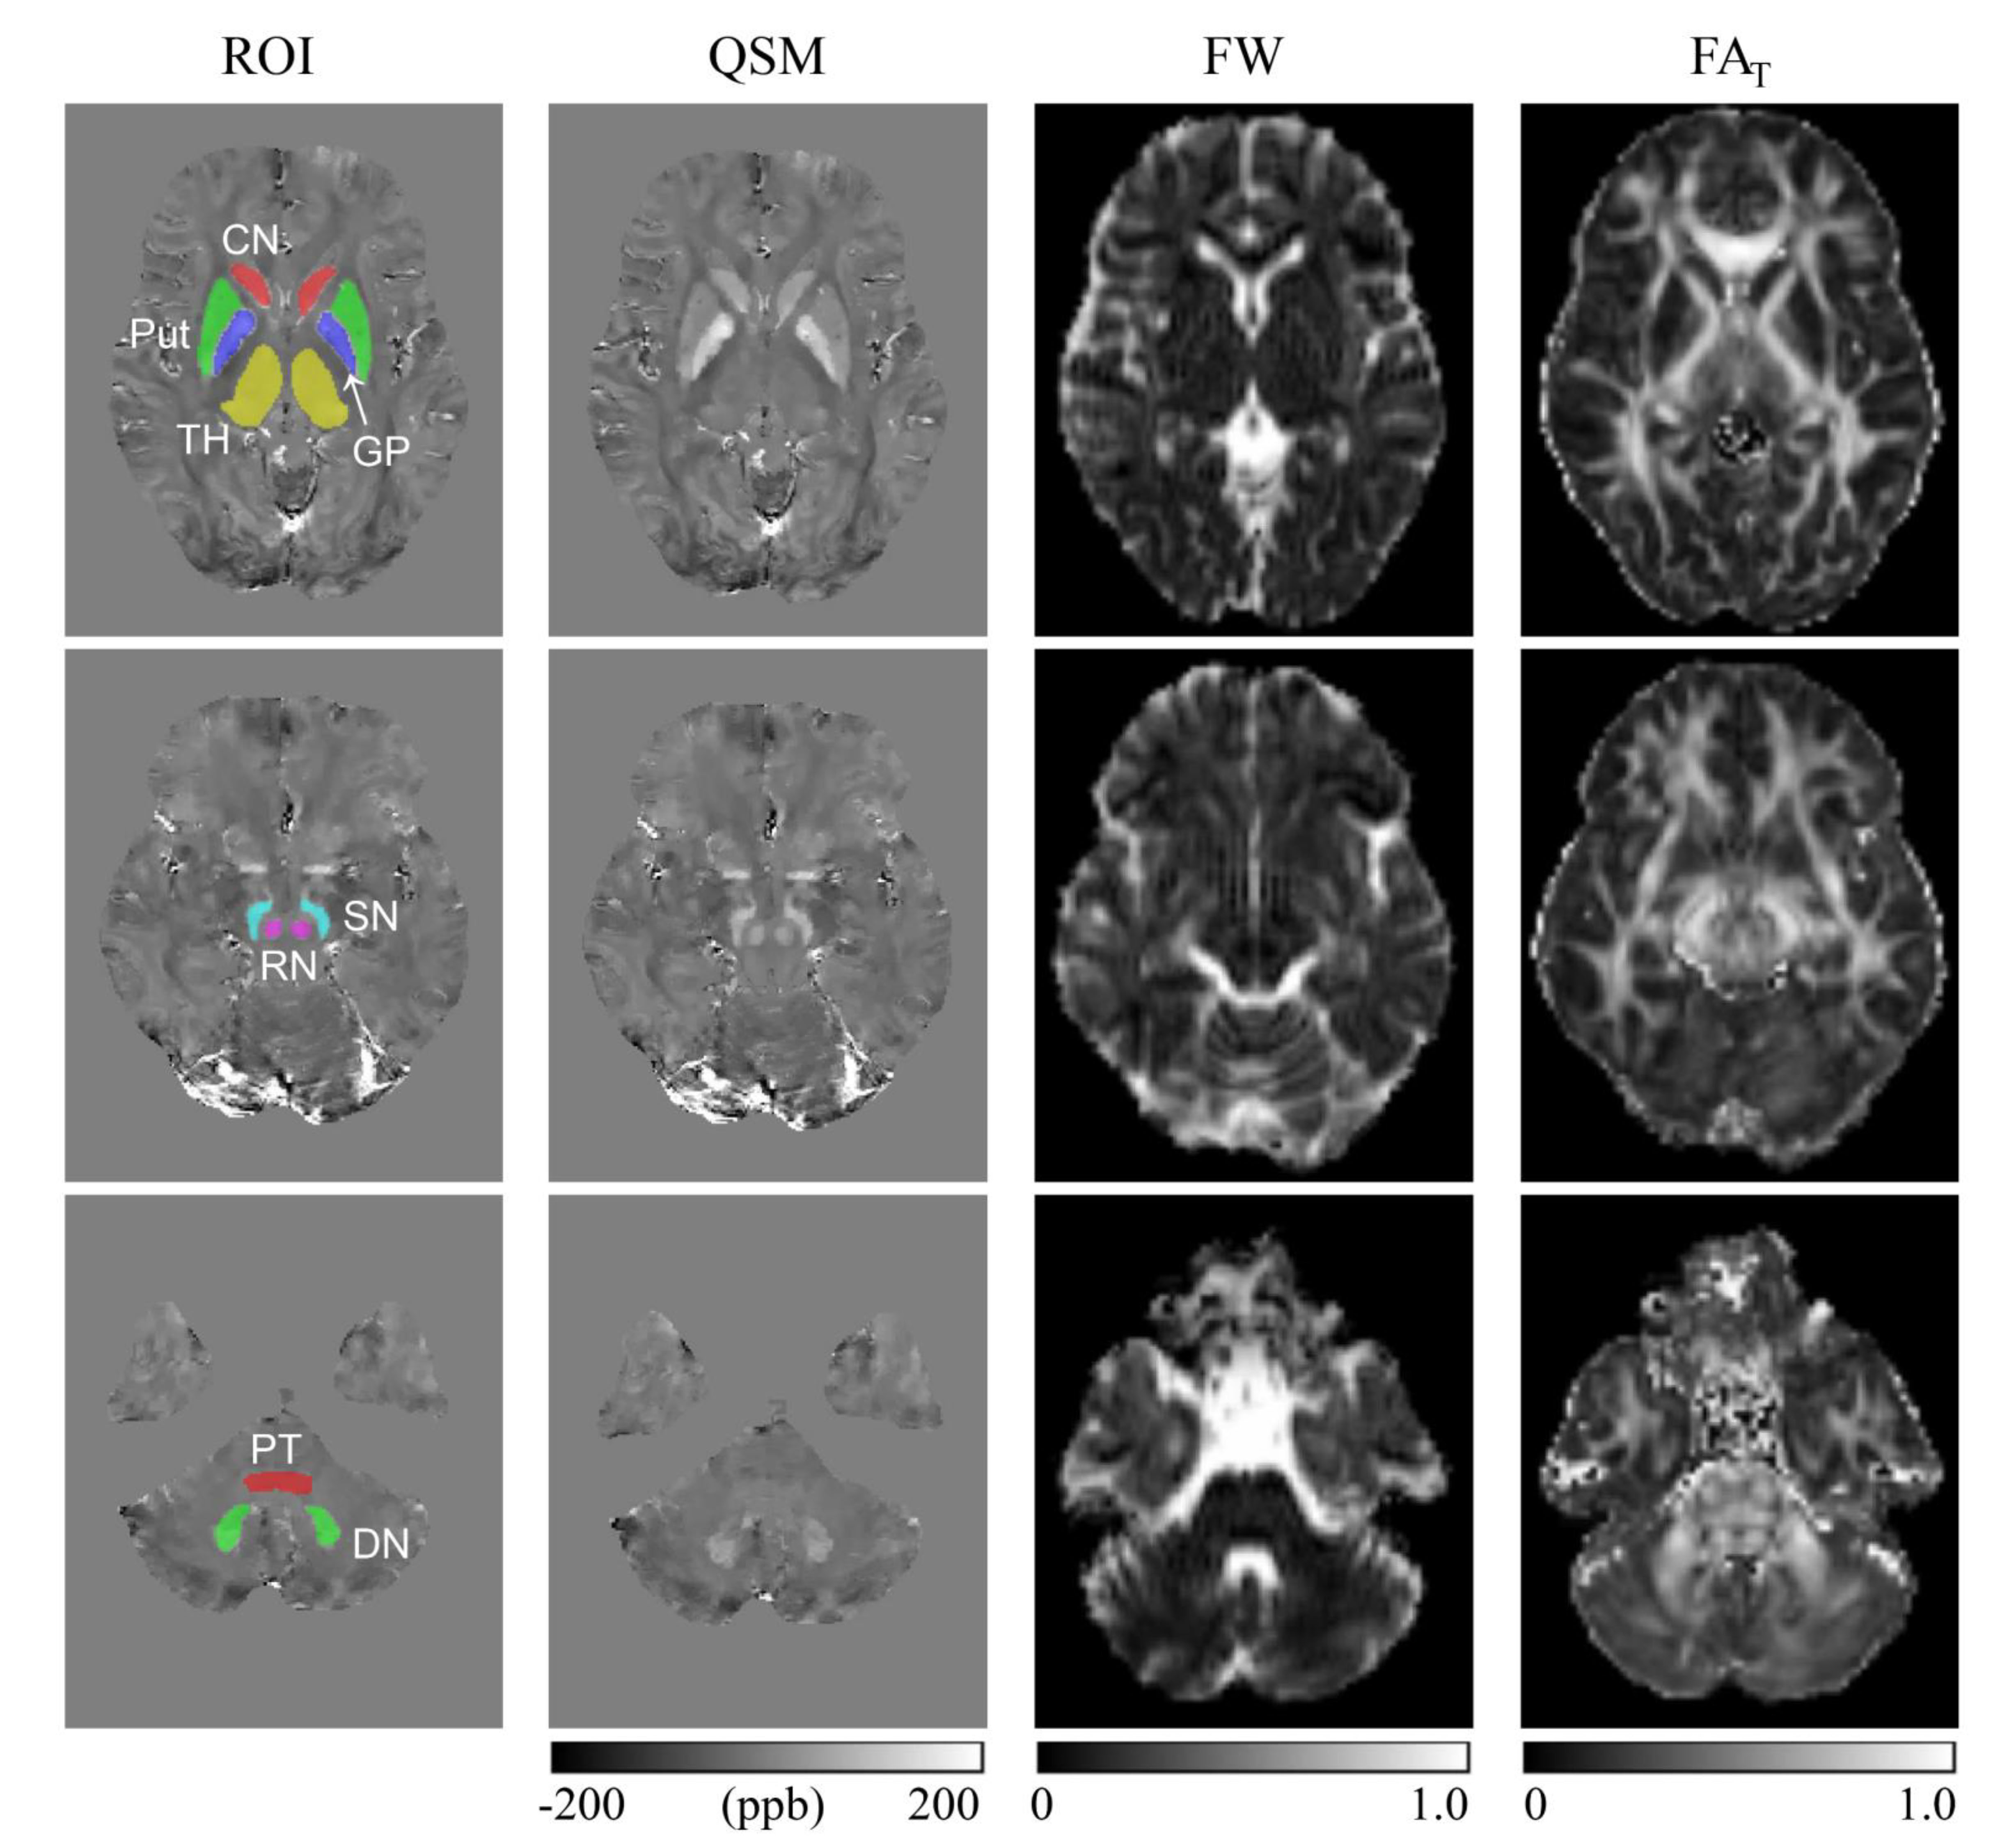
Regions of interest (ROIs) including pontine tegmentum (PT), bilateral head of the caudate nucleus (CN), dentate nucleus (DN), globus pallidus (GP), putamen (Put), red nucleus (RN), substantia nigra (SN), and thalamus (TH). ROIs were segmented manually on the susceptibility maps using insight toolkit-snake automatic partitioning software by 2 neurologists. To maintain quantitative accuracy, the b0 images were linearly registered to the first echo magnitude images from the GRE sequence using FMRIB's linear image registration tool from FSL. The generated transformation matrix was applied to free water maps and FAT maps for registration. ROIs segmented on QSM images were applied to free water maps and FAT maps after registration (Fig. 1). Mean free water and FAT values within ROIs were calculated for further statistical analysis.
Continuous variables between three groups were compared with one-way analysis of variance and post-hoc comparisons between groups were corrected by Bonferroni correction. Multiple comparisons between groups were rectified by false discovery rate correction. Adjusted P < 0.05 indicates a significant difference. Correlations of free water and FAT values with clinical parameters were evaluated by calculating the partial correlation coefficient to control for differences in age, sex, and course of disease.
Results
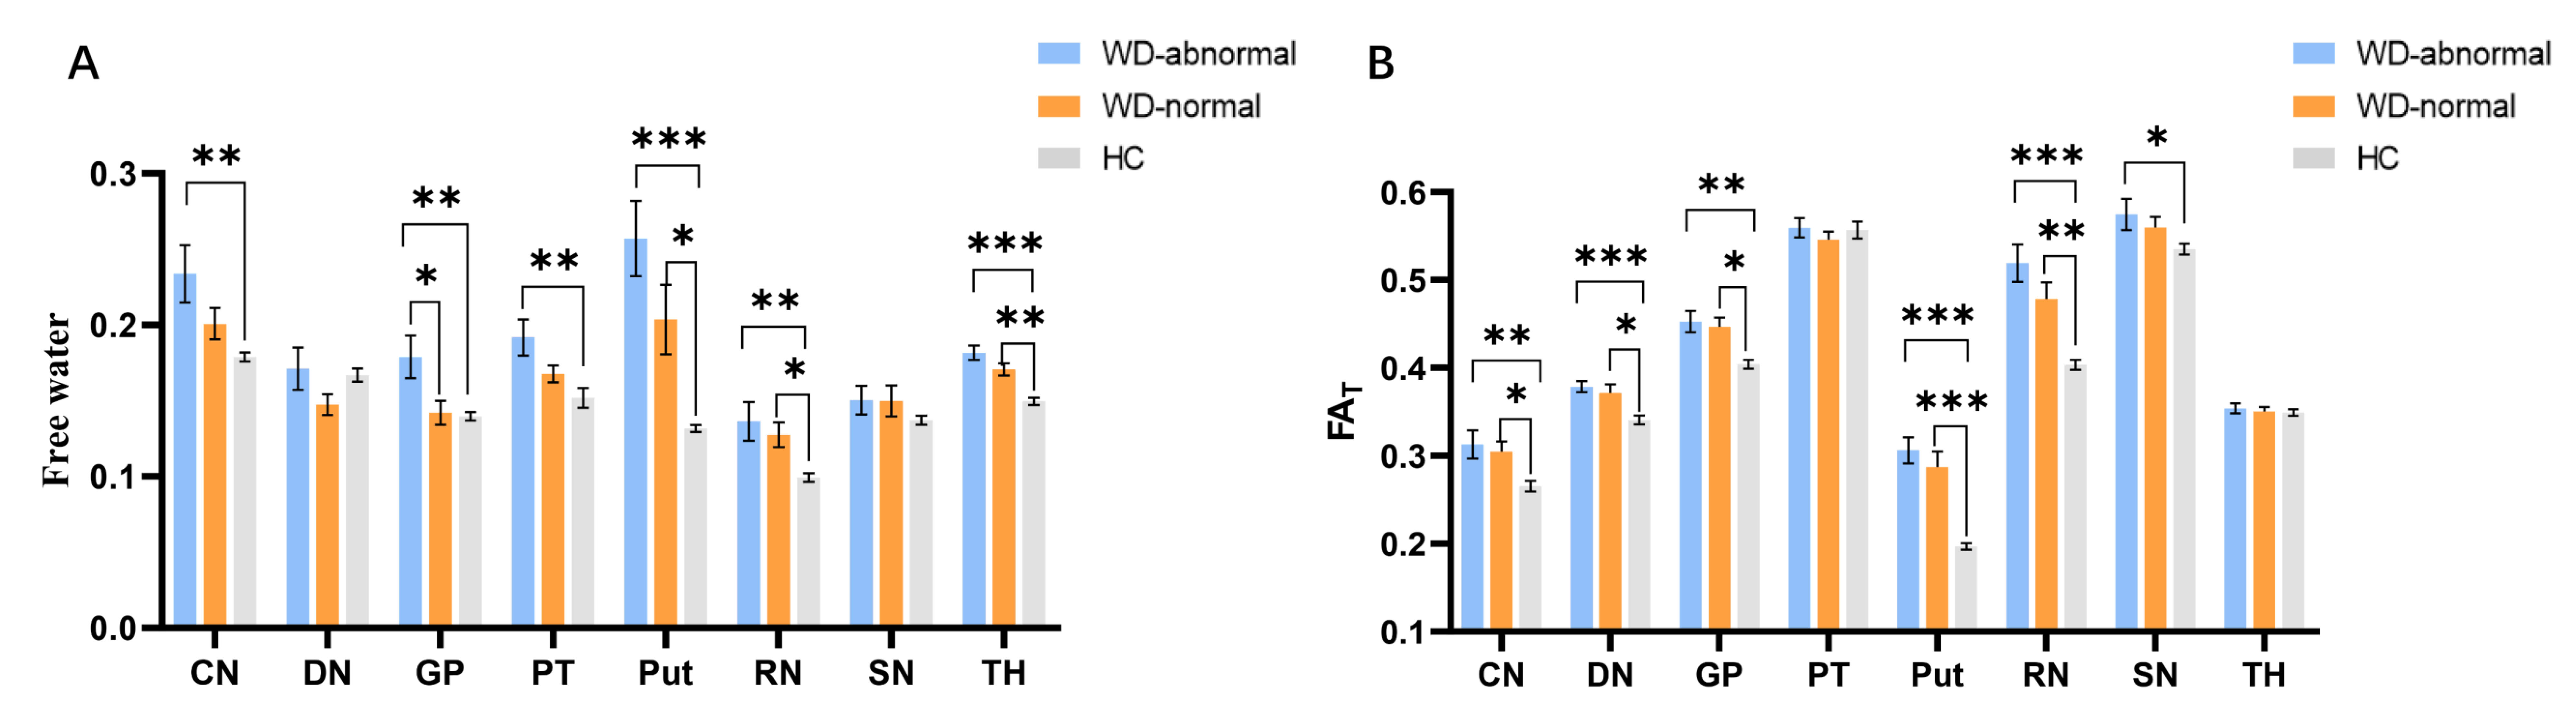
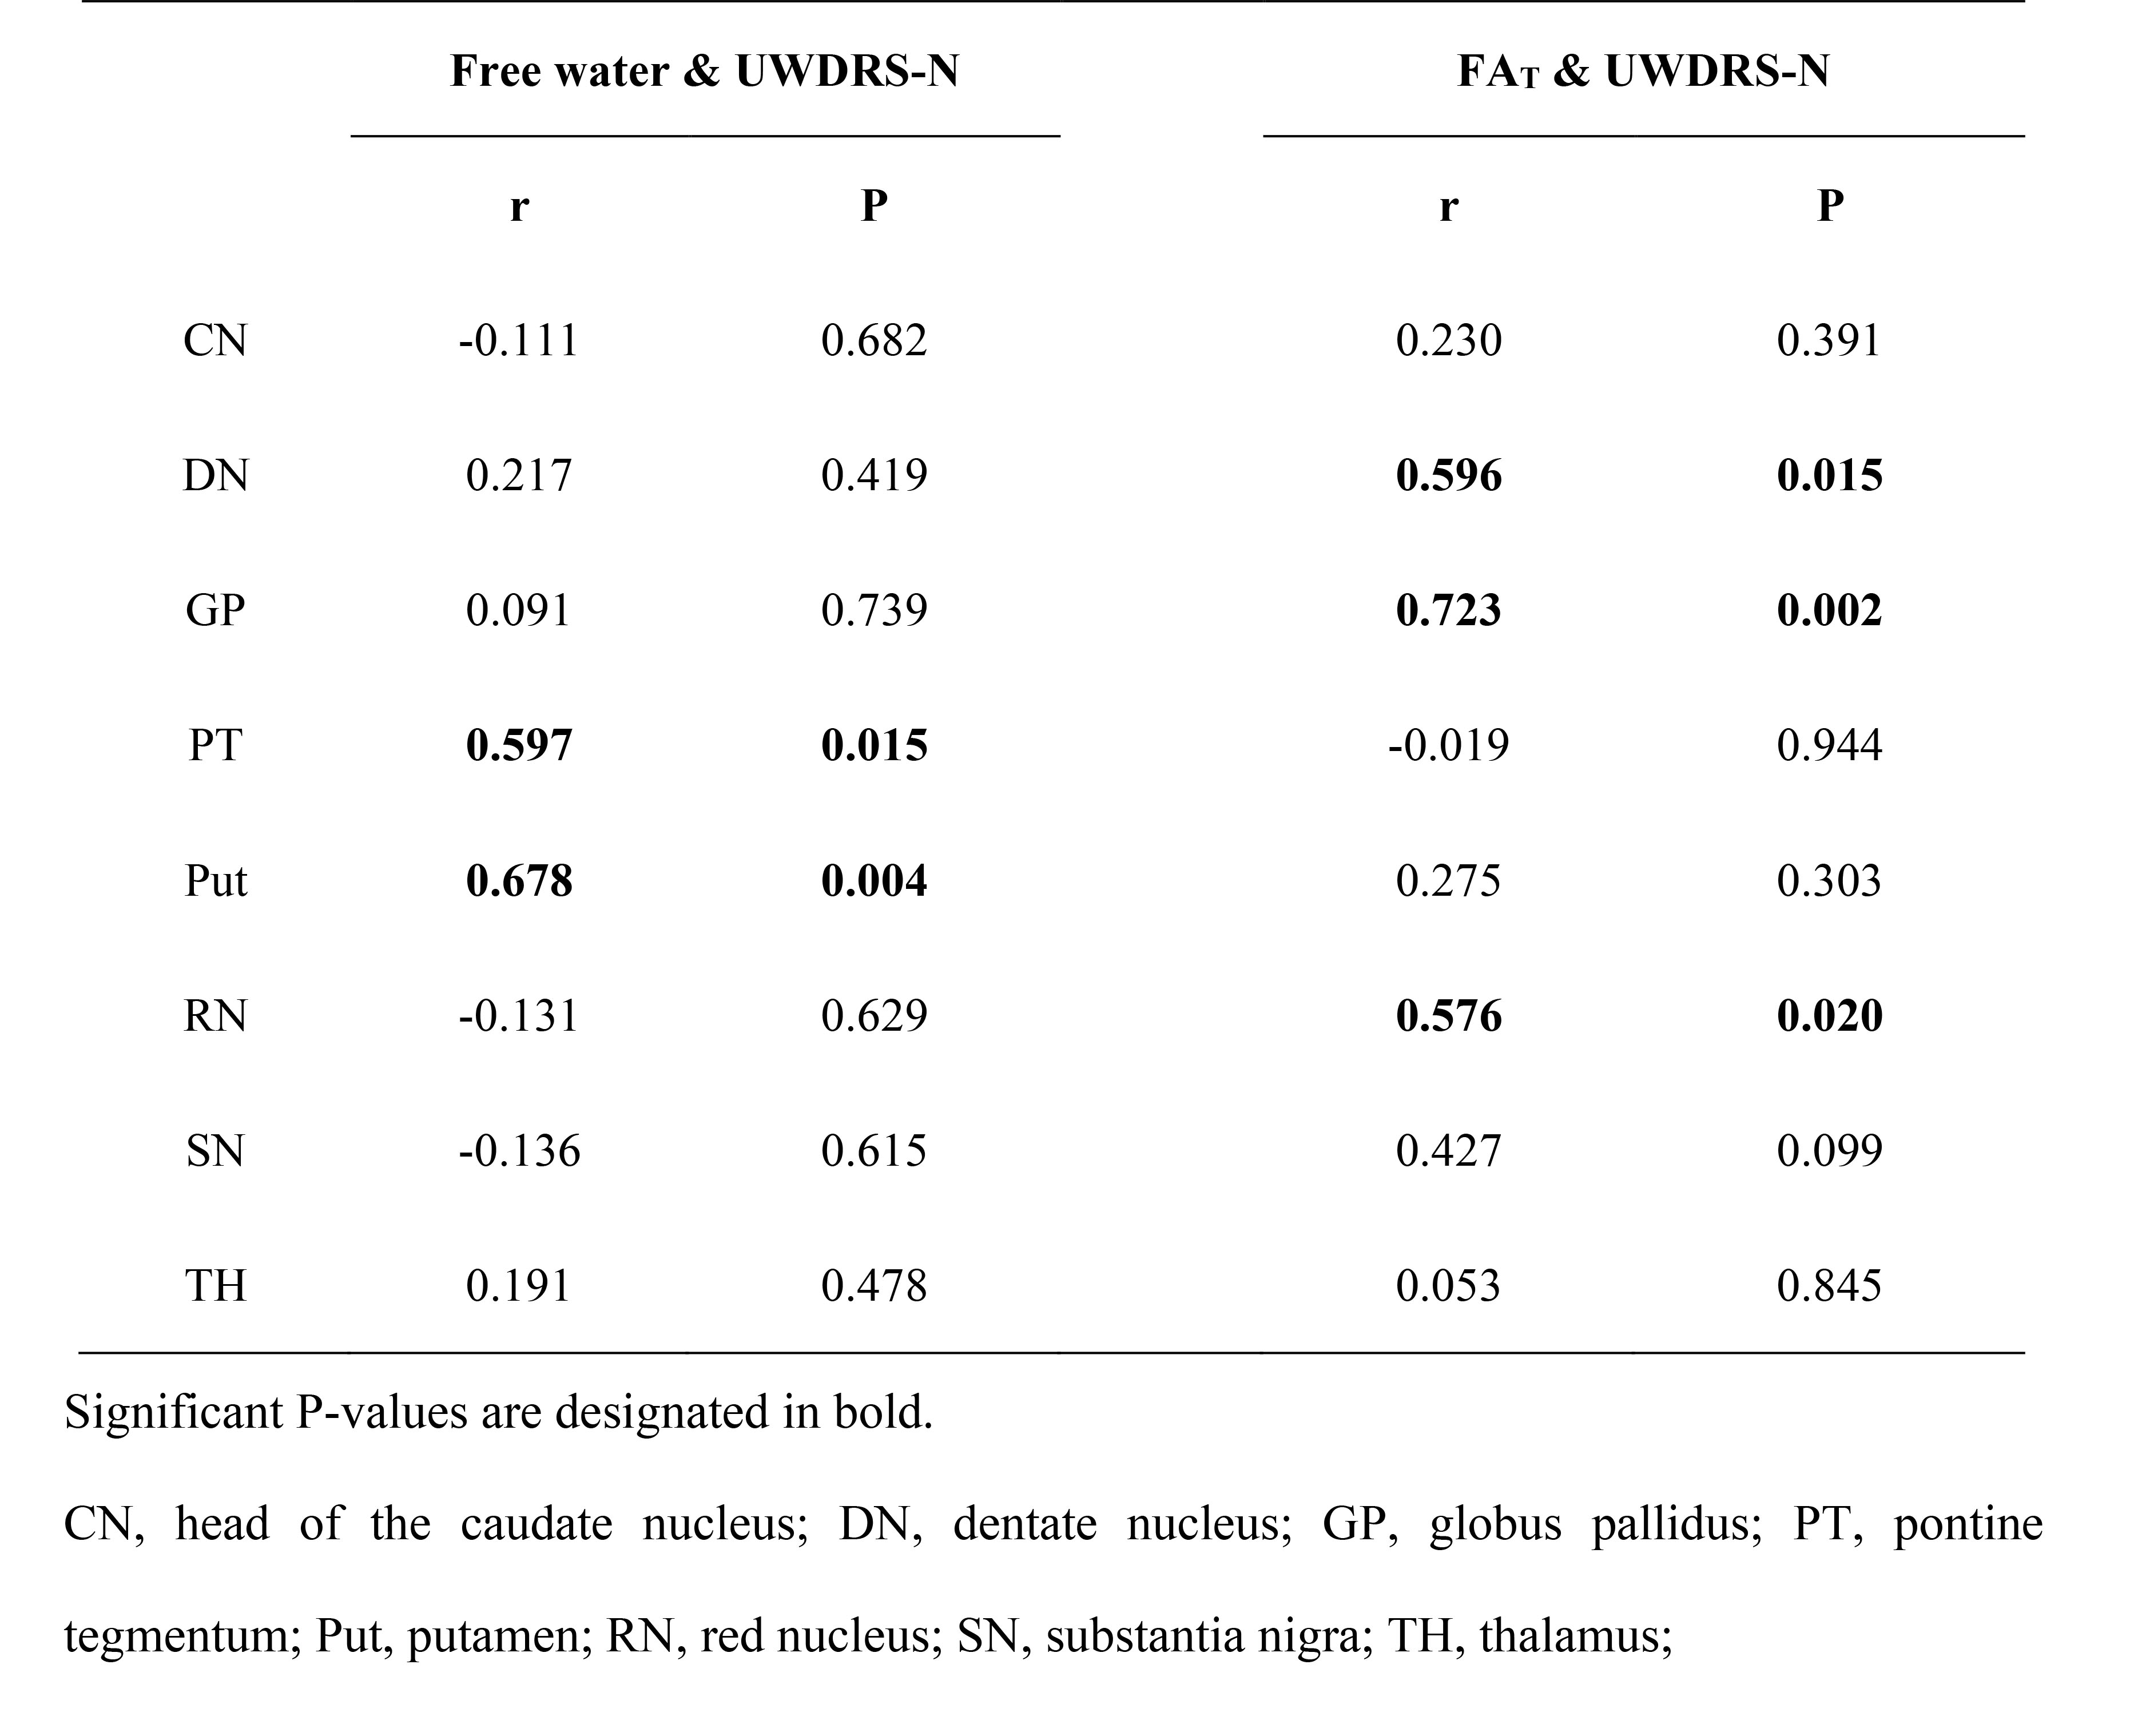
As shown in Fig 2, free water and FAT values were significantly increased in multiple DGM nuclei of neurological WD patients compared to controls. WD patients with normal appearing on conventional MRI also had significantly higher free water and FAT values in multiple DGM nuclei than controls (Fig 3). Positive correlations were noted between the the Unified WD Rating Scale (UWDRS) neurological subscores and free water values of PT (r = 0.597, P = 0.015) and Put (r = 0.678, P = 0.004) as well as FAT values of DN (r = 0.596, P = 0.015), GP (r = 0.723, P = 0.002), and RN (r = 0.576, P = 0.020) (Table 1).Discussion
Our study found that free water of multiple DGM nuclei were increased in neuro-WD patients compared with controls. Neuropathological studies have also found neuroinflammation and extensive brain atrophy in WD patients6-9. Thus, we speculate that the elevated free water in DGM nuclei of neuro-WD patients may result from neuroinflammation and atrophy-based neurodegeneration. It has been reported that elevated fractional anisotropy (FA) in gray matter areas could represent a signal of gliosis10. The increased FAT values in the CN, DN, GP, Put, RN, and SN of neuro-WD patients may attribute to gliosis in these regions. No significant differences in FAT values of the PT and TH were found between neuro-WD patients and HCs. Researchers have previously found that gliosis in the white matter regions may result in a decrease in FA10-12. The PT and TH contains a large amount of white matter fiber tracts, so we speculate that the alterations in FAT values of the PT and TH in WD patients may be the combined result of gliosis in the gray matter and white matter10-12. Demyelination in white matter fiber tracts may also contribute to the alterations of FAT values of the PT and TH in WD patients.In addition, we observed that free water imaging also detects microstructural abnormalities even in patients with normal appearing on conventional MRI. Our findings suggest that free water and FAT values may be abnormal before lesions become morphologically apparent on conventional MRI, thus facilitating early detection and determination of the true extent of abnormalities.
The study also found correlations between the UWDRS neurological subscores and free water imaging incicies in DGM nuclei, indicating that free water imaging of DGM nuclei can be used as a potential biomarker to assess the severity of neurodegeneration in WD.
Conclusion
Free water imaging detects microstructural changes in both normal and abnormal appearing DGM nuclei of WD patients. Free water imaging indices were correlated with the severity of neurological impairment in WD patients.Acknowledgements
References
1. Pasternak O, Sochen N, Gur Y, Intrator N, Assaf Y. Free water elimination and mapping from diffusion mri. Magn Reson Med 2009;62(3):717-730.
2. Febo M, Perez PD, Ceballos-Diaz C, et al. Diffusion magnetic resonance imaging-derived free water detects neurodegenerative pattern induced by interferon-γ. Brain Struct Funct 2020;225(1):427-439.
3. Jenkinson M, Beckmann CF, Behrens TE, Woolrich MW, Smith SM. Fsl. Neuroimage 2012;62(2):782-790.
4. Litwin T, Gromadzka G, Szpak GM, Jabłonka-Salach K, Bulska E, Członkowska A. Brain metal accumulation in wilson's disease. J Neurol Sci 2013;329(1-2):55-58.
5. Liu J, Liu T, de Rochefort L, et al. Morphology enabled dipole inversion for quantitative susceptibility mapping using structural consistency between the magnitude image and the susceptibility map. Neuroimage 2012;59(3):2560-2568.
6. Favrole P, Chabriat H, Guichard JP, Woimant F. Clinical correlates of cerebral water diffusion in Wilson disease. Neurology 2006;66(3):384-389.
7. Dusek P, Bahn E, Litwin T, et al. Brain iron accumulation in Wilson disease: a post mortem 7 Tesla MRI - histopathological study. Neuropathol Appl Neurobiol 2017;43(6):514-532.
8. Poujois A, Mikol J, Woimant F. Wilson disease: brain pathology. Handb Clin Neurol 2017;142:77-89.
9. Smolinski L, Litwin T, Redzia-Ogrodnik B, Dziezyc K, Kurkowska-Jastrzebska I, Czlonkowska A. Brain volume is related to neurological impairment and to copper overload in Wilson's disease. Neurol Sci 2019;40(10):2089-2095.
10. Budde MD, Janes L, Gold E, Turtzo LC, Frank JA. The contribution of gliosis to diffusion tensor anisotropy and tractography following traumatic brain injury: Validation in the rat using fourier analysis of stained tissue sections. Brain 2011;134(Pt 8):2248-2260.
11. Acosta-Cabronero J, Williams GB, Pengas G, Nestor PJ. Absolute diffusivities define the landscape of white matter degeneration in alzheimer's disease. Brain 2010;133(Pt 2):529-539.
12. Concha L, Gross DW, Wheatley BM, Beaulieu C. Diffusion tensor imaging of time-dependent axonal and myelin degradation after corpus callosotomy in epilepsy patients. Neuroimage 2006;32(3):1090-1099.
Figures