1735
Quantitative Susceptibility Mapping of cortical and subcortical brain regions in patients with REM sleep Behavior Disorder1Department of Biomedical and Neuromotor Sciences, University of Bologna, Bologna, Italy, 2Functional and Molecular Neuroimaging Unit, IRCCS Istituto delle Scienze Neurologiche di Bologna, Bologna, Italy, 3Clinica Neurologica Rete Metropolitana, IRCCS Istituto delle Scienze Neurologiche di Bologna, Bologna, Italy, 4Department of Advanced Biomedical Sciences, University of Naples Federico II, Napoli, Italy, 5Department of Experimental, Diagnostic and Specialty Medicine, University of Bologna, Bologna, Italy, 6Department of Physics and Astronomy, University of Bologna, Bologna, Italy
Synopsis
Keywords: Neurodegeneration, Brain, RBD
REM sleep Behavior Disoder (RBD) is a parasomnia, possibly converting in a neurodegenerative α-synucleinopathy. We explored to role of iron accumulation in this condition exploiting Quantitative Susceptibility Mapping (QSM), a quantitative imaging technique returning susceptibility values voxel-per-voxel. RBD patients were compared to healthy controls; cortical and sub-cortical areas were segmented with automatic and semi-automatic methods and susceptibility distributions were compared. Significant increase of iron deposition resulted in multiple cortical areas, in the brainstem and in the gray matter nuclei of the limbic system, suggesting that QSM may help in identifying biomarkers that predict the conversion from RBD to neurodegeneration.INTRODUCTION
REM sleep Behavior Disoder (RBD) is a parasomnia, characterized by dream-enactment behaviors and loss of REM sleep atonia. It may be a prodromal syndrome of neurodegenerative α-synucleinopathies (e.g. Parkinson’s Disease)1, but predicting the conversion remains challenging. Patients with idiopathic RBD (iRBD) often present abnormalities such as subtle sensory, motor and cognitive deficits, suggesting that multiple areas of the brain may be compromised before the conversion to a neurodegenerative disorder. Previous studies have shown that accumulation of α-synuclein is related to iron deposition2. Thus, in this work, we wanted to explore the role of iron accumulation in cortical and subcortical brain regions in a cohort of iRBD patients. As MR measurements, we used Quantitative Susceptibility Mapping (QSM), a technique returning susceptibility χ(r) distribution, voxel-per-voxel proportional to the iron concentration in the underlying tissues.METHODS
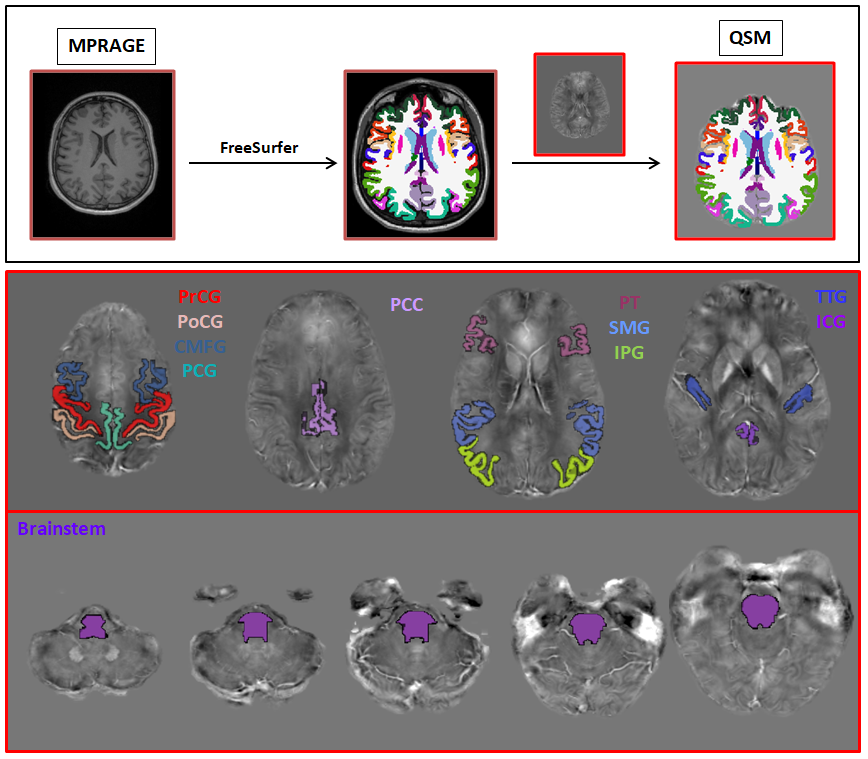
Data were collected from the database of the NeuroImaging Laboratory (IRCCS Institute of Neurological Sciences of Bologna, Bellaria Hospital). The analyzed sample included 20 iRBD patients (4F/16M, age: 67.1±5.0 years) and 21 age-matched Healthy Controls (HC) (13F/8M, age: 60.4±7.0 years). The MRI exams were performed on a 3T Siemens Magnetom Skyra scanner, equipped with Siemens Head/Neck 64 Coil. The MR protocol provided MPRAGE (3D T1w TR/TE = 2300/2.98 ms, 1x1x1 mm3) and QSM (3D GRE T2*w, nTEs=5, TE1/ΔTE/TR = 9.42/9.42/53 ms, 0.5x0.5x1.5 mm3). The images did not present massive movement artifacts and were considered suitable for the analysis. To obtain χ maps, phase images were processed by Laplacian unwrapping, V-SHARP background removal and iLSQR3. Cerebro-Spinal Fluid was selected as reference tissue. QSM images were linearly registered to the corresponding MPRAGE.Segmentations from FreeSurfer software and from FIRST-FSL tool were performed on the MPRAGE images and then overlaid on QSM. Automatic and semi-automatic methods were used to identify the ROIs in the QSM images, specifically:
1. Ten cortical gyri (PreCentral Gyrus, Caudal Middle Frontal Gyrus, Paracentral Gyrus and Pars-Triangularis in frontal lobe, PostCentral Gyrus, Inferior Parietal Gyrus and SupraMarginal Gyrus in parietal lobe, Transverse Temporal Gyrus in temporal lobe and Posterior Cingulate Cortex and Isthmus of the Cingulate Gyrus in cingulate cortex) were selected from the FreeSurfer cortical parcellation (Fig.1).
2. Brainstem was selected from the FreeSurfer segmentation (Fig.1).
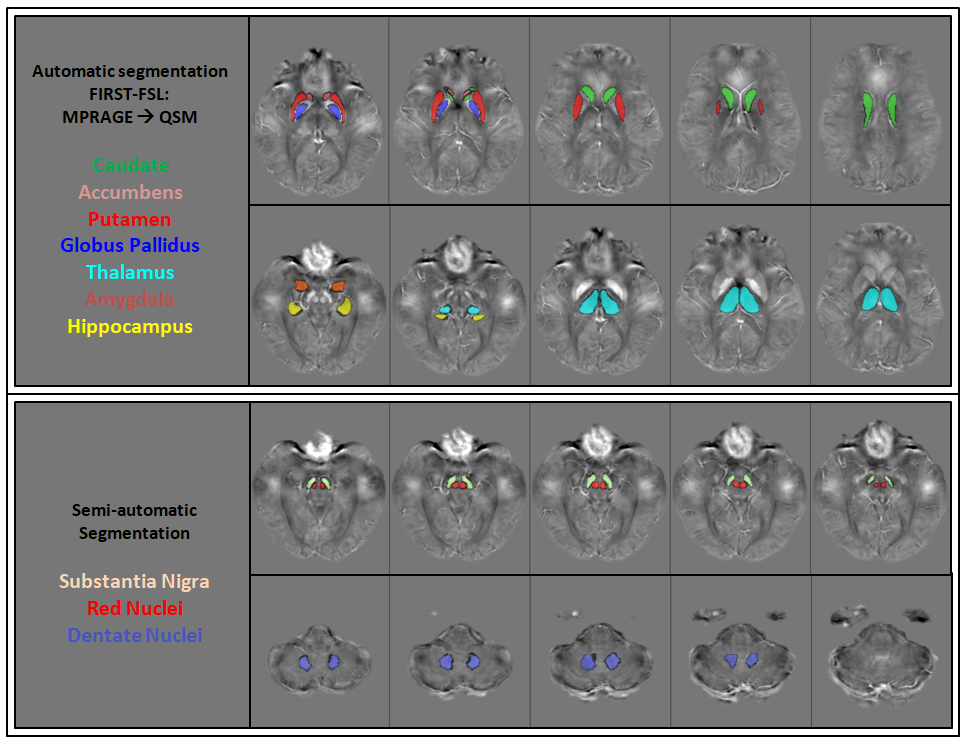
3. As gray matter nuclei, caudate, accumbens, putamen, globus pallidus, thalamus, hippocampus and amydgala were selected from FIRST-FSL segmentation, while substantia nigra, red nuclei and dentate nuclei were segmented using a semi-automated atlas-based method (Fig.2).
ROI-based analysis was performed comparing the median χ and the volume distributions among iRBD and HC groups, averaging left and right sides. Studying the cortical gyri, also cortical thickness was considered as structural property. The non-parametric Kruskal-Wallis test was used.
RESULTS
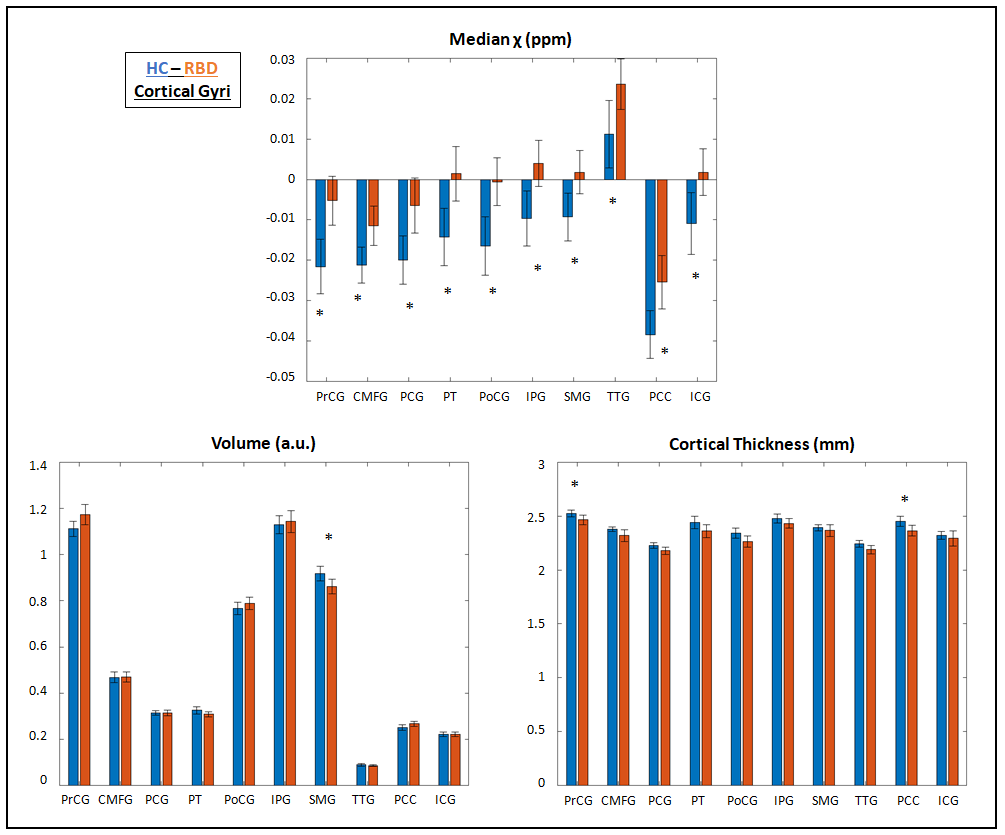
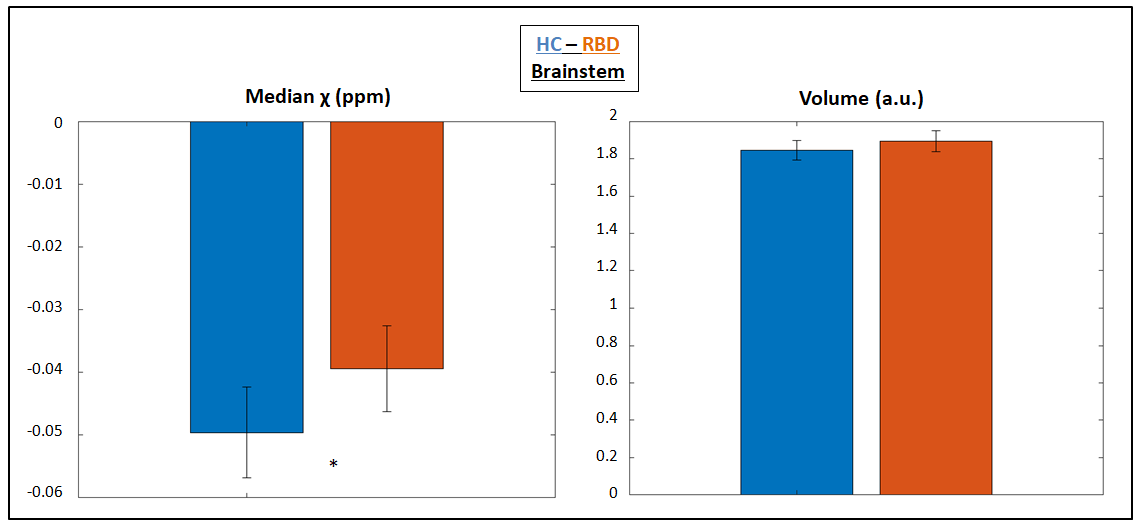
1. In all the considered cortical gyri, χ values were significantly higher in iRBD patients than in HC. Supramarginal gyrus presented significant lower volume and precentral gyrus and posterior cingulated cortex significant lower cortical thickness. The cortical thickness showed a reduction trend from HC to iRBD in all the gyri (Fig.3).2. Brainstem χ values were significantly higher in iRBD patients than in HC, without significant volume alterations (Fig.4).
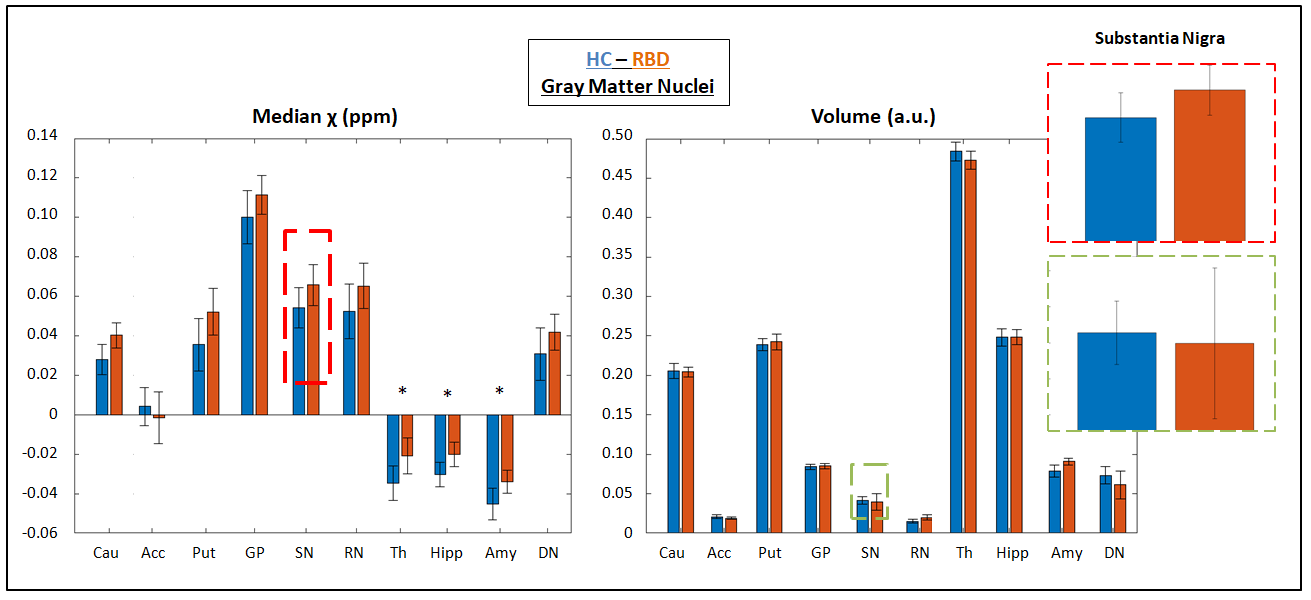
3. χ values were higher in iRBD patients than in HC in the gray matter nuclei; the difference was significant in thalamus, hippocampus and amygdala. No significant volume alterations were observed in these structures (Fig.5).
DISCUSSION
1. The analysis pointed out, for the first time, that the iron concentration significantly increases in patients with iRBD condition in different lobes of the brain. Together with χ alterations, it occurs a reduction of the cortical thickness with respect to the control group, significant in two out of ten structures: precentral gyrus, which is located the primary motor cortex, and posterior cingulated cortex, involved in many brain functions including topographic memory, visual assessment and attention.2. Previous studies detected abnormalities in the brainstem using diffusion MR measurements4; this structures is involved in many functions such as breathing, consciousness and sleep. Our analysis highlighted that also the iron concentration is abnormal, with no detection of any changes in the volume.
3. Substantia nigra is the structure mainly studied with QSM in α-synucleinopathies development, because the loss of dopaminergic neurons in its pars compacta, characterizing those pathologies, is associated to iron accumulation. Studying iRBD, previous works underlighted an increase of iron deposition5 and a reduction of the volume6 in this structure, consistent with our results (Fig.5). We extended the analysis to other gray matter nuclei and other structures show significant susceptibility abnormalities in iRBD patients, in particular the ones involved in the limbic system.
CONCLUSION
To our knowledge, there are no previous studies exploring χ in cortical and subcortical brain regions in patients with iRBD. In our analysis χ values resulted higher in multiple cortical areas (e.g. pre- and post- central gyri and posterior cingulated cortex), in the brainstem and in the nuclei involved in the limbic system, even in the absence of brain atrophy, which suggests that iron accumulation occurs before an eventual decrease in brain tissue. Follow-up measurements need to be performed to explore the evolution of susceptibility properties and possibly to identify biomarkers that predict conversion from RBD condition to an α-synucleinopathy.Acknowledgements
No acknowledgement found.References
1. Iranzo A, Fernández-Arcos A, Tolosa E et al. Neurodegenerative disorder risk in idiopathic REM sleep Behaviour disorder: study in 174 patients. PLoS ONE 2014; 9(2): e89741
2. Wan W, Jin L, Wang Z et al. Iron Deposition Leads to Neuronal α-Synuclein Pathology by Inducing Autophagy Dysfunction. Frontiers in Neurology 2017; 8(1)
3. Li W, Wang N, Yu F et al. A method for estimating and removing streaming artifacts in quantitative susceptibility mapping. Neuroimage 2015; 108: 111-222
4. Scherfler C, Frauscher B, Schocke M et al. White and gray matter abnormalities in idiopathic rapid eye movement sleep behavior disorder: A diffusion-tensor imaging and voxel-based morphometry study. Ann Neurol 2011; 69: 400-407
5. Chen Q, Boeve B, Forghanian-Arani A et al. MRI quantitative susceptibility mapping of the substantia nigra as an early biomarker for Lewy body disease. J Neuroimaging 2021; 31(5): 1020-1027
6. Gaurav R, Pyatigorskaya N, Biondetti E et al. Deep Learning-Based Neuromelanin MRI Changes of Isolated REM Sleep Behaviour Disorder. Movement Disorders 2022; 37(5): 1064-1069
Figures