1733
Modifications of Large-Scale Resting-State Functional Connectivity in Spinocerebellar Ataxia Type 3
Bing LIU1,2, Linwei Zhang3, Aocai Yang1, Jixin Luan1, Kuan Lv1, and Guolin Ma1
1Department of Radiology, China Japan Friendship Hospital, Beijing, China, 2Graduate School of Peking Union Medical College, Beijing, China, 3Department of Neurology, China Japan Friendship Hospital, Beijing, China
1Department of Radiology, China Japan Friendship Hospital, Beijing, China, 2Graduate School of Peking Union Medical College, Beijing, China, 3Department of Neurology, China Japan Friendship Hospital, Beijing, China
Synopsis
Keywords: Neurodegeneration, Brain Connectivity, functional MRI, independent component analysis, spinocerebellar ataxia type 3, large-scale brain networks, functional connectivity
Large-scale resting-state functional network connectivity changes in spinocerebellar ataxia type 3 patients were found in both inter- and intranetwork functional connectivity. Especially, the increased intranetwork functional connectivity within the lateral visual network may potentially be a compensatory mechanism of visual-related symptoms in SCA3.Introduction
As a neurodegenerative disease, the spinocerebellar ataxia type 3 (SCA3) is the most common autosomal dominant ataxia subtype with slowly progressive degenerative disorders that affects brain functions. Functional networks can be automatically identified by independent component analysis (ICA) of resting-state fMRI data which can discriminate temporal correlations among brain regions at rest1. Examinations of functional connectivity between and within functional networks could improve our understanding of the large-scale brain functional organization2. This study aimed to investigate the abnormal inter- and intranetwork functional connectivity in patients with SCA3.Methods
Seventeen SCA3 patients (14 males and 3 females; mean age, 42.8±11.9 years) and 17 age-, sex-matched healthy controls (HC) (13 males and 4 females; mean age, 42.8±15.0 years) were prospectively recruited into this study. MR data of all subjects were acquired by using a 3.0T scanner (GE, Discovery MR750, Milwaukee, United States) with an 8-channel head coil.Independent component analysis (ICA) was conducted to parcellate the preprocessed fMRI data with the GIFT toolbox (http://mialab.mrn.org/software/gift/), and the number of independent components (N=50) was estimated automatically by the software. To ensure estimation stability, the infomax algorithm was repeated 50 times in ICASSO (http://research.ics.tkk.fi/ica/icasso/), and the most central run was selected and analyzed further. Finally, participant-specific spatial maps and time courses were obtained using the GICA back reconstruction approach.
Based on a previous study3, we identified several independent components as functional networks that had peak activations in gray matter; showed low spatial overlap with known vascular, ventricular, motion, and susceptibility artifacts; and exhibited primarily low frequency power. This selection procedure resulted in 10 functional networks: medial, posterior and lateral visual networks (mVN, pVN and lVN); default mode network (DMN); cerebellum network (CN); sensorimotor network (SMN); auditory network (AN); executive control network (ECN); right and left frontoparietal networks (rFPN and lFPN).
Before internetwork functional connectivity calculation, the following additional postprocessing steps were performed on the time courses of selected functional networks4: (1) detrending linear, quadratic, and cubic trends; (2) despiking detected outliers; and (3) lowpass filtering with a cut-off frequency of 0.15 Hz. Then, internetwork functional connectivity was estimated as the Pearson correlation coefficients between pairs of time courses of the functional networks, resulting in a symmetric 10× 10 correlation matrix for each subject. Finally, correlations were transformed to z-scores using Fisher's transformation to improve the normality. Intranetwork connectivity was examined via the spatial maps, indexing the contribution of the time course to each voxel comprising a given component. Specifically, all participants’ spatial maps for each functional network were entered into a random-effect one-sample t-test. Brain regions were considered to be within each network if they met a height threshold of P<0.05 corrected for multiple comparisons using a family-wise error (FWE) and an extent threshold of 100 voxels. Two sample t-test based on MATLAB (R2013b) and SPM12 was used in exploring the intranetwork connectivity differences within each network between groups, with FWE multiple comparison corrections at voxel-level P < 0.05.
Results
Spatial maps of 10 selected independent components out of the 50 independent components resulted in 10 functional networks (Figure 1). Pairwise correlation patterns between functional networks are illustrated in Figure 2. Both positive and negative internetwork functional connectivity was observed. Voxel-wise analyses of the spatial maps demonstrated significant group differences in intranetwork functional connectivity within lVN. Figure 3 and Table 2 show detailed significant brain regions in SCA3>HC comparison in voxel-wise intranetwork connectivity of lVN. In Fusiform_R&L, Lingual_R&L, Cerebelum_6_R&L and several occipital and temporal regions, the intranetwork functional connectivity of SCA3 patients in lVN increased compared to that of HC.Discussion & Conclusion
Across all subjects in this study, the negative internetwork functional connectivity is mainly between CN and ECN. On the contrary, the positive internetwork functional connectivity is mainly between the three visual networks (mVN, pVN and lVN) and between SMN and AN. Given that the cognition-space paradigm corresponds to the lateral visual maps3, the increased intranetwork functional connectivity within the lateral visual network in our SCA3 patients may potentially be a compensatory mechanism of their visual-related symptoms such as oculomotor deficits. Therefore, our findings of the presence of modifications and alterations of several large-scale inter- and intranetwork functional connectivity might expand existing knowledge regarding visual function changes in SCA3 patients.References
1. van de Ven VG, Formisano E, Prvulovic D, Roeder CH, Linden DE. Functional connectivity as revealed by spatial independent component analysis of fMRI measurements during rest. Hum Brain Mapp. 2004 Jul;22(3):165-78. 2. Buckner RL, Vincent JL. Unrest at rest: default activity and spontaneous network correlations. Neuroimage. 2007 Oct 1;37(4):1091-6; discussion 1097-9. 3. Smith SM, Fox PT, Miller KL, Glahn DC, Fox PM, Mackay CE, Filippini N, Watkins KE, Toro R, Laird AR, Beckmann CF. Correspondence of the brain's functional architecture during activation and rest. Proc Natl Acad Sci U S A. 2009 Aug 4;106(31):13040-5. 4. Cai H, Wang C, Qian Y, Zhang S, Zhang C, Zhao W, Zhang T, Zhang B, Chen J, Liu S, Zhu J, Yu Y. Large-scale functional network connectivity mediate the associations of gut microbiota with sleep quality and executive functions. Hum Brain Mapp. 2021 Jul;42(10):3088-3101.Acknowledgements
No acknowledgement found.References
No reference found.Figures
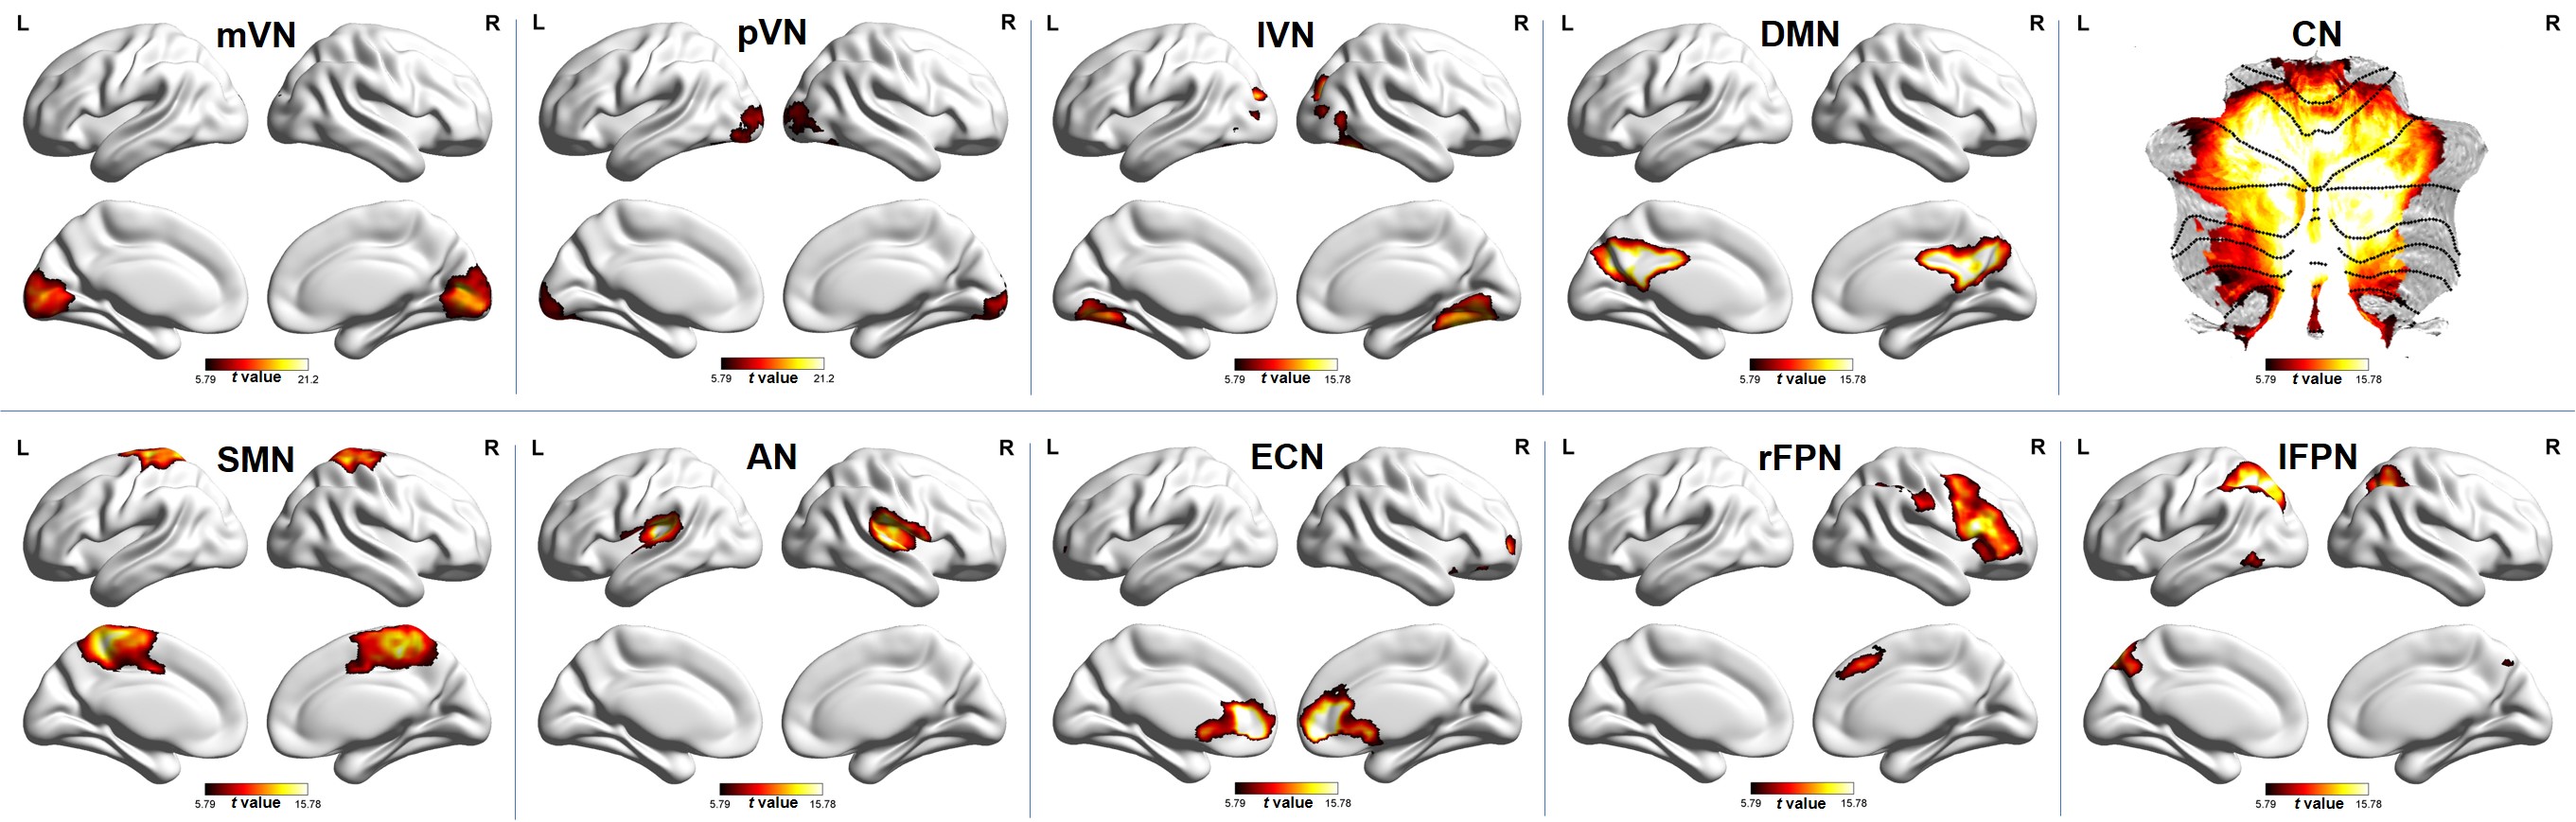
Figure 1. Spatial maps
of 10 selected independent components. Abbreviation: mVN, medial visual
network; pVN, posterior visual network; lVN, lateral visual network; DMN,
default mode network; CN, cerebellum network; SMN, sensorimotor network; AN,
auditory network; ECN, executive control network; rFPN, right frontoparietal
network; lFPN, left frontoparietal network.
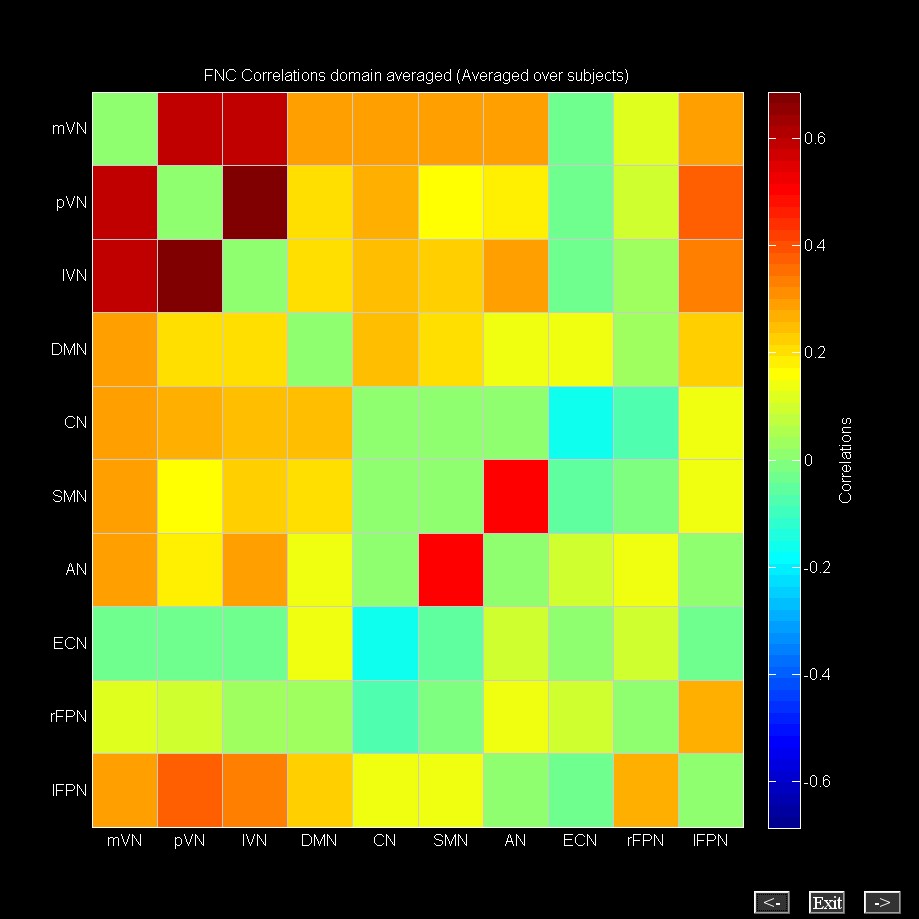
Figure 2. Internetwork functional
connectivity matrix. Pairwise correlations between functional networks were
averaged across subjects. Hot colors represent positive functional connectivity
and cool colors represent negative functional
connectivity.
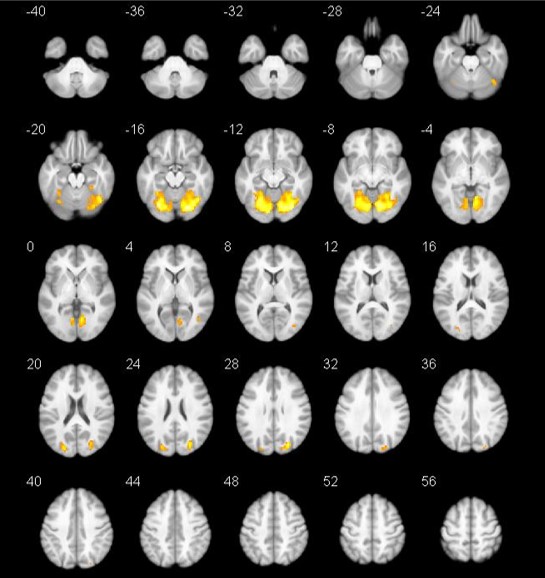
Figure 3. Detailed
visualization for SCA3>HC comparison across groups in voxel-wise intranetwork
functional connectivity of lVN performed by the two-sample t-test with a
threshold of P<0.05 (FWE corrected, voxel-level) and cluster size threshold of
10 voxels. The warm color represents voxels with significantly increased intranetwork
connectivity of lVN in the SCA3 group compared with the HC group.
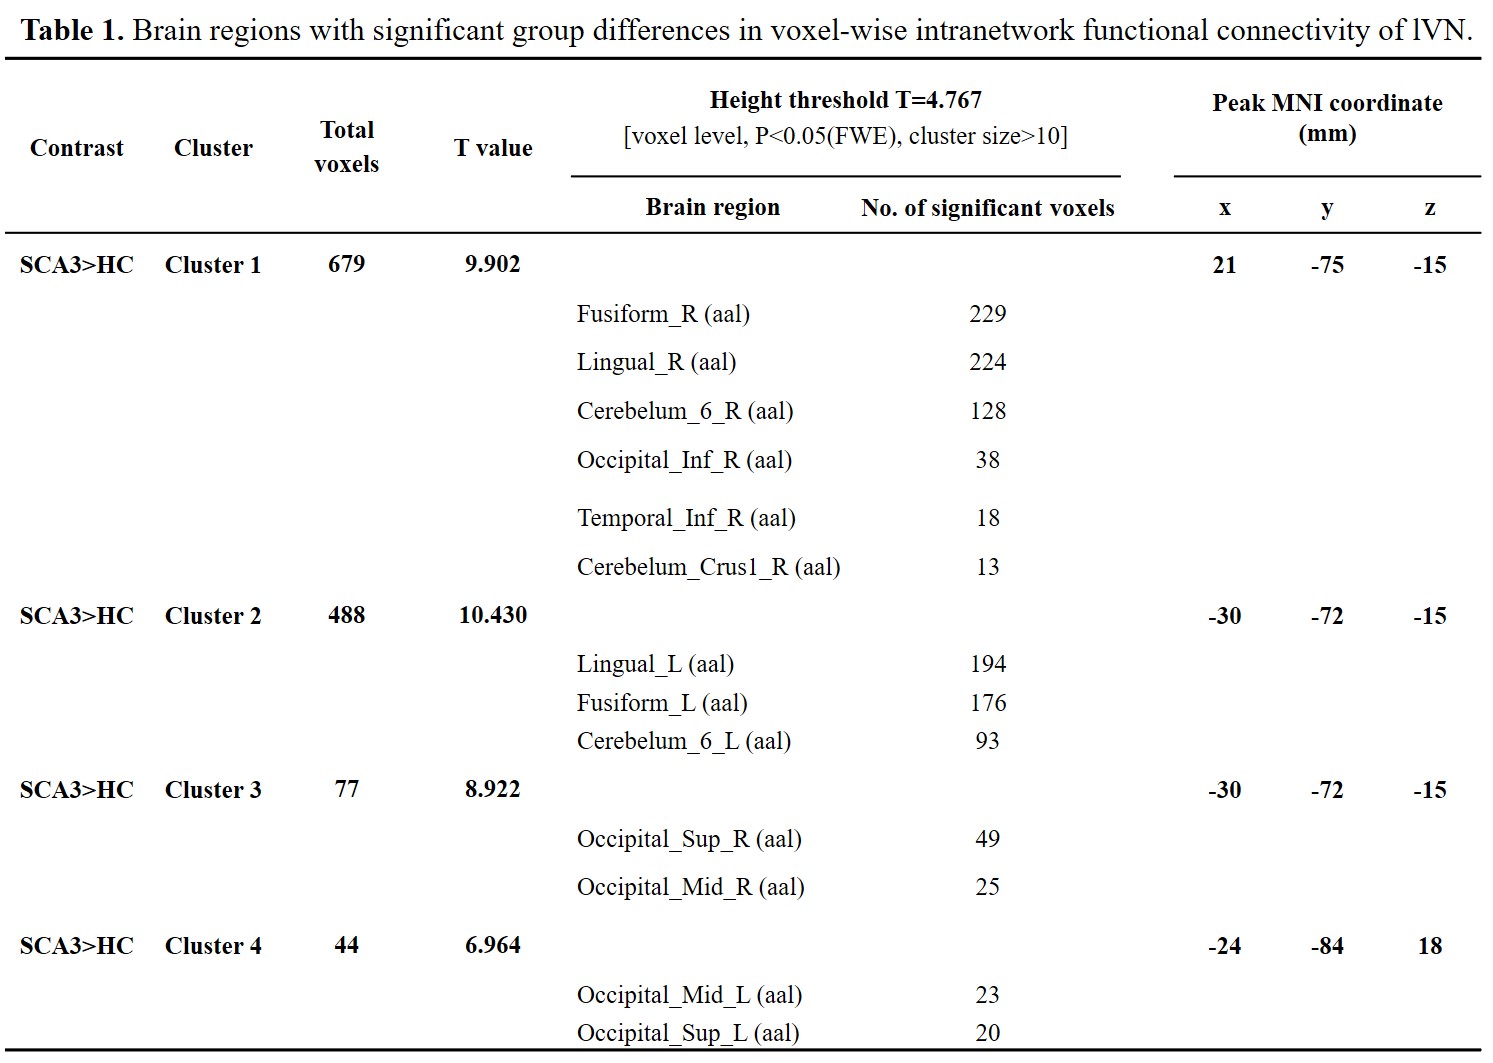
Table
1. Brain regions with significant group differences in voxel-wise intranetwork
functional connectivity of lVN.
DOI: https://doi.org/10.58530/2023/1733