1729
Altered Dynamic in Functional Connectivity Density in Amyotrophic Lateral Sclerosis: A Resting-State FMRI Study
Jia-Hui Lin1, Jia-Hui Lin1, Qiu-Yi Dong1, Yun-Bin Cao1, and Hua-Jun Chen1
1Fujian Medical University Union Hospital, Fuzhou, China
1Fujian Medical University Union Hospital, Fuzhou, China
Synopsis
Keywords: Neurodegeneration, fMRI (resting state)
This is the first study on alterations in the patterns of dynamic functional connection density (dFCD) involving ALS. We obtained resting-state fMRI data from ALS and healthy controls (HCs). We calculated the functional connectivity (FC) and the functional connection density (FCD) value. dFCD was assessed by sliding-window correlation method. The standard deviation of dFCD can measure dFCD variability. The dFCD variability was reduced in some brain region in HC group, whereas increase was observed in some brain region of ALS patients. dFCD variability can distinguish two groups. ALS patients exhibit aberrant dynamic property in brain functional architecture.Background and aims:
Current knowledge on the temporal dynamics of the brain functional organization in amyotrophic lateral sclerosis (ALS) is limited. This is the fifirst study on alterations in the patterns of dynamic functional connection density (dFCD) involving ALS.Methods:
We obtained resting-state functional magnetic resonance imaging (fMRI) data from 50 individuals diagnosed with ALS and 55 healthy controls (HCs). We calculated the functional connectivity (FC) between a given voxel and all other voxels within the entire brain and yield the functional connection density (FCD) value per voxel. dFCD was assessed by sliding window correlation method. In addition, the standard deviation (SD) of dFCD across the windows was computed voxel-wisely to measure dFCD variability. The difference in dFCD variability between the two groups was compared using a two-sample t-test following a voxel-wise manner. The receiver operating characteristic (ROC) curve was used to assess the between-group recognition performance of the dFCD variability index.Results:
The dFCD variability was significantly reduced in the bilateral precentral and postcentral gyrus compared with the HC group, whereas a marked increase was observed in the left middle frontal gyrus of ALS patients. dFCD variability exhibited moderate potential (areas under ROC curve = 0.753–0.837, all P < 0.001) in distinguishing two groups.Conclusion:
ALS patients exhibit aberrant dynamic property in brain functional architecture. The dFCD evaluation improves our understanding of the pathological mechanisms underlying ALS and may assist in its diagnosis.Acknowledgements
The National Natural Science Foundation of China (No. 82071900), the Fujian Province Natural Science Foundation (Nos. 2021J01759 and 2021J01754), and the Fujian Province Joint Funds for the Innovation of Science and Technology (No. 2019Y9067) supported this study.References
Agosta, F., Canu, E., Valsasina, P., Riva, N., Prelle, A., Comi, G., et al. (2013). Divergent brain network connectivity in amyotrophic lateral sclerosis. Neurobiol. Aging 34, 419–427
Chen, H. J., Zou, Z. Y., Zhang, X. H., Shi, J. Y., Huang, N. X., and Lin, Y. J. (2021). Dynamic Changes in Functional Network Connectivity Involving Amyotrophic Lateral Sclerosis and Its Correlation With Disease Severity. J. Magn. Reson. Imaging 54, 239–248
Nomi, J. S., Vij, S. G., Dajani, D. R., Steimke, R., Damaraju, E., Rachakonda, S., et al. (2017). Chronnectomic patterns and neural flexibility underlie executive function. Neuroimage 147, 861–871.
Figures
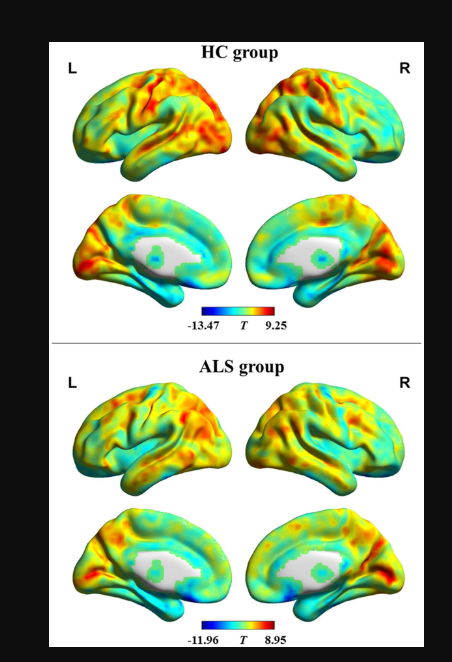
dFCD variability patterns within each group. The brain maps of the T-values indicate the results of one-sample t-testing of dFCD variability. High and low
dFCD variability is represented by red and blue color, respectively. ALS, amyotrophic lateral sclerosis; HC, healthy control; L, left; R, right.
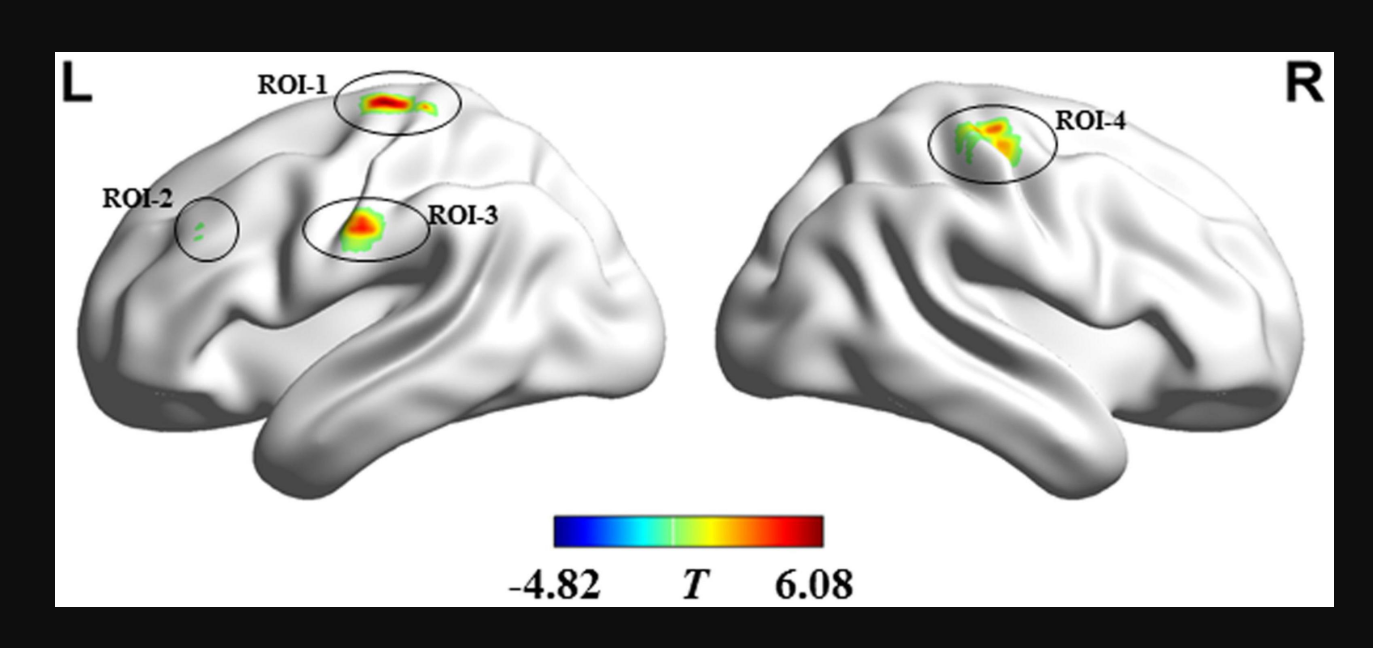
Regions showing between-group differences in dFCD variability. Regions in red and blue, respectively indicate decreased and increased dFCD variability
in individuals with amyotrophic lateral sclerosis. ROI-1 and ROI-3 are located in the left precentral and postcentral gyri; ROI-2 is located in the left middle frontal
gyrus; and ROI-4 is situated in the right precentral and postcentral gyri. L, left; R, right.
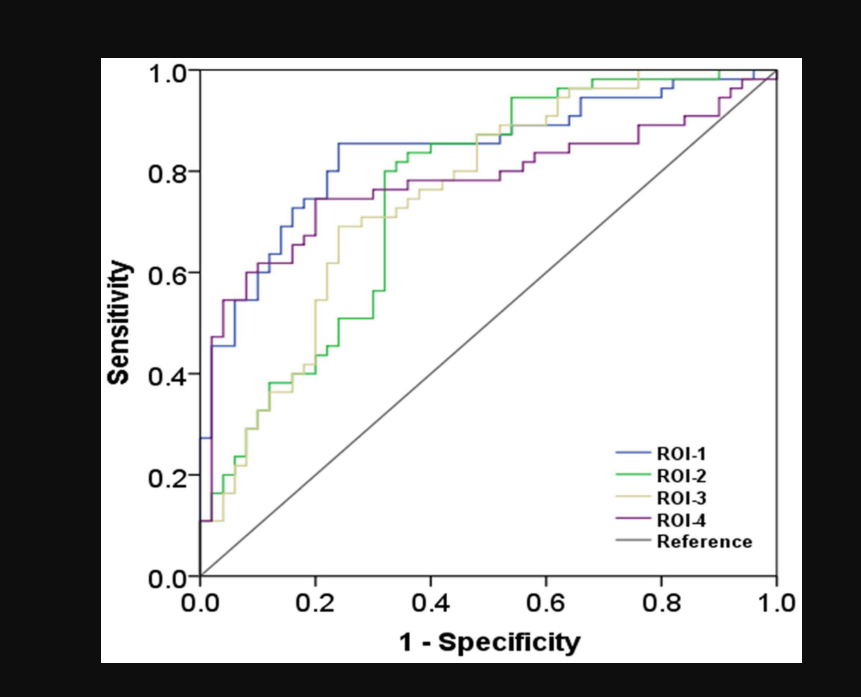
The findings of receiver operating characteristic curve analysis.
ROI-1 and ROI-3 are located in the left precentral and postcentral gyri; ROI-2
is located in the left middle frontal gyrus; and ROI-4 is located in the right
precentral and postcentral gyri.
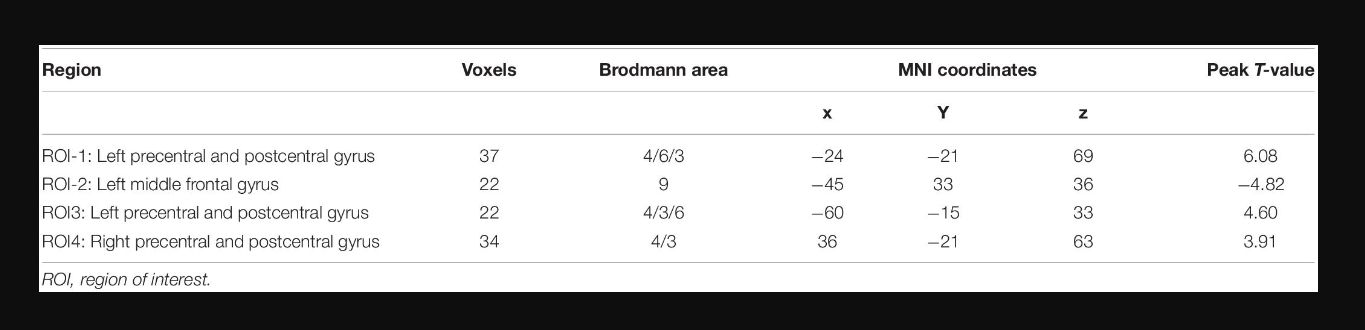
Regions exhibiting between-group differences in dFCD variability
DOI: https://doi.org/10.58530/2023/1729