1728
IRON OVERLOAD IN AMYOTROPHIC LATERAL SCLEROSIS: DIAGNOSTIC ACCURACY OF VISUAL AND AUTOMATIC ASSESSMENTS
Valeria Elisa Contarino1, Francesco Maria Lo Russo1, Giorgio Conte1, Claudia Morelli2, Francesca Trogu2, Silvia Casale1, Sara Sbaraini3, Luca Caschera1, Valentina Genovese1, Chunlei Liu4, Claudia Maria Cinnante2, Vincenzo Silani2, and Fabio Maria Triulzi1
1Fondazione IRCCS Ca' Granda Ospedale Maggiore Policlinico Milano, Milano, Italy, 2Auxologico, Milano, Italy, 3ASST Santi Paolo e Carlo, San Carlo Borromeo Hospital, milano, Italy, 4UC Berkeley, Milano, Italy
1Fondazione IRCCS Ca' Granda Ospedale Maggiore Policlinico Milano, Milano, Italy, 2Auxologico, Milano, Italy, 3ASST Santi Paolo e Carlo, San Carlo Borromeo Hospital, milano, Italy, 4UC Berkeley, Milano, Italy
Synopsis
Keywords: Neurodegeneration, Brain, motor cortex; quantitative susceptibility mapping; amyotrophic lateral sclerosis
vVisual SWI-based and automatic QSM-based assessments show high diagnostic accuracy in UMN- predominant ALSINTRODUCTION
Amyotrophic Lateral Sclerosis (ALS) is a highly lethal progressive neurodegenerative disorder of unknown etiology, characterized by the degeneration of upper (UMN) and lower motor neurons (LMN) [1]. Recent neuroimaging research focused on the iron overload in the precentral cortex [2-6], which is thought to be a marker of upper motor neuron degeneration in ALS patients. The aim of the study is to investigate and compare the diagnostic accuracy of the SWI-based visual assessment [6] and the QSM-based automatic assessment [4] of the susceptibility in the precentral cortex in detecting ALS and ALS with predominance of upper motor neuron (UMN) impairment.METHODS
47 ALS patients, 23 healthy controls (HC), and 15 ALS Mimics (ALS-Mim) were retrospectively recruited. Among the ALS patiens, 12 with predominant UMN impairment (UMN-ALS), 16 with predominant LMN imparment (LMN-ALS), and 19 with no clinically-defined predominance (c-ALS). MRI scans were performed in a 3T SIGNA General Electric unit and included: 3D sag FSPGR BRAVO T1-weighted images (TR=8.7 ms, TE=3.2 ms; TI=450 ms; voxel size=1x1x1 mm, flip angle=12°; matrix 256x256); 3D spoiled gradient-echo multi-echo pulse sequence (TR=39 ms; 7 echoes with TE1=24 ms and ΔTE=3.3 ms; voxel size=0.468x0.468x1.4 mm; flip angle=20°; matrix 416x320). The visual assessment was performed by the Motor Cortex Susceptibility (MCS) score based on the visual inspection of the SWI hypointensity in the precentral cortex [6] shown in Fig. 1, a-b. The automatic assessment was performed by Freesurfer segmentation, quantitative susceptibility mapping (QSM) using STI Suite (Fig. 2) and computation of the skewness of the susceptibility values in the precentral cortex (SuscSkew) [4].Kruskall-Wallis and post-hoc tests were used to compare MCS and SuscSkew among the groups. Spearman’s correlation analysis between the MSC and SuscSkew was performed. Receiver operating characteristic (ROC) analyses on MCS and SuscSkew were performed.
RESULTS AND DISCUSSION
MCS was statistically significant among the groups (χ²(3) = 36.7 (p < 0.001), in particular MCS was higher in UMN-ALS compared to HC (p<0.001), MIMIC-ALS (p =0.002) and LMN-ALS (p= 0.002), and in c-ALS compared to HC (p = 0.019) (Fig.3). SuscSKEW was statistically significant among the groups (χ²(3) = 24.2 (p < 0.001), and pairwise tests showed that SuscSKEW was higher in UMN-ALS compared to LMN-ALS (p < 0.001), HC (p < 0.001), c-ALS (p = 0.012), and ALS-Mim (p < 0.001) (Fig.4).The correlation between MCS score and SuscSkew was statistically significant (Rho=0.55, p<0.001). MCS showed AUC 67.4 and 65.2 to differentiate ALS patients from HC and ALS-Mim, respectively, and AUC 88.5 and 86.1 to differentiate UMN-ALS patients from HC and ALS-Mim, respectively. SuscSkew showed AUC 66.3 and 70.9 to differentiate ALS patients from HC and ALS-Mim, respectively, and AUC 96.8 (Fig.4) and 93,6 to differentiate UMN-ALS patients from HC and ALS-Mim, respectively. While the performances were scarce for the whole ALS group, both SWI-based visual and QSM-based automatic assessment showed to be potential biomarkers of UMN-ALS. The automatic assessment based on QSM might be preferred to provide quantitative, reproducible, user-independent measures.
CONCLUSION
SWI-based visual and QSM-based automatic assessment of the precentral cortex susceptibility showed high diagnostic accuracy to differentiate ALS patients with UMN-predominant impairment from HC and ALS-Mim. The performance of the QSM-based automatic assessment slightly exceeded the SWI-based visual assessment. Further effort should be dedicated to validate the QSM as a quantitative automatic non-invasive biomarker for UMN-ALS in multicentric studiesAcknowledgements
No acknowledgement found.References
[1] Brown RH Jr, Al-Chalabi A (2017) Amyotrophic Lateral Sclerosis. The New England journal of medicine. p. 1602. [2] Costagli M, Donatelli G, Biagi L, Caldarazzo Ienco E, Siciliano G, Tosetti M, et al. (2016) Magnetic susceptibility in the deep layers of the primary motor cortex in Amyotrophic Lateral Sclerosis. Neuroimage Clin.;12: 965–969. [3] Cosottini M, Donatelli G, Costagli M, Caldarazzo Ienco E, Frosini D, Pesaresi I, et al. (2016) High-Resolution 7T MR Imaging of the Motor Cortex in Amyotrophic Lateral Sclerosis. American Journal of Neuroradiology.. pp. 455–461. doi:10.3174/ajnr.a4562 [4] Contarino VE, Conte G, Morelli C, Trogu F, Scola E, Calloni SF, et al. (2020) Toward a marker of upper motor neuron impairment in amyotrophic lateral sclerosis: A fully automatic investigation of the magnetic susceptibility in the precentral cortex. European Journal of Radiology.. p. 108815. doi:10.1016/j.ejrad.2020.108815 [5] Conte G, Contarino VE, Casale S, Morelli C, Sbaraini S, Scola E, et al. (2021) Amyotrophic lateral sclerosis phenotypes significantly differ in terms of magnetic susceptibility properties of the precentral cortex. Eur Radiol. 31: 5272–5280. [6] Conte G, Sbaraini S, Morelli C, Casale S, Caschera L, Contarino VE, et al. (2021) A susceptibility-weighted imaging qualitative score of the motor cortex may be a useful tool for distinguishing clinical phenotypes in amyotrophic lateral sclerosis. Eur Radiol. 31: 1281–1289.Figures
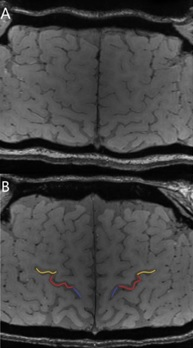
Motor cortex segments visually
assessed by the Motor Cortex Susceptibility (MSC) score in Susceptibility-weighted imaging (SWI)
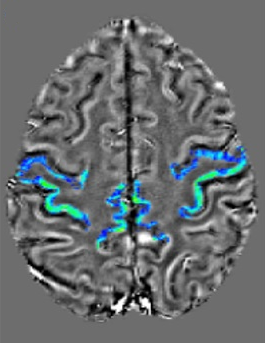
Quantitative Susceptibility Mapping (QSM) of the precentral gyrus automatically segmented
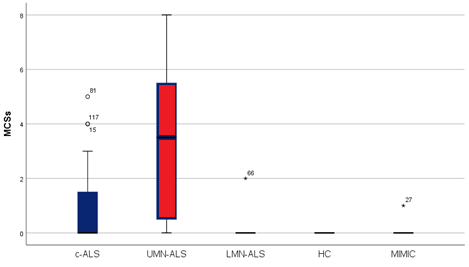
MCS in
ALS-phenotypes (i.e. C-ALS, UMN-ALS and LMN-ALS), HC and MIMIC-ALS
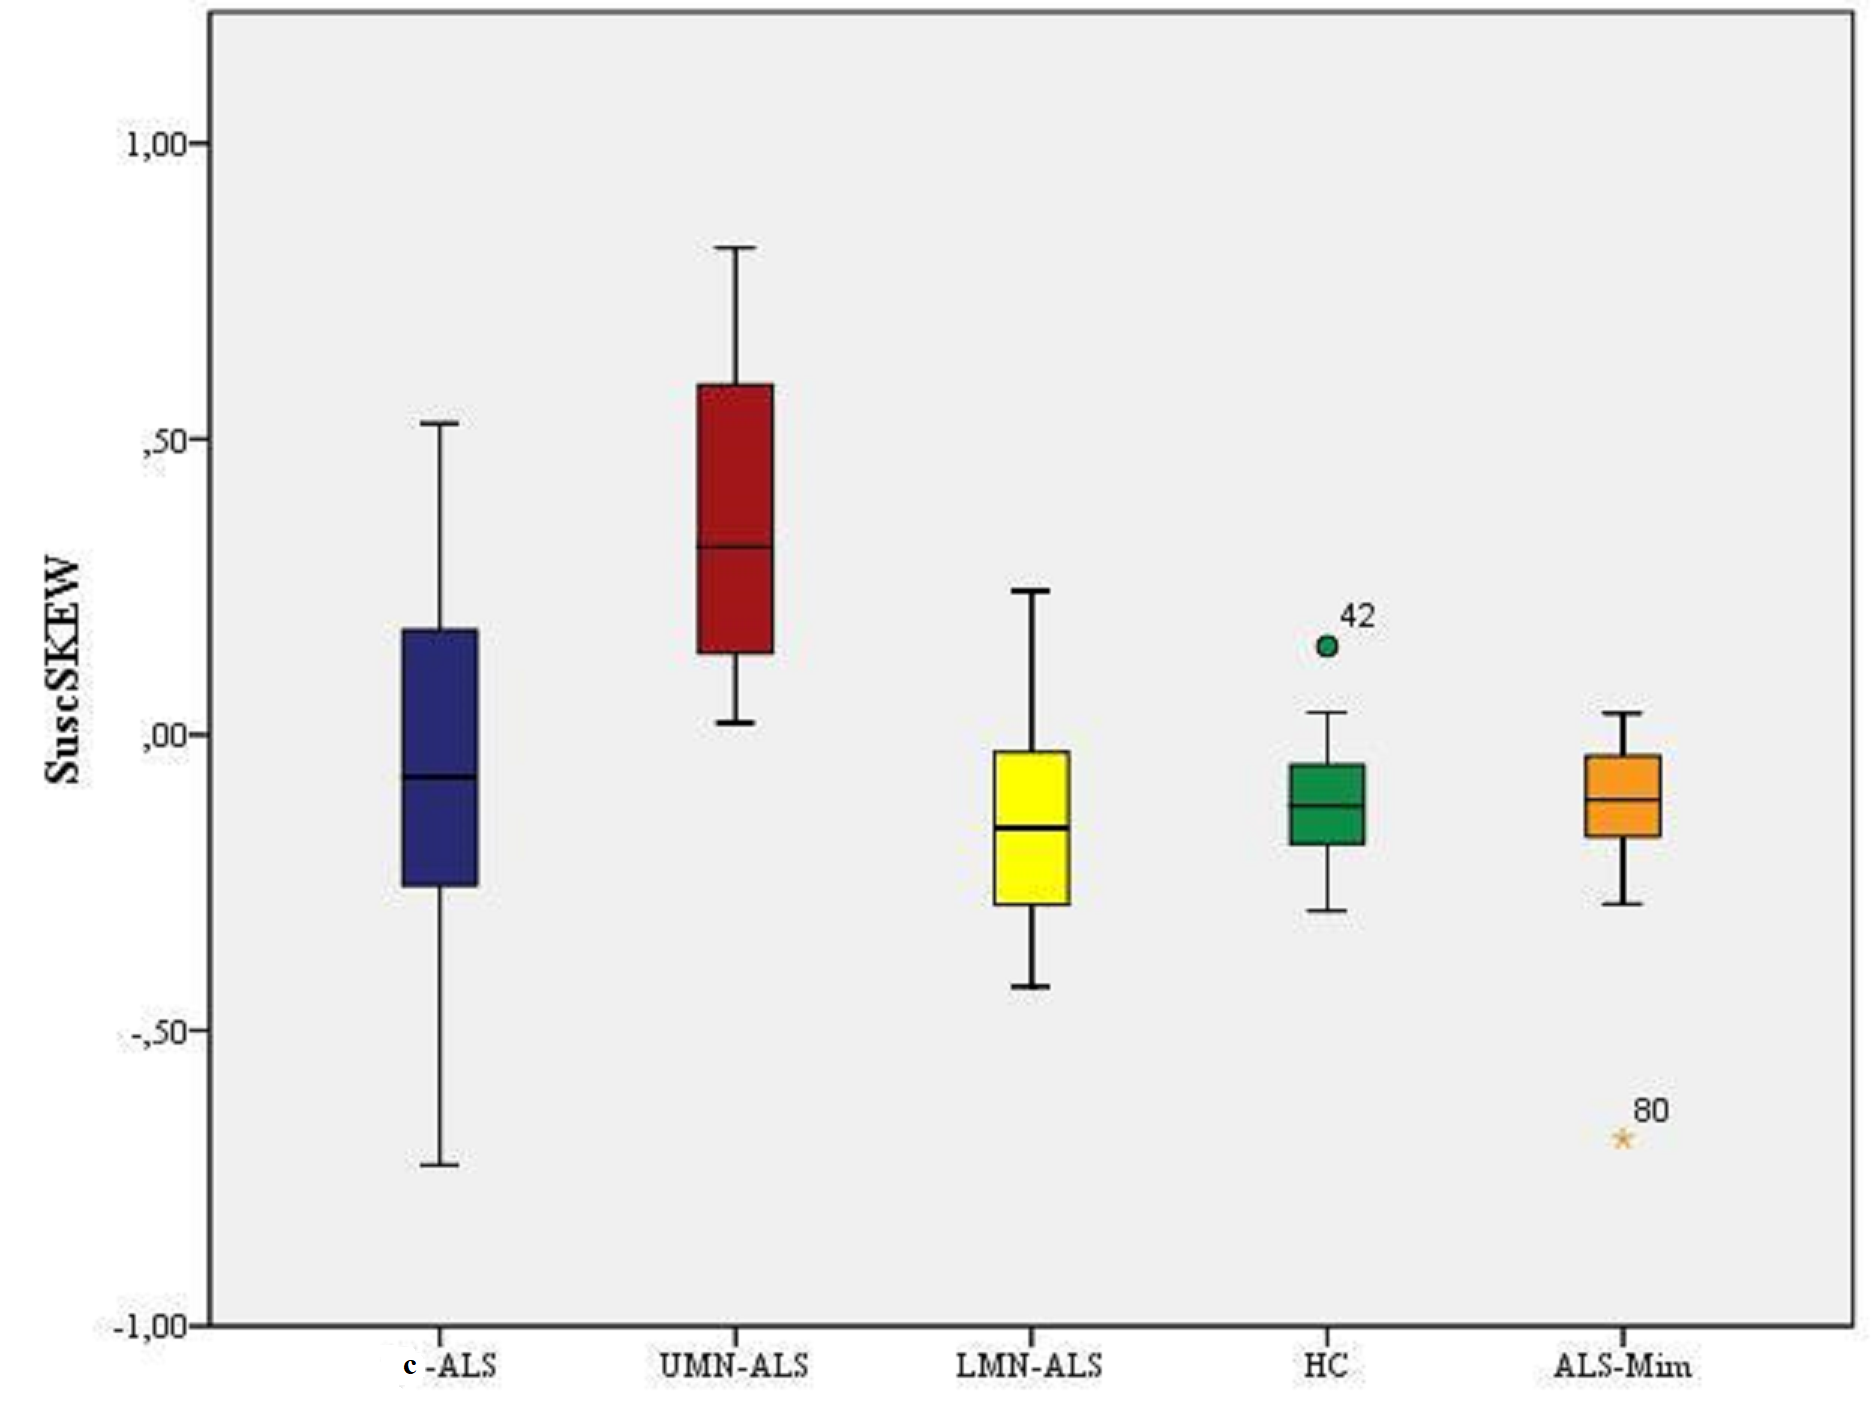
SuscSkew in
ALS-phenotypes (i.e. C-ALS, UMN-ALS and LMN-ALS), HC and MIMIC-ALS
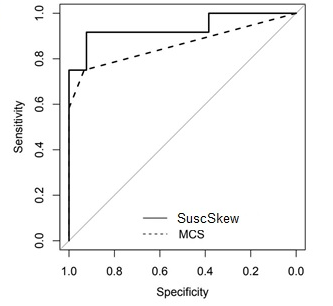
Receiver operating characteristic (ROC) analyses on MSC and skewness of the susceptibility values in the precentral cortex (SuscSkew) in differentiating UMN-ALS and ALS-Mim.
DOI: https://doi.org/10.58530/2023/1728