1727
High resolution probabilistic in-vivo atlas of Nigrosome 11IRCCS Stella Maris, Pisa, Italy, 2IMAGO7 Foundation, Pisa, Italy, 3Azienda Ospedaliero-Universitaria Pisana, Pisa, Italy, 4University of Genoa, Genoa, Italy, 5University of Pisa, Pisa, Italy
Synopsis
Keywords: Neurodegeneration, Neurodegeneration, Atlas, Nigrosome
Iron accumulation in Nigrosome 1 (N1) may represent an important biomarker in neurodegenerative disorders but its small dimension and the vanishing swallow tail sign in patients make the segmentation of this region challenging. We propose a probabilistic atlas of N1 created on a multimodal (T1-w and T2*-w) template using ROIs that were manually drawn on 0.6mm-isotropic T2*-weighted images of twenty healthy subjects. Its usability and accuracy were tested on four additional subjects by comparing the mean N1 susceptibility and T2* obtained using the atlas to those obtained from manual ROIs and by measuring their geometrical proximity.Introduction
Nigrosome 1 (N1) is an ovoidal area corresponding to the ventrolateral tier of Substantia Nigra pars compacta (SNc) and it is involved in the processes of iron accumulation in neurodegenerative and motor disorders and in their prodromal stages1–3. While for healthy subjects it appears as hyperintense in T2*-weighted images with respect to the neighboring SN forming the so-called Swallow Tail Sign (STS), in patients it may become abnormally hypointense and the absence of the STS is considered a biomarker of the disease4–6. The MRI-based assessment of N1 requires high resolution images and manual segmentation, as, to the best of our knowledge, no N1 atlas is currently available. However, this procedure is operator-dependent and unfeasible in patients whose N1 is indistinguishable from the surrounding SN. For these reasons, we acquired high-resolution multi-echo GRE images on healthy volunteers and created an in-vivo probabilistic atlas of N1 to facilitate the study of this region.Methods
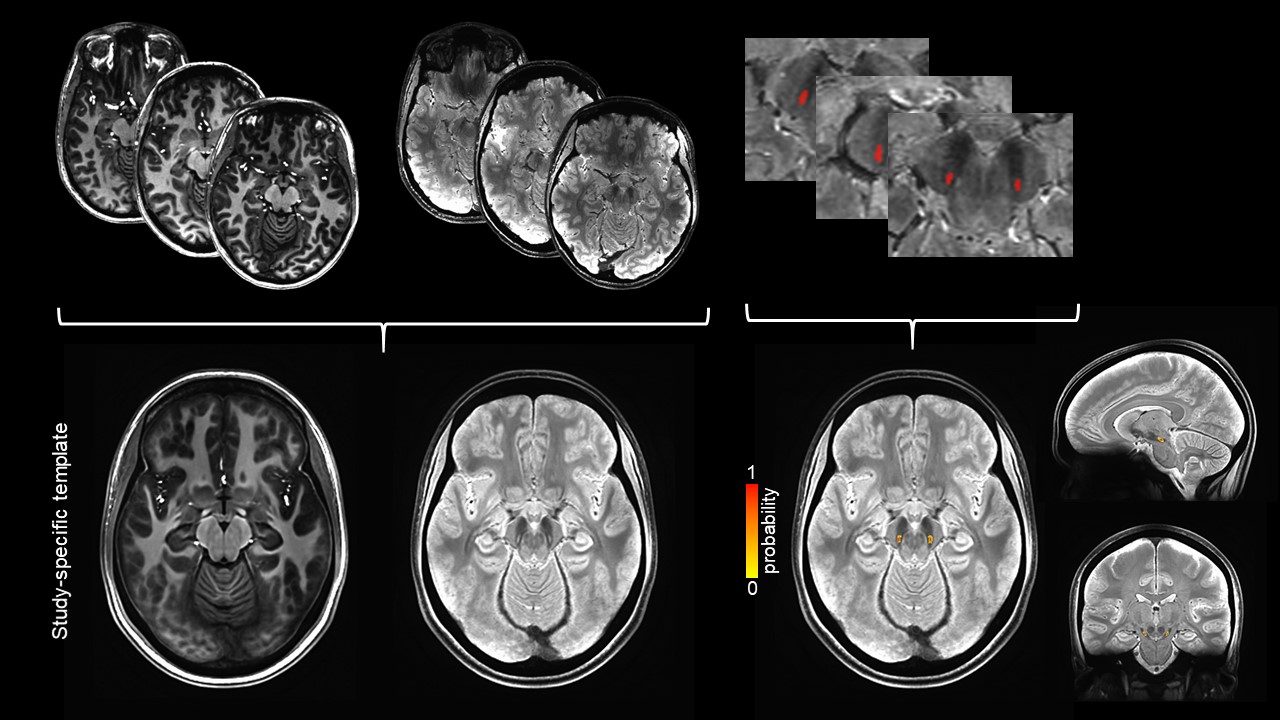
Twenty healthy volunteers (age: 27±4 years old, 11 females) were retrospectively enrolled in this study. Each subject underwent an examination on a 7T MRI scanner (SIGNA7T, GE Healthcare) including a T1-weighted MPRAGE (voxel size=0.8x0.8x0.8mm3, TE/TR=3.5/3380ms, TI=1100ms) and a multi-echo GRE (voxel size=0.6x0.6x0.6mm3, matrix=360x360x280, TR=30ms, five echoes, TE=5:5.9:28.6ms, BW=41.4kHz, ARC acceleration phase/slice=2/2, compressed sensing acceleration=2). The echoes of the T2*-w images were averaged together to increase signal-to-noise ratio. QSM maps were computed from GRE phase images using Laplacian unwrapping7, background field removal8 and iLSQR method9 in STI Suite, while T2* maps were obtained by fitting the magnitude of each echo using an exponential decay curve. The T1-w images were bias-corrected using ANTs and coregistered to the corresponding bias-corrected T2*-w images and then aligned to the bicommissural plane. A multimodal study-specific template was created using T1-w and T2*-w images via ANTs. For each subject and each hemisphere, a N1 ROI was manually drawn by a neuroradiologist over the T2*-weighted images. We measured volume, mean susceptibility and T2* of N1 ROIs. Differences between left and right were tested using the Wilcoxon signed rank test. They were then wrapped to the study-specific template. The percentage of overlap of the ROIs from all subjects was computed to obtain a probabilistic ROI for N1. To provide the probabilistic ROIs in a standard space and provide their coordinates, the T1-w image of the template was registered to the MNI152 (NLIN aysm 2009b) space. N1 ROIs were drawn on the T2*-w image of four additional test subjects that were then warped to the template. The geometric distance between the probabilistic and the manually segmented ROI was measured and the average values in the ROI was compared using coefficient-of-variation (CV) for both T2* and QSM values.Results
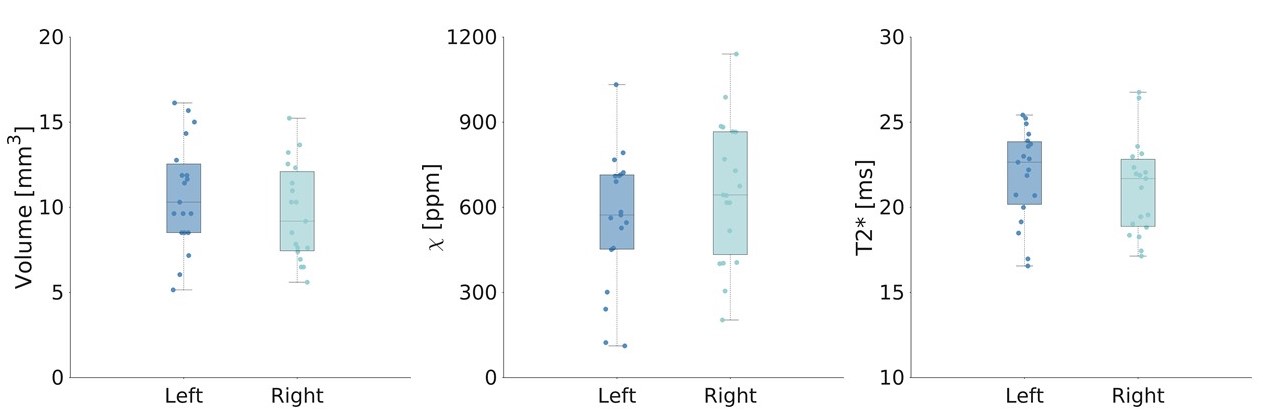
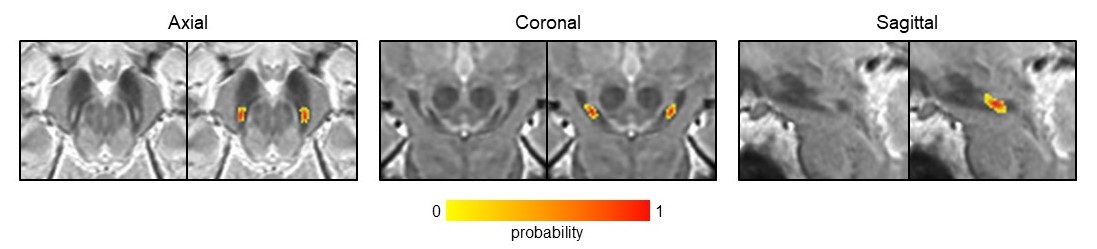
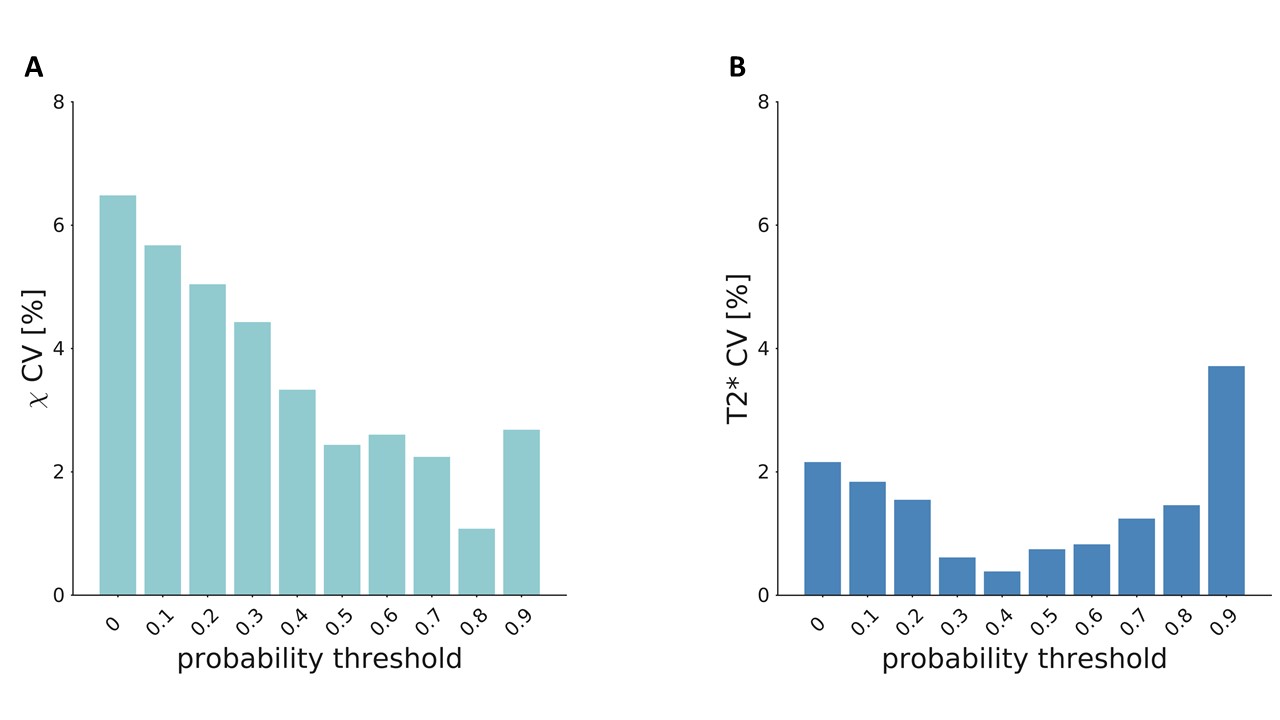
The manually drawn ROIs included 46±13 voxels resulting in a volume of 10±3mm3 [range: 5.1-16.1mm3], with a mean susceptibility of 0.061±0.025ppm and a mean T2* of 21.5±2.7ms (Figure 1). We found no differences in volume and mean susceptibility and T2* between left and right N1 (p>0.05) (Figure 1). The study-specific template and the probabilistic N1 ROIs are shown in Figure 2, together with the manually drawn ROIs for three exemplary subjects. A maximum probability of 1 and 0.95 was reached in left and right N1, respectively (Figure 3). The volumes of the unthresholded ROIs were 29.6mm3 and 27.0mm3 for left and right N1, respectively, and their volume became similar to those of the manual ROIs when setting a probability threshold of ∼0.35. The coordinates of the center of mass in the MNI space (LPI order) were (10.8,-21.7,-13.8)mm and (-10.9,-21.7,-13.8)mm for right and left N1. In the test subjects, the distance between the centers of mass of the manual ROI and the atlas was lower than 1 mm on average. The CV obtained comparing mean susceptibility and T2* obtained using the manually drawn ROI and the probabilistic ROI was <7% and <4%, respectively, on average across subjects and for different probability thresholds (Figure 4).Discussion
The probabilistic N1 atlas presented in this work was obtained from ROIs that were manually drawn on T2*-weighted images and by creating a template. Despite the small volume of N1 and even though higher spatial resolutions might increase the precision of manual segmentation, we obtained high registration accuracy. The usage of both T1- and T2*-weighted images improved template quality and facilitated the registration to the MNI space. The usability and generalizability of this atlas is suggested by the small CV obtained on a separate groups of test subjects and by the proximity of the center of mass of manual ROIs to the probabilistic one. In future studies we will assess the performance of an additional atlas obtained by drawing the ROIs on QSM images, we will aim at enlarging the population in order to increase its robustness and we will make it freely available for the MRI community.Conclusion
We proposed a high-resolution probabilistic N1 atlas that can facilitate the study of this region, especially in pathologies where it is difficult to locate, and assessed its robustness and usability.Acknowledgements
Support from the Italian Ministry of Health via the RC 2022 and “5 per mille” to IRCCS Fondazione Stella Maris.References
1. Fearnley JM, Lees AJ. Ageing and Parkinson’s disease: substantia nigra regional selectivity. Brain. 1991;114(5):2283-2301. doi:10.1093/brain/114.5.2283
2. Lancione M, Donatelli G, Del Prete E, et al. Evaluation of iron overload in nigrosome 1 via quantitative susceptibility mapping as a progression biomarker in prodromal stages of synucleinopathies. NeuroImage. 2022;260:119454. doi:10.1016/j.neuroimage.2022.119454
3. Moreno-Gambín MI, Tembl JI, Mazón M, et al. Role of the nigrosome 1 absence as a biomarker in amyotrophic lateral sclerosis. J Neurol. 2022;269(3):1631-1640. doi:10.1007/s00415-021-10729-w
4. Blazejewska AI, Schwarz ST, Pitiot A, et al. Visualization of nigrosome 1 and its loss in PD: Pathoanatomical correlation and in vivo 7 T MRI. Neurology. 2013;81(6):534-540. doi:10.1212/WNL.0b013e31829e6fd2
5. Cosottini M, Frosini D, Pesaresi I, et al. MR Imaging of the Substantia Nigra at 7 T Enables Diagnosis of Parkinson Disease. Radiology. 2014;271(3):831-838. doi:10.1148/radiol.14131448
6. De Marzi R, Seppi K, Högl B, et al. Loss of dorsolateral nigral hyperintensity on 3.0 tesla susceptibility-weighted imaging in idiopathic rapid eye movement sleep behavior disorder. Ann Neurol. 2016;79(6):1026-1030. doi:10.1002/ana.24646
7. Li W, Avram AV, Wu B, Xiao X, Liu C. Integrated Laplacian-based phase unwrapping and background phase removal for quantitative susceptibility mapping. NMR Biomed. 2014;27(2):219-227. doi:10.1002/nbm.3056
8. Schweser F, Deistung A, Lehr BW, Reichenbach JR. Quantitative imaging of intrinsic magnetic tissue properties using MRI signal phase: An approach to in vivo brain iron metabolism? NeuroImage. 2011;54(4):2789-2807. doi:10.1016/j.neuroimage.2010.10.070
9. Li W, Wang N, Yu F, et al. A method for estimating and removing streaking artifacts in quantitative susceptibility mapping. NeuroImage. 2015;108:111-122. doi:10.1016/j.neuroimage.2014.12.043
Figures