1725
Downfield 1H MRS can quantify age and hypoxia induced changes in brain NAD+
Emine Can1, Baby Martin-McNulty1, Ganesh Kolumam1, and Johannes Riegler1
1Calico Life Sciences LLC, South San Francisco, CA, United States
1Calico Life Sciences LLC, South San Francisco, CA, United States
Synopsis
Keywords: Neurodegeneration, Aging, Lifespan, Stroke, metabolism, Spectroscopy, Brain
NAD+ is required for vital cellular processes such as redox regulation, DNA damage repair and cell signaling. There has been a growing interest in modifying NAD+ concentrations in the hope that it might increase longevity. However, there is no clear consensus on changes in NAD+ concentration due to healthy aging. Commonly used in vitro assays for NAD quantification are not suitable for longitudinal studies. We therefore implemented an in vivo downfield 1H MRS method to characterize NAD+ concentrations during aging in mice and showed that 1H MRS can detect hypoxia induced changes in brain NAD+ concentrations.Introduction
Nicotinamide adenine dinucleotide (NAD+) is a fundamental biomolecule that regulates cellular energy metabolism as an electron carrier (NAD+ /NADH redox couple); and it is a critical co-substrate consumed in DNA repair, calcium signaling, epigenetic regulation and oxidative stress response. Changes in cellular NAD concentrations have been associated with aging, neurodegenerative, and metabolic diseases in several species including humans 1,2. Modulation of intracellular NAD+ concentrations by supplementation with NAD precursors or inhibiting NAD consuming enzymes is studied due to its potential in prolonging and improving healthy lifespan 3. The conventional ex-vivo methods to characterize NAD concentrations are not suitable to study longitudinal changes in NAD. The feasibility of noninvasive quantification of NAD by 31P/ 1H MR spectroscopy (MRS) in rats and humans has been demonstrated previously 4,5,6. In this study we investigated if NAD+ concentrations in C57BL/6J mouse brains change with age for the first time with localized downfield 1H MRS using a LASER sequence at 9.4T. In addition to age-related changes, we show how neuronal damage affects NAD+ concentrations in a hypoxic ischemic stroke model.Materials and Methods
Animals: C57BL/6J mice (3 months to 3 years old for the cross-sectional aging study, 33 males, ~31 g; and ~2 months old for the stroke study, n=15, ~28 g) were anesthetized with isoflurane (1.5 %) and the body temperature was maintained at 37±0.4°C inside the MRI bore using a water and air heating system.Hypoxic ischemic stroke model: The left common carotid artery (CCA) was surgically ligated. Two hours after ligation, a baseline 1H MRS was acquired (normoxia). Three hours after CCA ligation, hypoxia was induced (7% O 2 , 0.7% isoflurane) and a second 1H MRS spectra acquired.
MRI Scans: Mouse 1H MR spectra were acquired using a preclinical 9.4T (BioSpec 94/20 USR) horizontal bore scanner (Bruker, Ettlingen, Germany) with a shielded gradient system (660 mT/m) equipped with a 1H CryoProbeTM receiver centered in a decoupled 86 mm transmit/receive volume coil (Bruker, Ettlingen,Germany). For the cross-sectional aging study, 2D T1‐w anatomic three-plane localizer images acquired for voxel localization: 7 slices, TR/TE = 15/3 ms; flip angle = 10°; resolution = 0.13 × 0.13 x 1 mm3. To maximize the SNR a voxel of 5.5 × 4 × 6 mm3 was placed within the brain and ROI-based B0 shimming (MAPSHIM) performed (Figure 1). For the stroke study, the voxel size was reduced to 2.75 x 4 x 6 mm3 to fit within the left hemisphere affected by the ligation of the left common carotid artery. NAD+ spectra were acquired using a LASER (Localization by Adiabatic Selective Refocusing) sequence with frequency selective excitation: 90° E-BURP-1, 3500 ms with 3.2 ppm excitation range; and spatially selective refocusing: AFP sech pulses ( 1.49 ms, 2000 Hz). The working chemical shift was set to 9.1 ppm. Total scan time was 50 min with a TR of 2 s, TE of 22.1 ms, and 1500 averages. Water reference spectra were acquired using the same sequence and with the following parameters: TR: 8 s, excitation and refocusing pulses set at 4.7 ppm, 8 averages.
Data analysis: Post processing of MR spectra was performed using custom written scripts using the FIDAppliance (FID-A) library in MATLAB R2022a 7. NAD+ H2, H6, NAA, and reference water peaks were fitted as Lorentzian peaks and NAD+ concentration calculated following Bagga et al 6. Statistical analysis was performed with R-Studio.
Results and Discussion
NAD+ was detected reliably in mouse brains using downfield 1H MRS with LASER localization (test / retest CV= 25 %). NAD-H2 and H6 resonances were detected at 9.35 ppm and 9.1 ppm, respectively (Fig. 1). Alterations in mouse brain NAD+ concentrations due to age or hypoxic exposure were investigated (Fig. 2 and Fig. 3). A cross sectional aging study showed a NAD+ decline of 17.5 % between 2 and 3 years of age in agreement with observations in humans 6, albeit the decline was not statistically significant (p=0.19, R2 = 0.10). NAD+ concentrations measured during hypoxia relative to baseline showed a significant decline (p<0.05, paired t-test) highlighting the increased demand for NAD+ by the enzymatic processes involved in oxidative stress responses, and hypoxic adaptations.Conclusion
Our cross-sectional aging study showed that NAD+ can be quantified reliably with 1H MRS in mouse brains. We observed a trend for age related NAD+ decline in the mouse brain. Ongoing experiments will verify if this is a robust decline. During hypoxia we observed significant NAD+ decline in the affected hemispheres of mice used for a hypoxic ischemic stroke model.Acknowledgements
No acknowledgement found.References
1) Verdin, Eric. "NAD+ in aging, metabolism, and neurodegeneration." Science 350.6265 (2015): 1208-1213.2) Yoshino, Jun, Joseph A. Baur, and Shin-ichiro Imai. "NAD+ intermediates: the biology and therapeutic potential of NMN and NR." Cell metabolism 27.3 (2018): 513-528.
3) Peclat, Thais R., et al. "CD38 inhibitor 78c increases mice lifespan and healthspan in a model of chronological aging." Aging cell 21.4 (2022): e13589.
4) de Graaf, Robin A., and Kevin L. Behar. "Detection of cerebral NAD+ by in vivo 1H NMR spectroscopy." NMR in biomedicine 27.7 (2014): 802-809.
5) de Graaf, Robin A., et al. "Detection of cerebral NAD+ in humans at 7T." Magnetic resonance in medicine 78.3 (2017): 828-835.
6) Bagga, Puneet, et al. "Single‐Voxel 1H MR spectroscopy of cerebral nicotinamide adenine dinucleotide (NAD+) in humans at 7T using a 32‐channel volume coil." Magnetic resonance in medicine 83.3 (2020): 806-814.
7) Simpson R, Devenyi GA, Jezzard P, Hennessy TJ, Near J. Advanced processing and simulation of MRS data using the FID appliance (FID‐A)—An open source, MATLAB‐based toolkit. Magnetic resonance in medicine. 2017 Jan 1;77(1):23-33
Figures
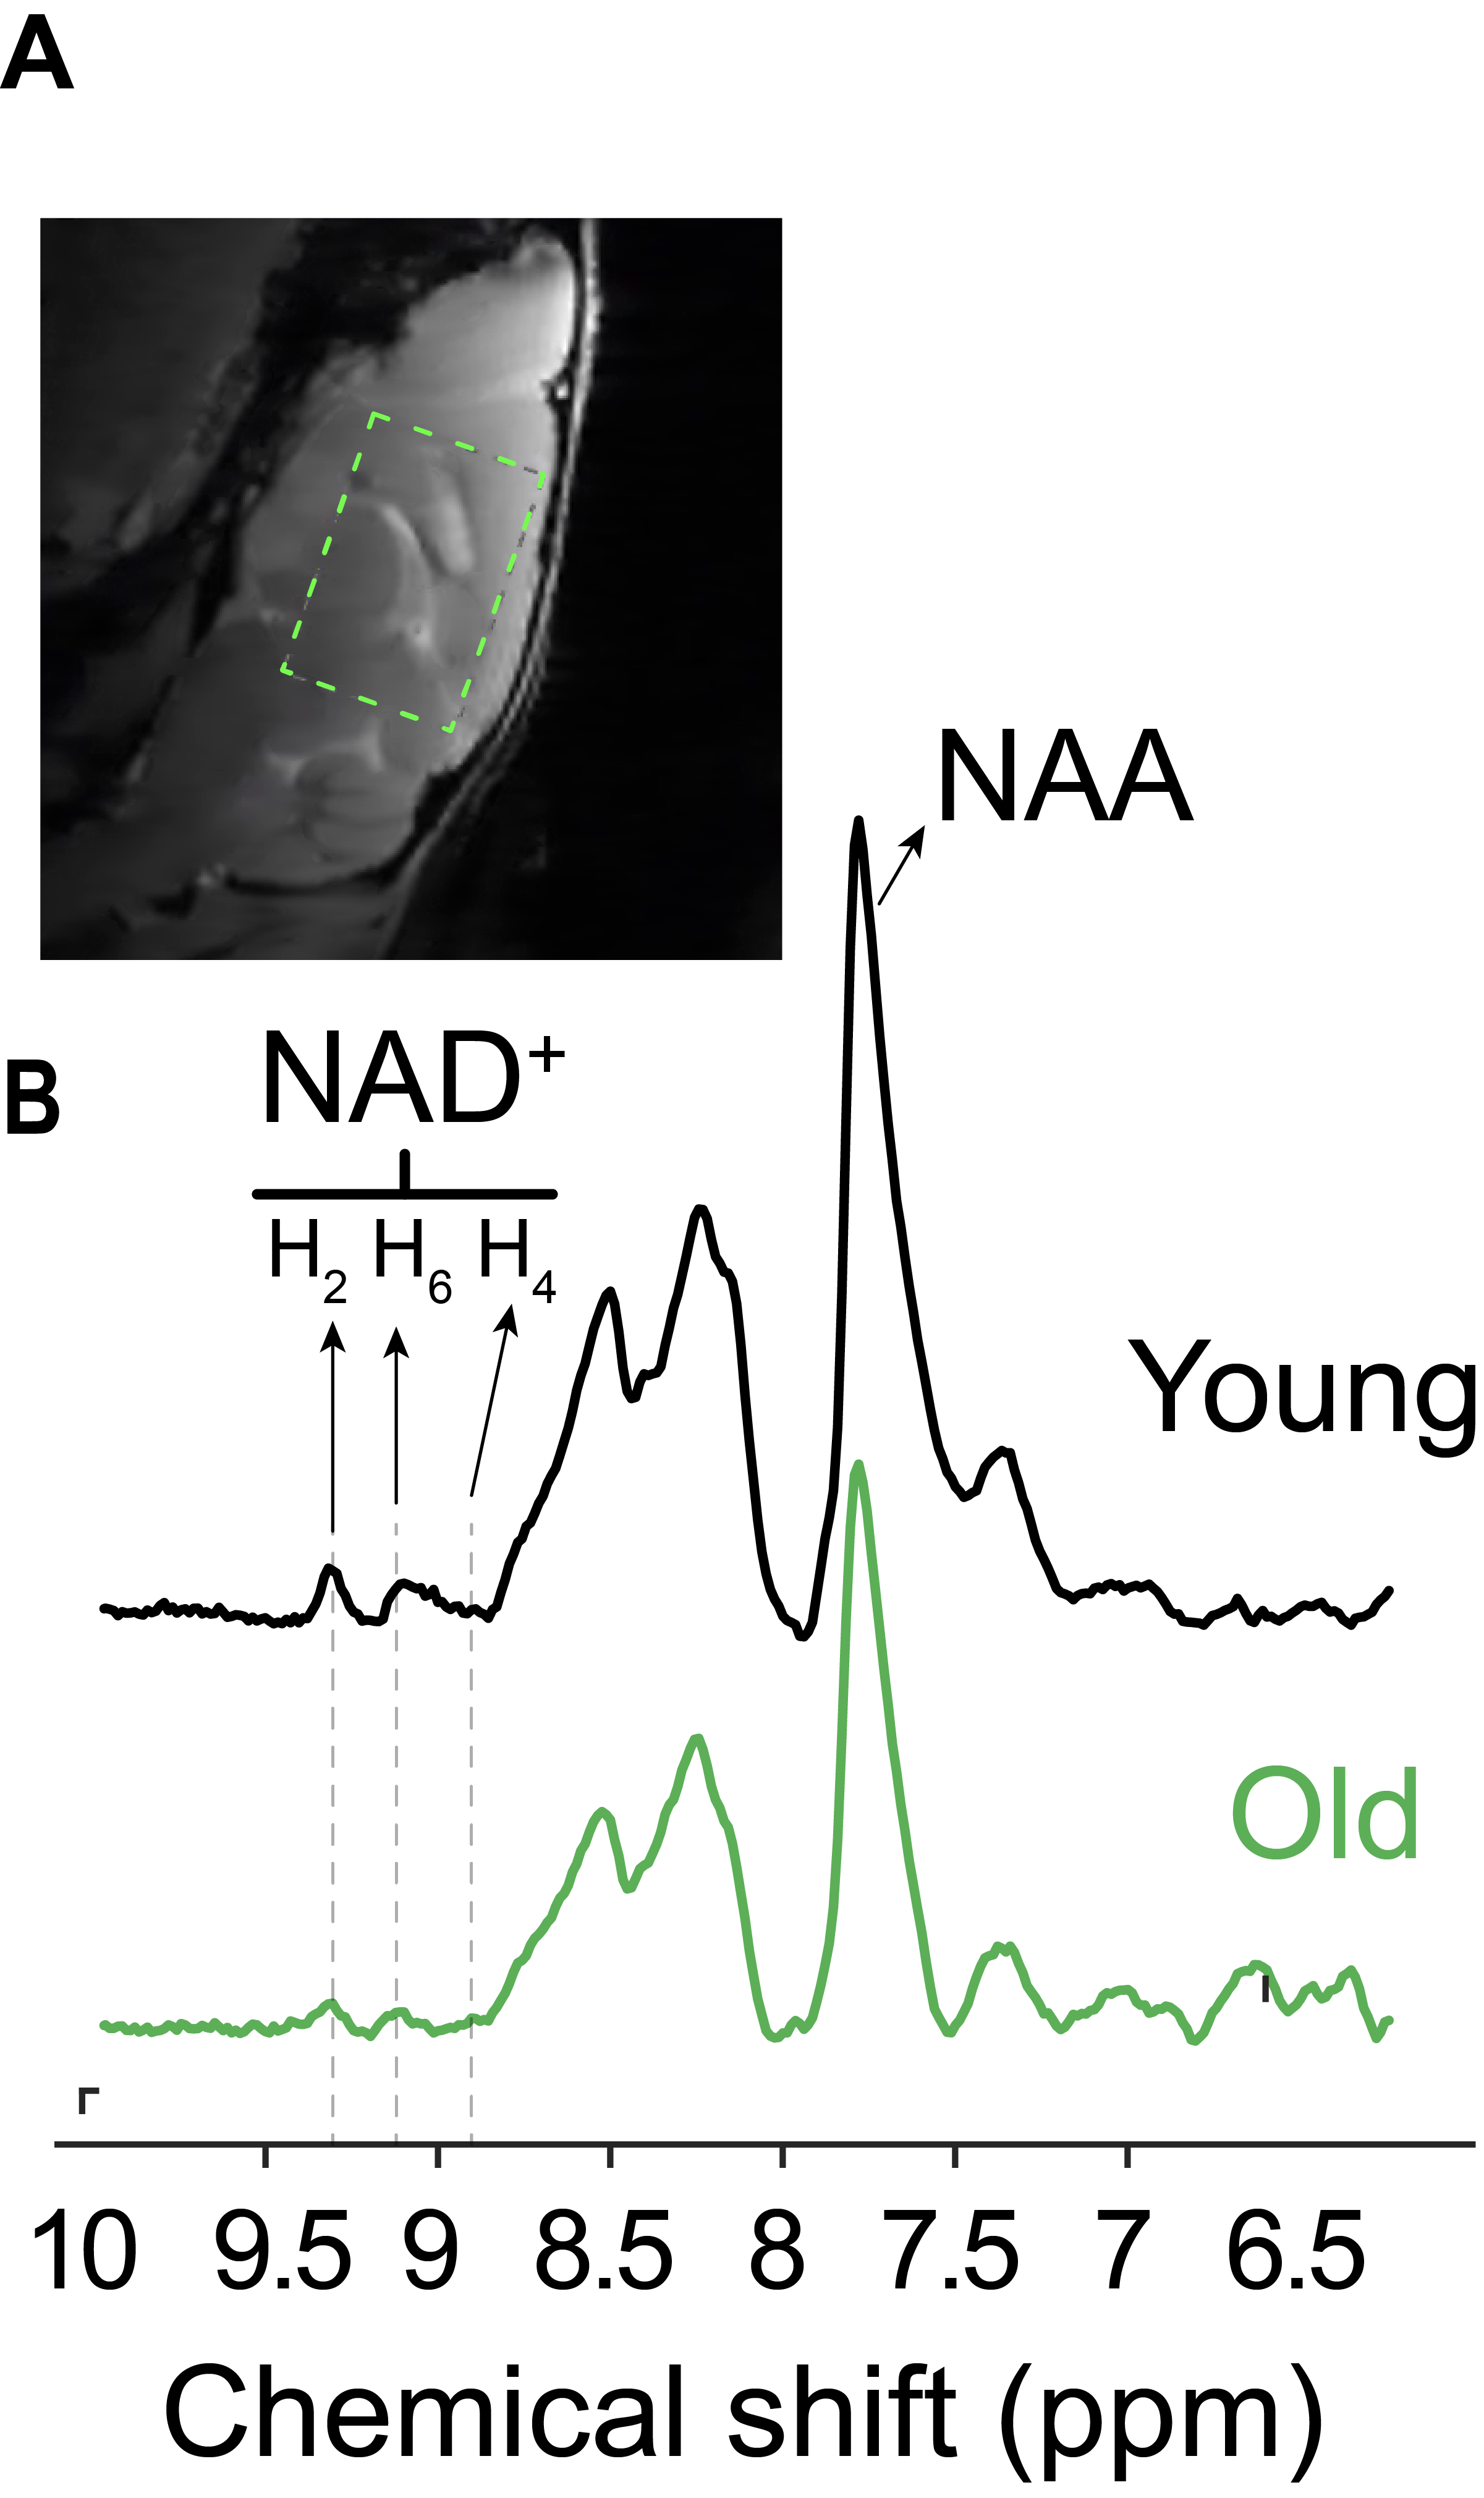
Fig. 1. Representative 1H MR spectra from young and old mice showing NAD+ H2 (9.35 ppm) and H6 (9.1 ppm) proton resonances. The acquisition voxel (5.5x4x6 mm3) is shown on the sagittal proton image of the mouse brain on top.
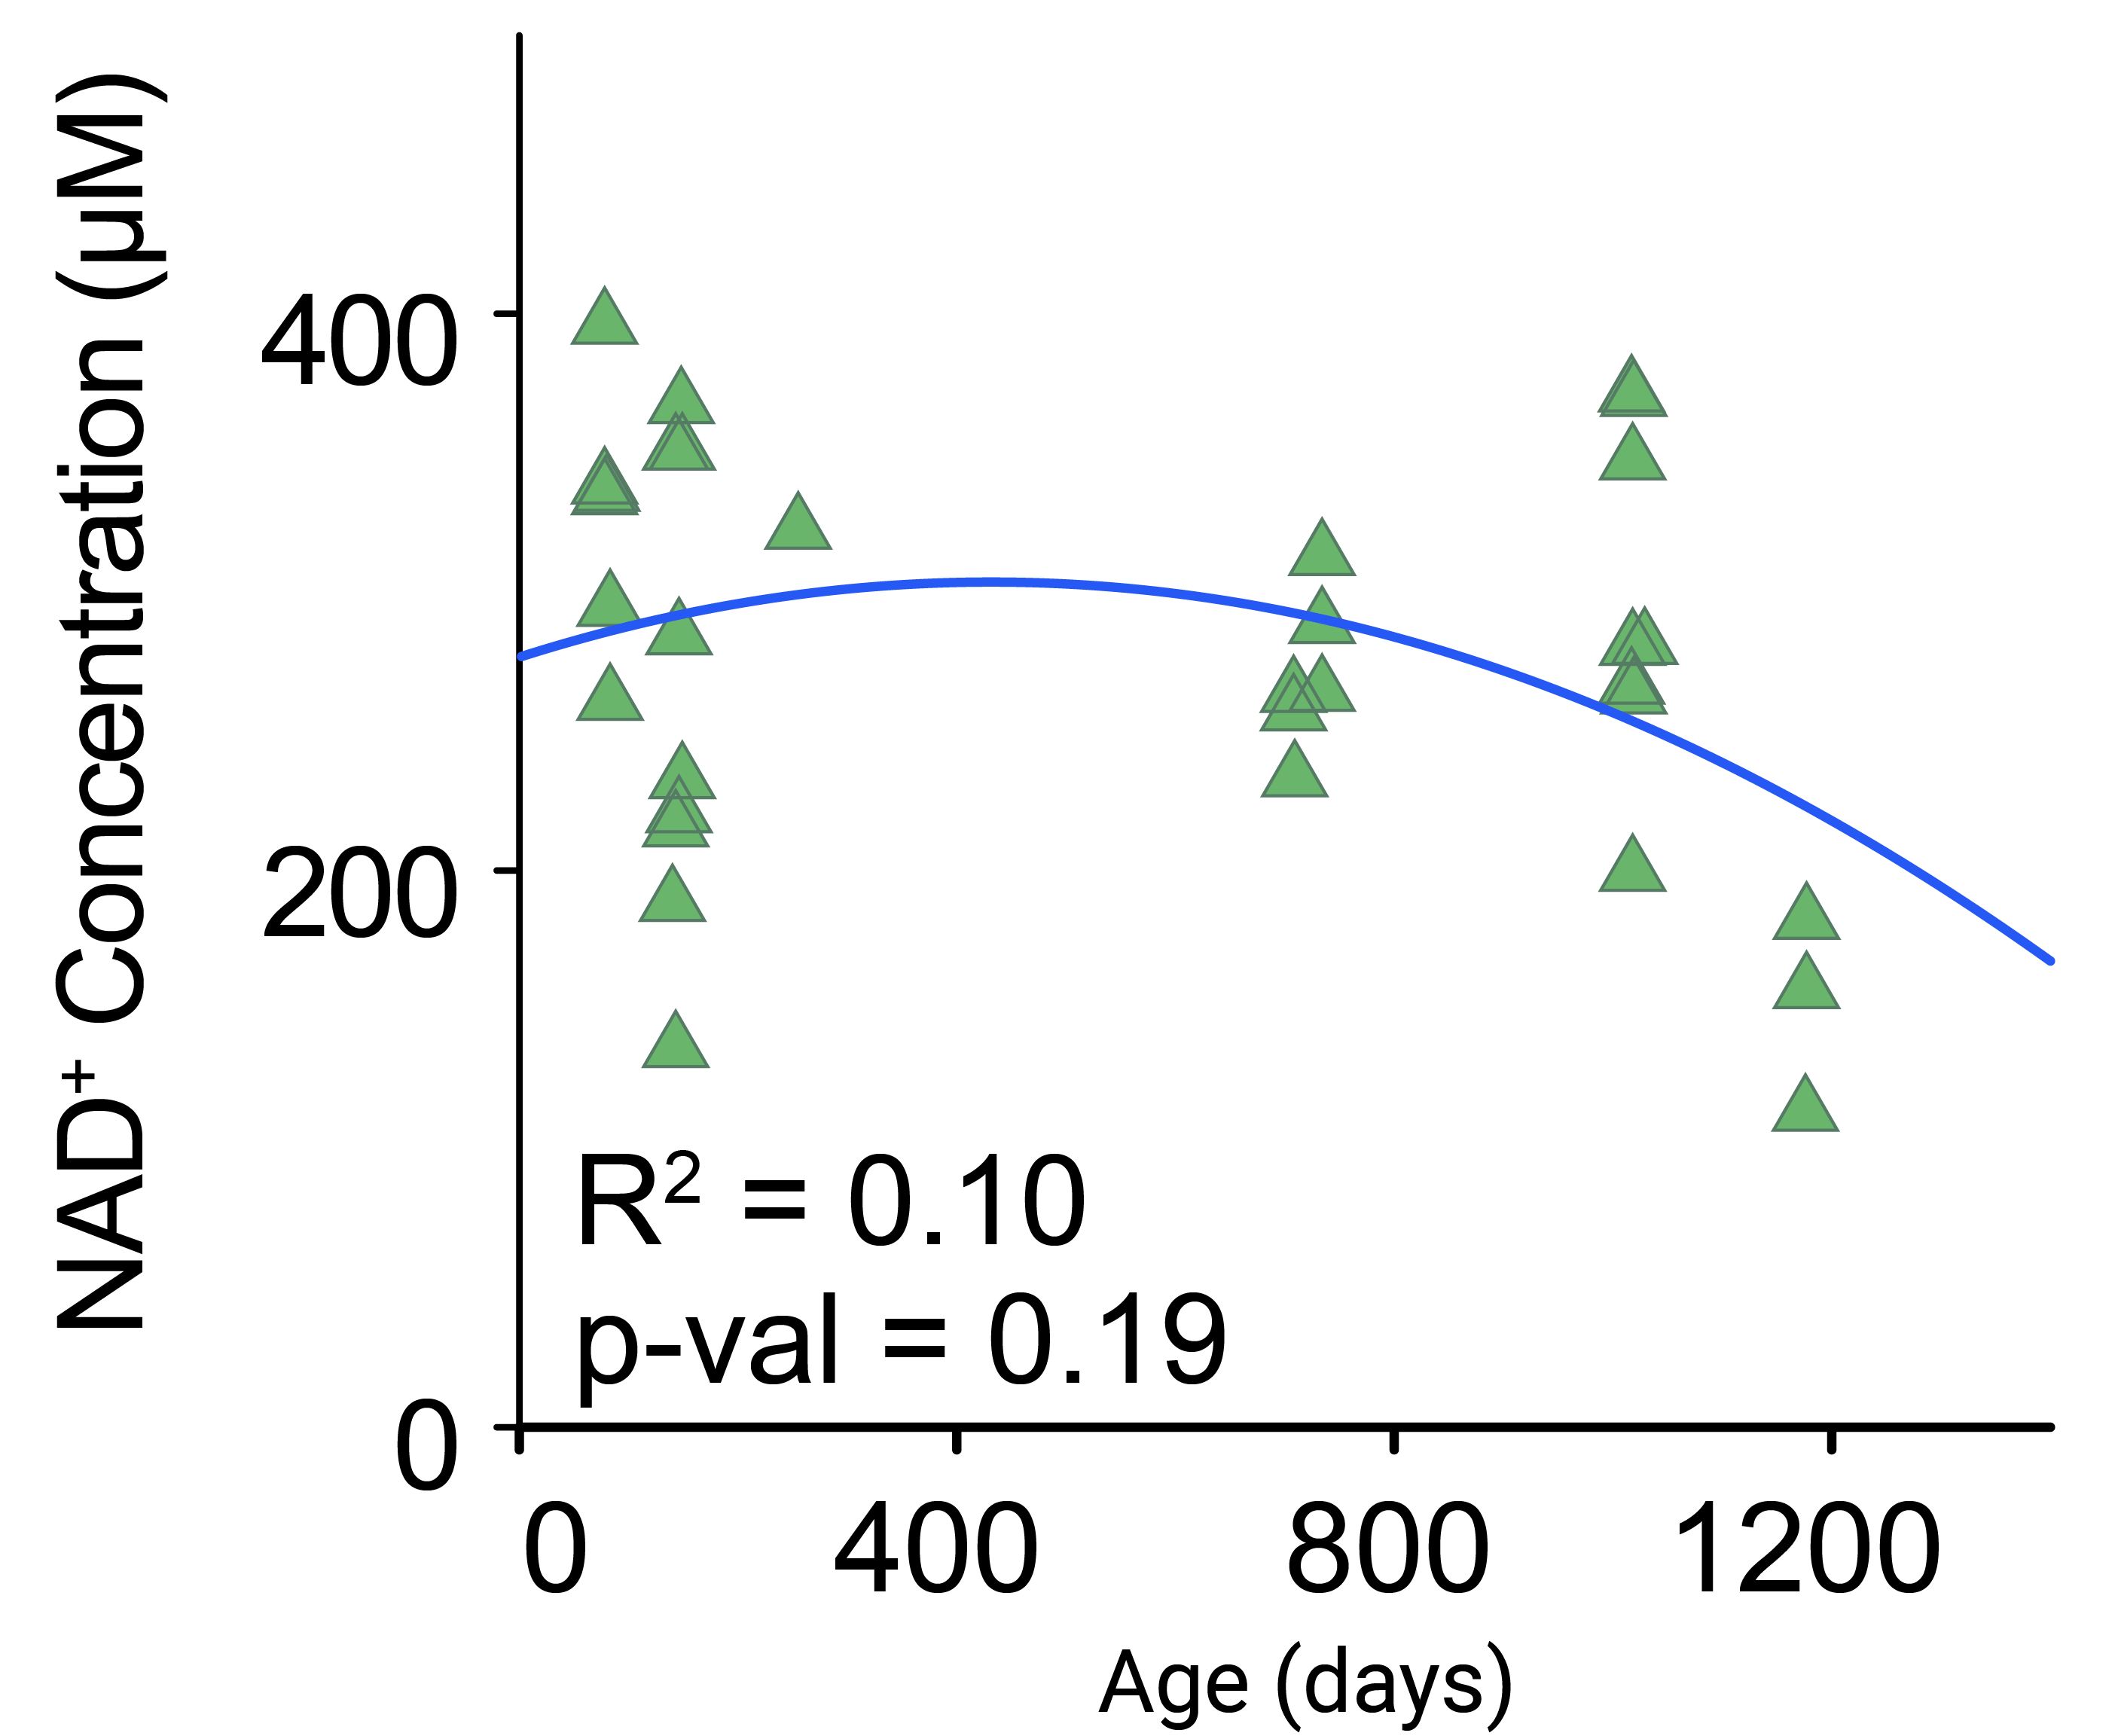
Fig. 2. NAD+ changes during aging in mouse brains. NAD+ concentrations might decline in mice brains > 2.5 years of age (n=33, p=0.19, R2=0.10).
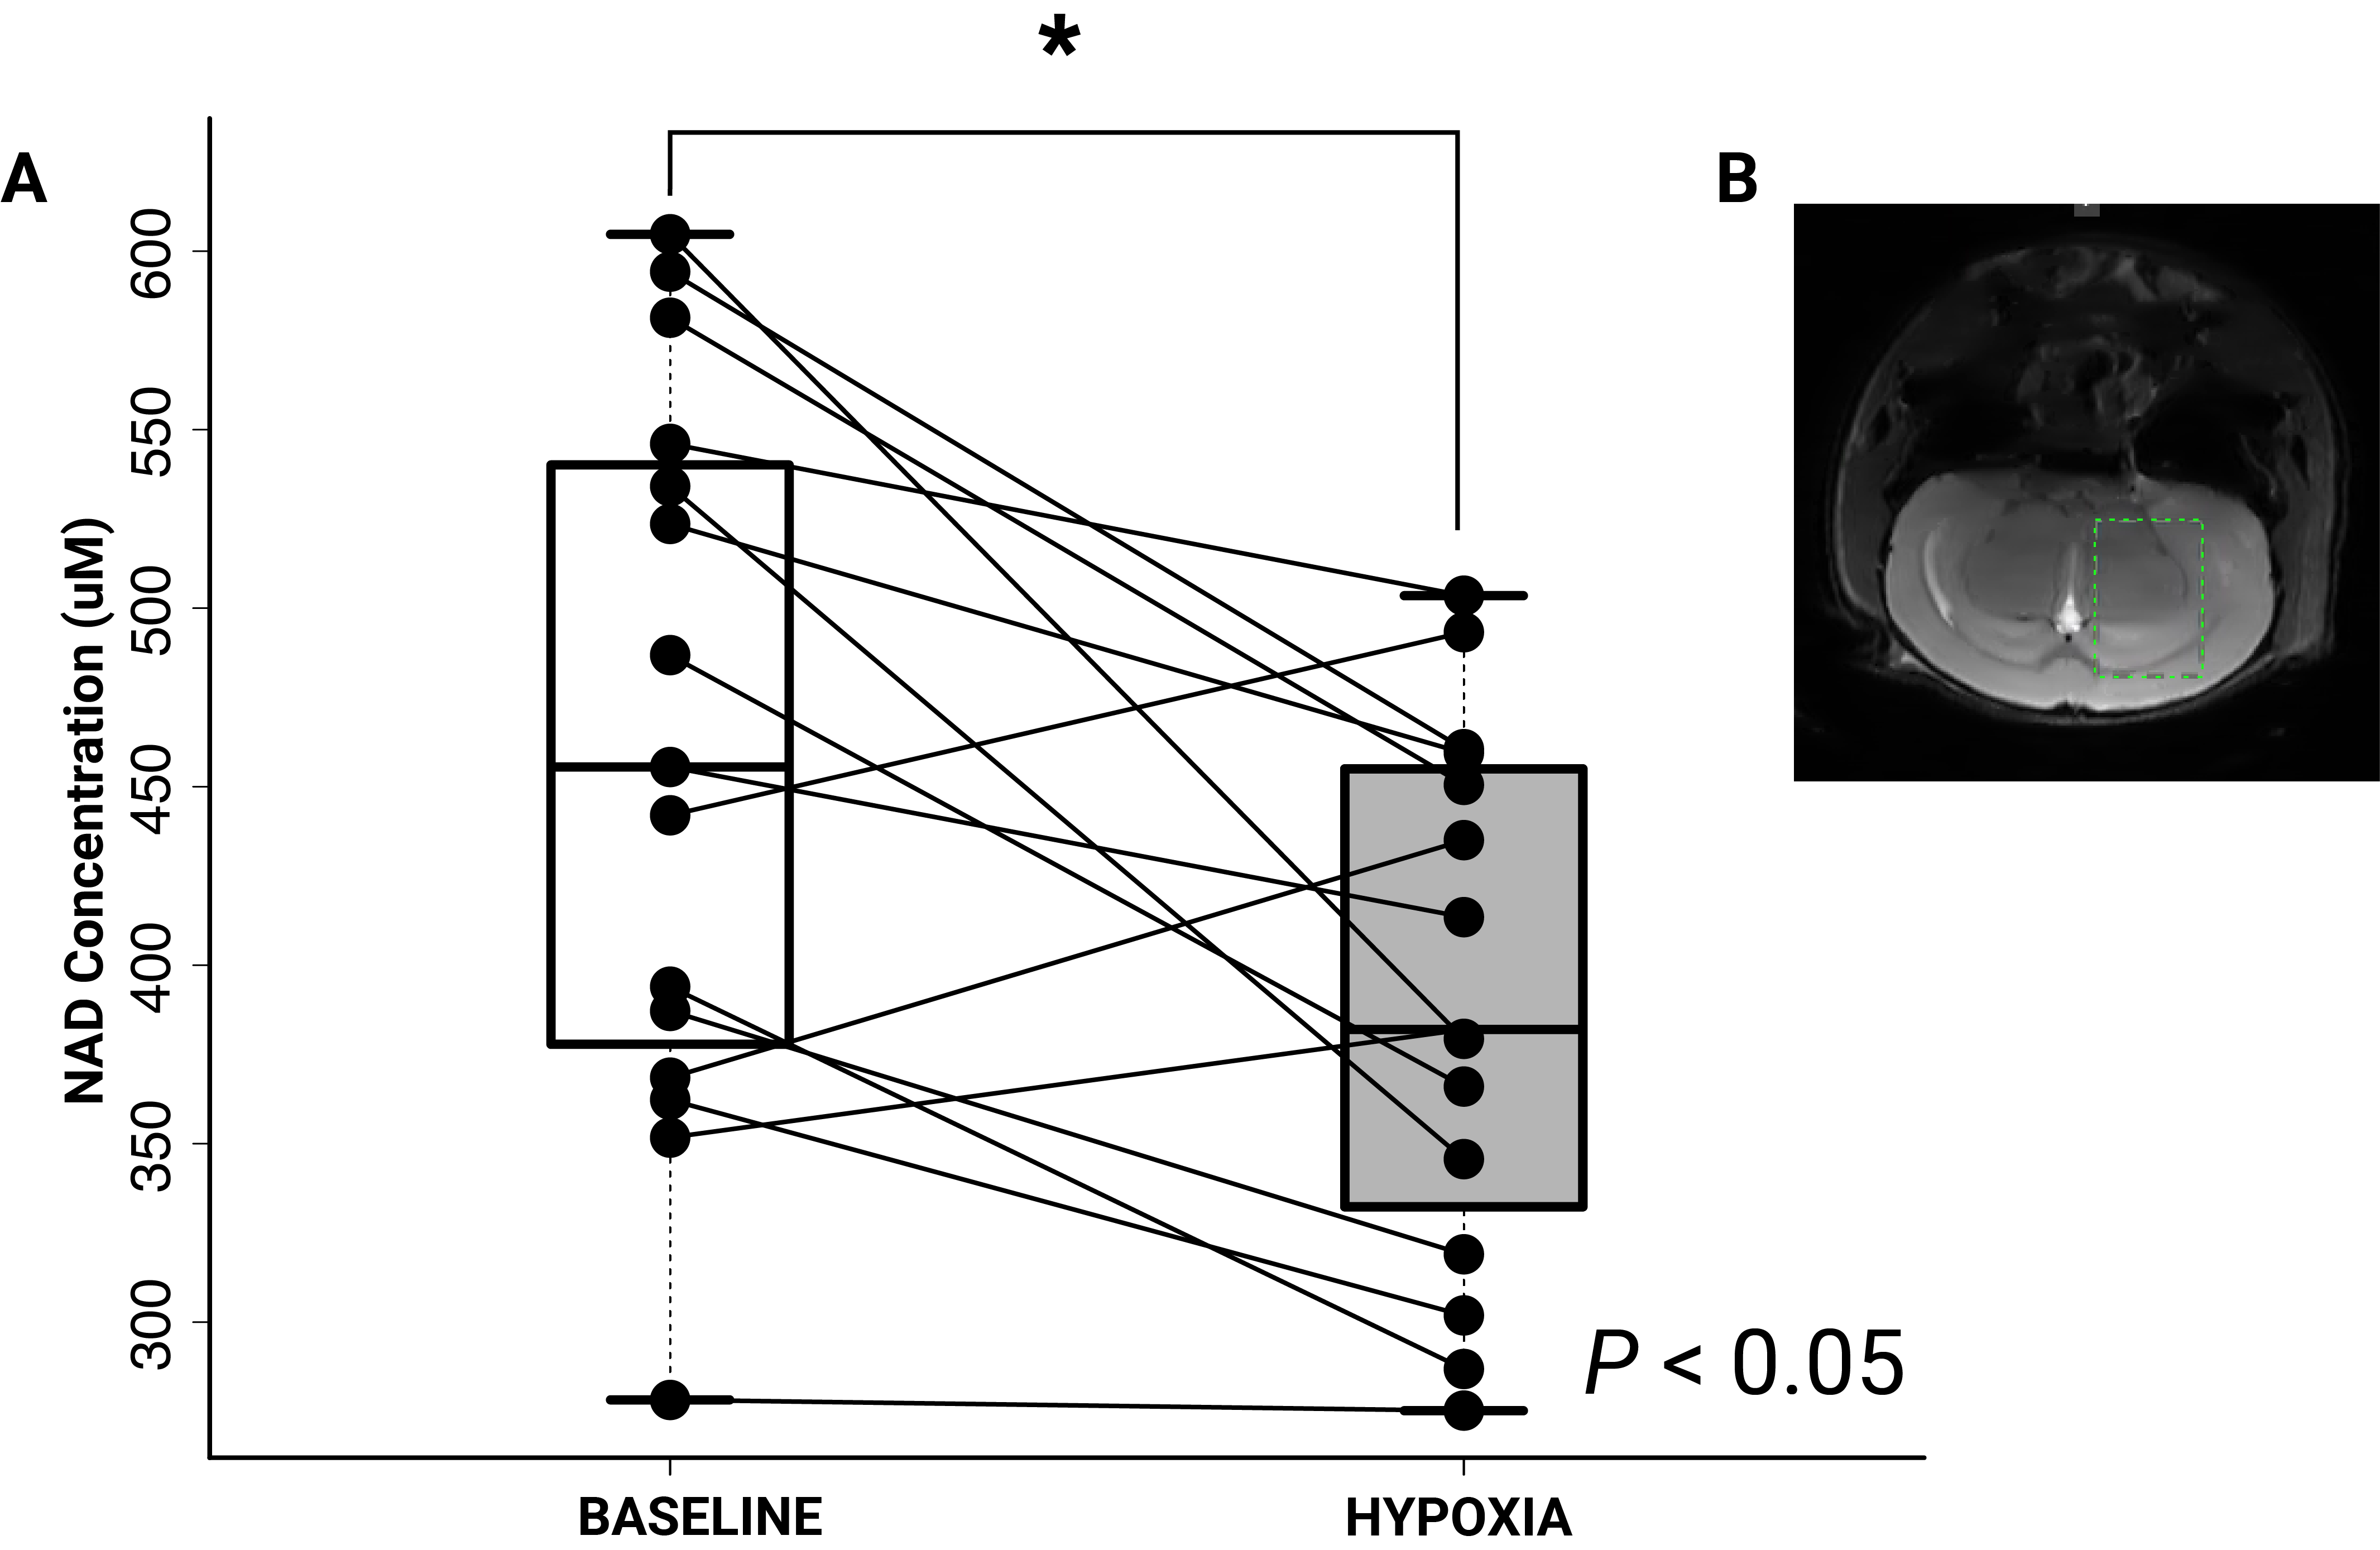
Fig. 3. NAD+ concentration changes during brain hypoxia. A) Change in NAD+ concentrations during hypoxia relative to baseline was observed (p < 0.05). B) Axial view of the mouse brain with the localization of the 1H MRS voxel outlined (green dashed line 2.75 x 4 x 6 mm3).
DOI: https://doi.org/10.58530/2023/1725