1705
Multi-parametric characterization of thalamic nuclei based on manual delineation using the Synthetic MPRAGE images1Department of Diagnostic Radiology and Nuclear Medicine, University of Maryland School of Medicine, Baltimore, MD, United States, 2Department of Electrical and Computer Engineering, Johns Hopkins University, Baltimore, MD, United States
Synopsis
Keywords: Traumatic brain injury, Tissue Characterization
The accurate delineation of thalamic nuclei is important in understanding the underlying pathophysiology associated with neurological disorders and in targeting specific thalamic nuclei in image guided interventions. However, sub-parcellation of the thalamic nuclei is challenging given the lack of contrast within the thalamus provided by conventional T1 or T2 images. In this study, we use synthesized MPRAGE images with different inversion time (TI) (SynTI) to accurately parcellate thalamic nuclei, as outlined by the Morel atlas. Additionally, we examined the distinct magnetic susceptibility and diffusion properties of individual nuclei, which can be used to further improve thalamic nuclei segmentation.Introduction
The individual thalamic nuclei play a central role as sensory and motor relay stations communicating between the sub-cortical regions, cerebellum, and the cortex.1 In chronic traumatic brain injury patients, non-uniform atrophy has been seen throughout the thalamus with the nuclei bordering ventricles being most affected.2 Additionally, many treatments target specific nuclei to treat movement disorders and neuropathic pain, such as MR-guided Focused Ultrasound (MRgFUS) or DBS.3 While conventional MRI typically shows limited contrast between thalamic nuclei, imaging techniques such as white-matter-nulled MPRAGE,4 diffusion tensor imaging (DTI),5 and quantitative susceptibility mapping (QSM),6 have shown great promise for thalamic nuclei mapping. In this study, we propose using synthetic-TI images from the T1w MPRAGE and FGATIR sequences to accurately visualize and delineate thalamic nuclei from the Morel stereotactic atlas.7 We further report multi-parametric tissue properties of thirteen thalamic nuclei from T1 mapping, QSM, and diffusion kurtosis imaging.Methods
Imaging: MRI were acquired on a Siemens 3T PrismaFIT scanner using a 64-channel head and neck coil. 3D MPRAGE images were acquired with two TI’s, 400ms and 1400ms, providing white matter-nulled (FGATIR) and T1-weighted (T1-MPRAGE) contrast respectively, with 1mm3 isotropic resolution, 256mm FOV, flip angle 6⁰, TE/TR 3.37ms/4000ms. QSM images were acquired with a 3D flow-compensated gradient echo sequence with 0.8x0.8x1.2mm3 resolution, 224mm FOV, TR 44ms, eight echoes with TEs = 4.06, 9.06, 14.06, 19.05, 24.05, 29.06, 34.06, 39.06ms, flip angle 20⁰. DKI images were acquired with an SMS EPI sequence with 2mm isotropic resolution, 224mm FOV, TE/TR=78ms/3500ms, 45 directions at b=1000 s/mm2 and 90 directions at b = 2500 s/mm2, along with 6 b0 volumes.Subjects: MRI data was collected on ten orthopedic-injury control subjects (3 females, average age: 41.6±13.6 years, range: 21-59 years) as part of a project involving the study of mild traumatic brain injury from the University of Maryland Medical Center with no history of neurological issues or head injuries.
Data analysis:
Synthetic TI images were produced by co-registering the FGATIR and T1-MPRAGE images. Proton density, S0 and T1 values were estimated on a voxel-by-voxel basis using the standard IR T1 recovery equation: SI(S0,T1) = S0*(1-2*exp(-TI/T1)). After T1 estimation, SynTI images were created with TI’s continuously ranging from 400ms to 1000ms enabling the visualization of various thalamic nuclei.8 QSM data were processed with the Morphology Enabled Dipole Inversion (MEDI) toolbox.9 Resulting susceptibility values were multiplied by 1000 and separated as paramagnetic and diamagnetic source values as in Kumar and colleagues.6 DKI data were processed with an in-house developed Matlab Program.10 All images were first aligned to the axial AC-PC aligned T1w images, which were further warped to the MNI152_1mm standard atlas.
The digitized Morel atlas7 in the 1mm MNI152 atlas space was used as the initial thalamus mask (Fig. 1). Neighboring nuclei similar in function and T1 value were combined into composite nuclei (Fig. 3B). Both the T1 map and the SynTI images were primarily used to correct each nucleus mask manually. Nuclei were delineated individually at the best SynTI image with the Morel Atlas as the starting point, paying close attention to boundaries with ventricles and the internal capsule.
Results
Figure 2 displays two thalamic nuclei for a representative patient in MNI space. The Morel atlas labels the ventricles as part of the anterior nuclei (AN); the SynTI images at 700ms differentiate the edges of the lateral ventricle, allowing for accurate delineation of the AN (Fig. 2A). At TI 720ms, the mediodorsal (MD) appears dark compared to the surrounding central lateral (CL) nucleus (Fig. 2B).Figure 3 shows the average T1 value (ms) for the uncorrected Morel atlas and corrected labels. The average standard deviation (SD) and coefficient of variation (CV) for all nuclei were lower for the corrected labels (SD: 29.34-105.10ms, CV: 3.45-10.51%) compared to the uncorrected Morel atlas (SD: 31.15-242.34ms, CV: 3.66-21.36%). Nuclei boarding the ventricles (AN, LD, MD, PuI, CL) displayed the greatest decrease in CV (uncorrected: 11.82-21.36%, corrected: 6.51-10.51%).
Figure 4 displays the T1 and QSM values for each nucleus. The T1 value for each nucleus is distinct. The ventral nuclei (VA, VLP, VPL, VPM) have lower T1 values and higher diamagnetic source values compared to other nuclei. The thalamus exhibits diamagnetic source values due to the high concentration of parvalbumin, calbindin, and myelinated axons.11 However, the pulvinar (PuI) also has paramagnetic properties, suggesting high iron content.6,12
Figure 5 displays fractional anisotropy (FA), mean diffusivity (ADC), and mean kurtosis (MK) values. The ventral nuclei demonstrated high FA and MK values due to the high density of somatosensory and motor axons.6,13 The AN and lateral dorsal (LD) exhibited high ADC values because of their close proximity to ventricles.
Discussion
Our results suggest that synthetic MPRAGE images can be helpful in delineating thalamic nuclei as outlined in the stereotactic Morel atlas. Distinct tissue properties reflected with T1 and DKI values were revealed in each nucleus, allowing for the development of automatic feature-based thalamic nuclei segmentation. Active recruitment is ongoing for more volunteer data to confirm validly. This method could assist not only in automatic identification for targeting during neuro-interventions but also in accurately depicting thalamic pathophysiology in various neurological disorders.Acknowledgements
The study was conducted at University of Maryland School of Medicine Center for Advanced Imaging Research (CAIR) – Baltimore, Maryland. The study is supported by NIH under grant 5R01NS105503. We thank Dr. Morel for providing the thalamus atlas.References
[1] Iglesias J, Insausti R, Lerma-Usabiaga G, et al. A probabilistic atlas of the human thalamic nuclei combining ex vivo MRI and histology. Neuroimage. 2018 Dec;183:314-326.
[2] Sandry J, Dobryakova E. Global hippocampal and selective thalamic nuclei atrophy differentiate chronic TBI from non-TBI. Cortex. 2021 Dec;145:37-56.
[3] Lehman VT, Lee KH, Klassen BT, Blezek DJ, Goyal A, Shah BR, Gorny KR, Huston J, Kaufmann TJ. MRI and tractography techniques to localize the ventral intermediate nucleus and dentatorubrothalamic tract for deep brain stimulation and MR-guided focused ultrasound: a narrative review and update. Neurosurg Focus. 2020 Jul;49(1):E8.
[4] Sudhyadhom A, Hag IU, Foote KD, Okun MS, Bova FJ. A high resolution and high contrast MRI for differentiation of subcortical structures for DBS targeting: the Fast Gray Matter Acquisition T1 Inversion Recovery (FGATIR). Neuroimage. 2009 Aug;47 Suppl 2:T44-52.
[5] Lambert C, Simon H, Colman J, Barrick TR. Defining thalamic nuclei and topographic connectivity gradients in vivo. Neuroimage. 2017 Sep;158:466-479.
[6] Kumar VJ, Scheffler K, Hagberg GE, Grodd W. Quantitative Susceptibility Mapping of the Basal Ganglia and Thalamus at 9.4 Tesla. Front Neuroanat. 2021 Sep 16;15:725731.
[7] Morel A, Magnin M, Jeanmonod D. Multiarchitectonic and Stereotactic Atlas of the Human Thalamus. J. Comp. Neurol. 387:588–630, 1997
[8] Zhuo J, Roys S, Hebel J, Owens E, Raghavan P, Gandhi D, Gullapalli RP. Visualization of the VIM Thalamic Nucleus using Synthesized MPRAGE Images. Proc. of the 25th Annual Meeting of ISMRM. Honolulu, HI, 2017. pp. 5426
[9] Liu T, Xu W, Spincemaille P, Avestimehr A, Wang Y. Accuracy of the morphology enabled dipole inversion (MEDI) algorithm for quantitative susceptibility mapping in MRI. IEEE transactions on medical imaging. 2012;31(3):816–824.
[10] Zhuo J, Xu S, Proctor JL, Mullins RJ, Simon JZ, Fiskum G, Gullapalli RP. Diffusion kurtosis as an in vivo imaging marker for reactive astrogliosis in traumatic brain injury. Neuroimage. 2012 Jan 2;59(1):467-77.
[11] Jones EG. Viewpoint: the core and matrix of thalamic organization. Neuroscience. 1998 Jul;85(2):331-45.
[12] Li X, Chen L, Kutten K, Ceritoglu C, Li Y, Kang N, Hsu JT, Qiao Y, Wei H, Liu C, Miller MI, Mori S, Yousem DM, van Zijl PCM, Faria AV. Multi-atlas tool for automated segmentation of brain gray matter nuclei and quantification of their magnetic susceptibility. Neuroimage. 2019 May 1;191:337-349.
[13] Sheridan N, Tadi P. Neuroanatomy, Thalamic Nuclei. [Updated 2022 Jul 25]. In: StatPearls [Internet]. Treasure Island (FL): StatPearls Publishing; 2022 Jan-. Available from: https://www.ncbi.nlm.nih.gov/books/NBK549908/
Figures
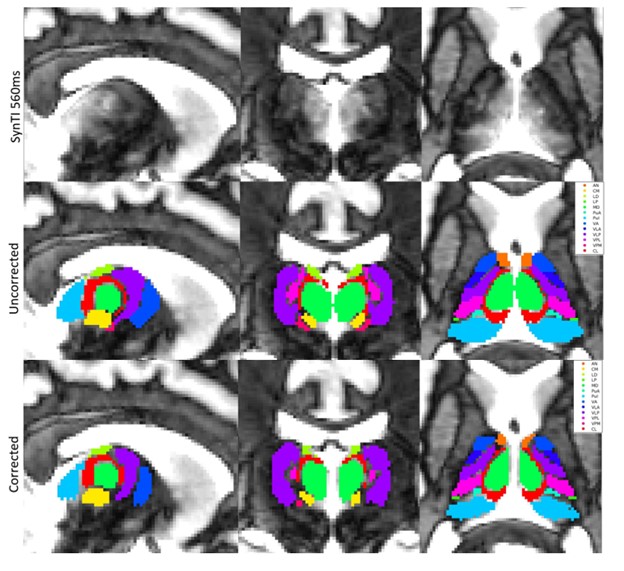
Figure 1. Uncorrected Morel atlas (2nd row) and corrected nuclei (3rd row) in subject MRCON2028 at TI 560ms (1st row). The SynTI 560ms images are helpful in determining thalamic boundaries with the internal capsule in the axial orientation.

Figure 2. Uncorrected Morel atlas (2nd row) and corrected mask (3rd row) of two thalamic nuclei in MRCON2028. The anterior nuclei (AN) are best visualized at TI 700ms (A, 1st row). The mediodorsal nucleus (MD) is best visualized at TI 720ms (B, 1st row).
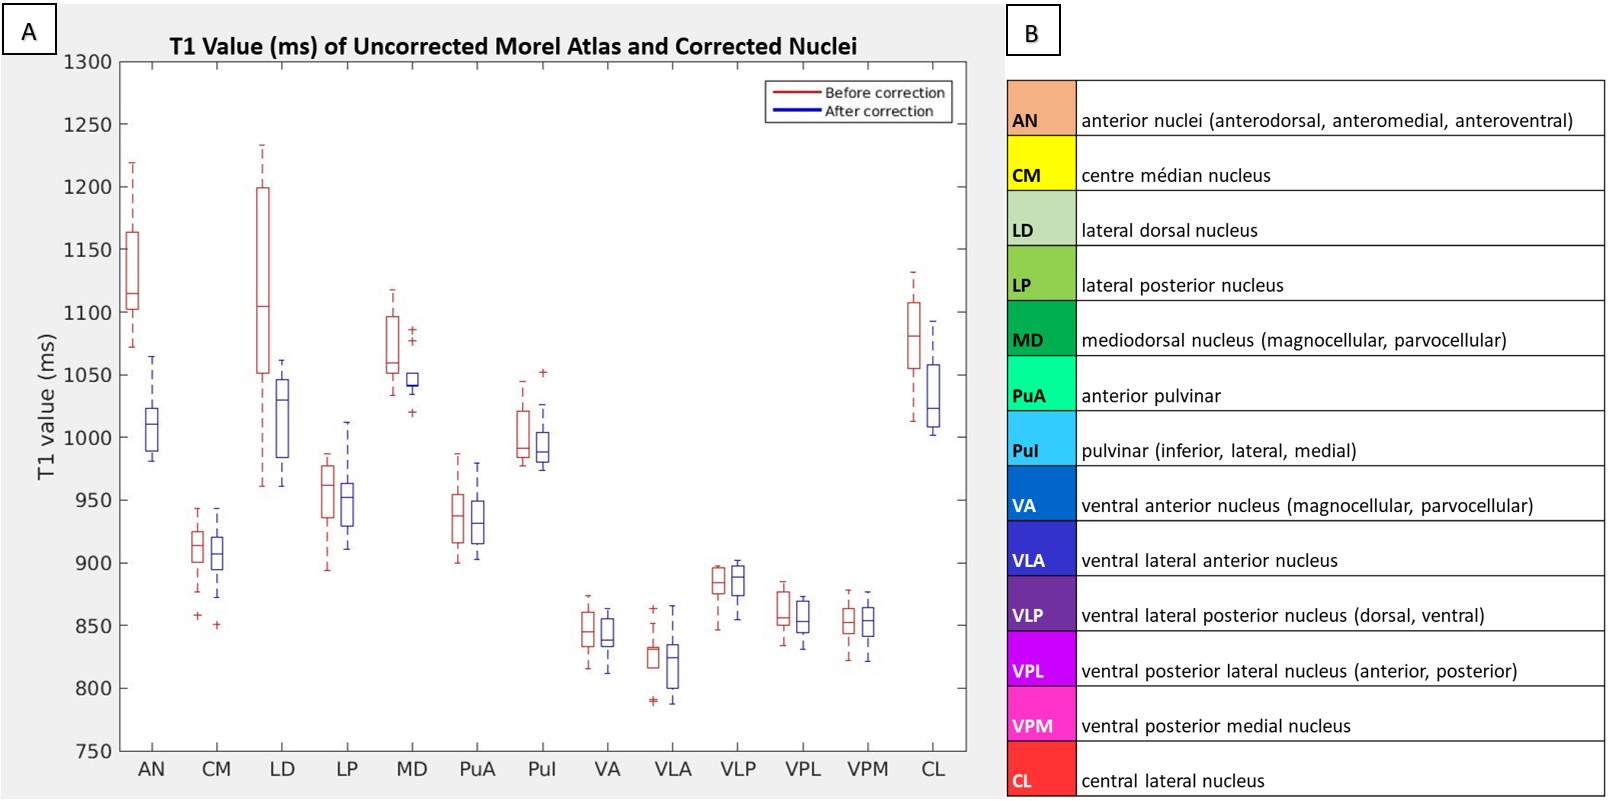
Figure 3. T1 values (ms) of uncorrected Morel atlas (red) and corrected nuclei masks (blue) (A). The color and abbreviation of each nucleus, including the individual nuclei forming composite nuclei (B).
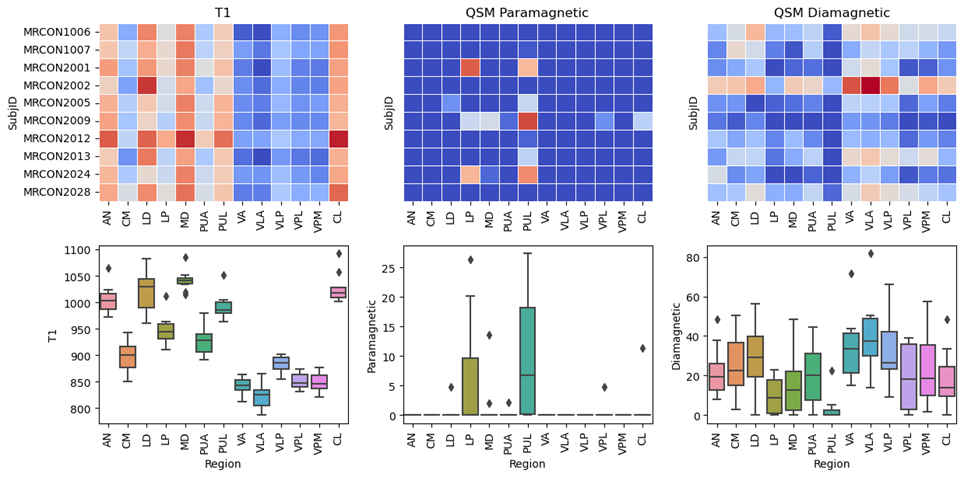
Figure 4. T1 values (ms), paramagnetic source values (e.g., iron) and diamagnetic source values (e.g., myelin, calcium) in each thalamic nuclei, shown both for each subject (1st row), and grouped as boxplots (2nd row). Paramagnetic source values were taken as the positive susceptibility values x 1000 (ppb). Diamagnetic source values were taken as the absolute value of the negative susceptibility values x 1000 (ppb).
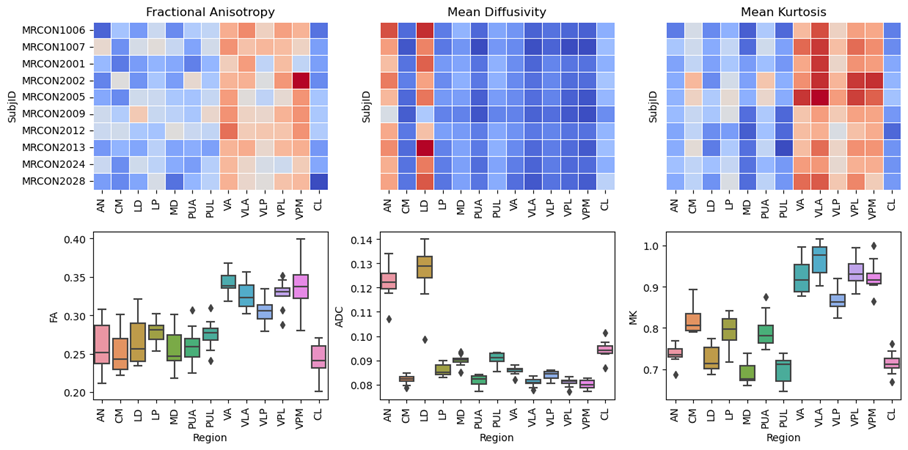
Figure 5. Fractional Anisotropy (FA), Mean Diffusivity (MD, x 10-9 mm2/s) and Mean Kurtosis (MK) values in each thalamic nuclei, shown both for each subject (1st row), and grouped as boxplots (2nd row).