1699
High-Resolution Heart-Saturated TOF (HRHS-TOF): A novel MRI protocol for atherosclerotic plaque imaging on mice in vivo1Center for Biomedical Imaging Research, Tsinghua University, Beijing, China, 2Inno Medicine, Beijing, China
Synopsis
Keywords: Atherosclerosis, Atherosclerosis
Time of flight (TOF) is the most commonly used bright blood MRI method for imaging the human vascular system. However, there were several challenges when TOF was used for imaging AS plaque in mice. This study proposed a novel MRI protocol, High-Resolution Heart-Saturated TOF (HRHS-TOF), imaging only AS plaque without background information. Moreover, this protocol could perform without measurement of the T1 value of blood in advance. ApoE−/− mice were scanned to investigate the feasibility and data interpretation of HRHS-TOF protocol.Introduction
Atherosclerosis (AS) is a severe health problem involved in most deaths worldwide1,2. As a non-invasive and non-ionizing radiated imaging technique, MRI is commonly used in clinical AS studies for screening and longitudinal monitoring of AS plaque in vivo. However, experimental ethics and conditions such as drug safety and scan duration limit patient imaging studies. In this case, animal models are considered practical tools for AS studies, and apolipoprotein E-deficient (ApoE−/−) mice are the most frequently used animal model3. Therefore, MRI methods for AS studies on mice are in great demand.Time of flight (TOF) is the most commonly used bright blood MRI method for imaging the human vascular system4. However, there were several challenges when TOF was used for imaging AS plaque in mice. Firstly, the MR signal of AS plaque closely attached to the inner vessel wall is overwhelmed by the dominant MR signal of blood in the original TOF images. Secondly, the inversion time for the standard black blood methods is prolonged on animal MRI scanners with much higher magnetic strength because of the higher T1 value of blood, resulting in a longer scan duration. Additionally, the T1 value of blood may become more complex after the contrast agent or drug injection.
This study proposed a novel MRI protocol, High-Resolution Heart-Saturated TOF (HRHS-TOF), imaging only AS plaque without background information. Moreover, this protocol could perform without measurement of the T1 value of blood in advance. ApoE−/− mice were scanned to investigate the feasibility and data interpretation of HRHS-TOF protocol.
Methods
Mice preparationAll the animal experiments were approved by the ethics committee of the Laboratory Animal Resources Center, Tsinghua University (Animal Protocol Number: SXL21-2). ApoE−/− mice (n = 2, male, 45 weeks) were fed high-fat diets. The mice were first induced anesthetized with 3% isoflurane and 3 L/min oxygen and maintained with 1%-2% isoflurane and 1 L/min oxygen. Then the mice were immobilized in a prone position on the animal bed with a warming pad.
MRI acquisition
In vivo MRI scans were performed on a 9.4 T horizontal MRI scanner (BioSpec 94/30, Bruker, Germany). A volume coil with an inner diameter of 86 mm was used for MR signal transmitting, and a 4-channel surface array coil was used for MR signal receiving. The receiver coil was placed closely on the back of the mice for higher SNR. A respiration monitoring pad was placed under the mice. All the sequences were scanned with respiratory-triggered gates.
HRHS-TOF images were acquired using 2D FLASH sequence: TR = 14.81 ms, TE = 2.97 ms, Flip Angle = 80°, Averages = 5, FOV = 16.5 × 8.25 mm2, Matrix = 300 × 150, slice thickness = 0.5 mm, number of slices = 41, scan duration = 5 min 40 s. The locating method is shown in Figure 1A, and the specific procedure is as follows: 1. ROI was located on the top of the mouse back (the blue boxes in Figure 1B-D); 2. the heart-saturated spatial saturation band is placed perpendicular to the mouse body, covering the whole heart of the mouse (green boxes in Figure 1C-D); 3. the anti-fold spatial saturation band is placed parallel to the mice body, preventing images from the phase wrap-around artifacts (yellow boxes in Figure 1B-C).
High-resolution TOF (HR-TOF) images were acquired to investigate the feasibility of HRHS-TOF protocol using a 2D FLASH sequence without spatial saturation bands. HR-TOF has the same parameters as HRHS-TOF except for FOV = 16.5 × 16.5 mm2, Matrix = 300 × 300, and scan duration = 11 min 20 s.
High-resolution T1-weighted (HR-T1w) images were acquired to investigate the data interpretation of HRHS-TOF protocol using a 2D FLASH sequence with fat suppression: TR = 172.92 ms, TE = 3.15 ms, Flip Angle = 30°, Averages = 8, FOV = 16.5 × 8.25 mm2, Matrix = 300 × 150, slice thickness = 0.5 mm, number of slices = 11, scan duration = 3 min 46 s.
Results
Feasibility of HRHS-TOF protocolThree slices of HRHS-TOF and HR-TOF images of the same mouse in the same offsets are shown in Figure 2. Blood was the brightest in HR-TOF images (red arrows in Figure 2D-F) but eliminated in HRHS-TOF images (red arrows in Figure 2A-C). T1-weighted images of the remained tissue were generated in HRHS-TOF images due to short TE and short TR.
Data interpretation of HRHS-TOF protocol
Three slices of HRHS-TOF and HR-T1w images of the same mouse in the same offsets are shown in Figure 3. Hyperintense signals in HR-T1w images (red arrows in Figure 3D-F) indicated the positions of AS plaque. Interestingly, hyperintense signals were found in the same place in HRHS-TOF images (red arrows in Figure 3A-C), suggesting HRHS-TOF images could provide information on AS plaque. By adjusting the threshold of HRHS-TOF images and overlaying HRHS-TOF images to HR-T1w images, AS plaque images with anatomical information were generated (Figure 3G-I) using self-developed software shown in Figure 4.
Conclusion
This study proposed HRHS-TOF protocol to image AS plaque without background information and demonstrated the feasibility and data interpretation. This novel protocol is promising in screening and longitudinal monitoring AS plaque in ApoE−/− mice studies.Acknowledgements
This work was supported by the National Natural Science Foundation of China [grant numbers 82071914].References
1 Libby, P. The changing landscape of atherosclerosis. Nature 592, 524-533, doi:10.1038/s41586-021-03392-8 (2021).
2 Zhao, D., Liu, J., Wang, M., Zhang, X. & Zhou, M. Epidemiology of cardiovascular disease in China: current features and implications. Nat Rev Cardiol 16, 203-212, doi:10.1038/s41569-018-0119-4 (2019).
3 Ilyas, I. et al. Mouse models of atherosclerosis in translational research. Trends Pharmacol Sci 43, 920-939, doi:10.1016/j.tips.2022.06.009 (2022).
4 Chen, C. Y., Li, C. W., Mak, H. K. F., Lin, M. F. & Chan, W. P. Combined native magnetic resonance angiography, flow-quantifying, and perfusion-imaging for impending second-stroke assessment. Quant Imaging Med Surg 9, 521-529, doi:10.21037/qims.2019.03.10 (2019).
Figures
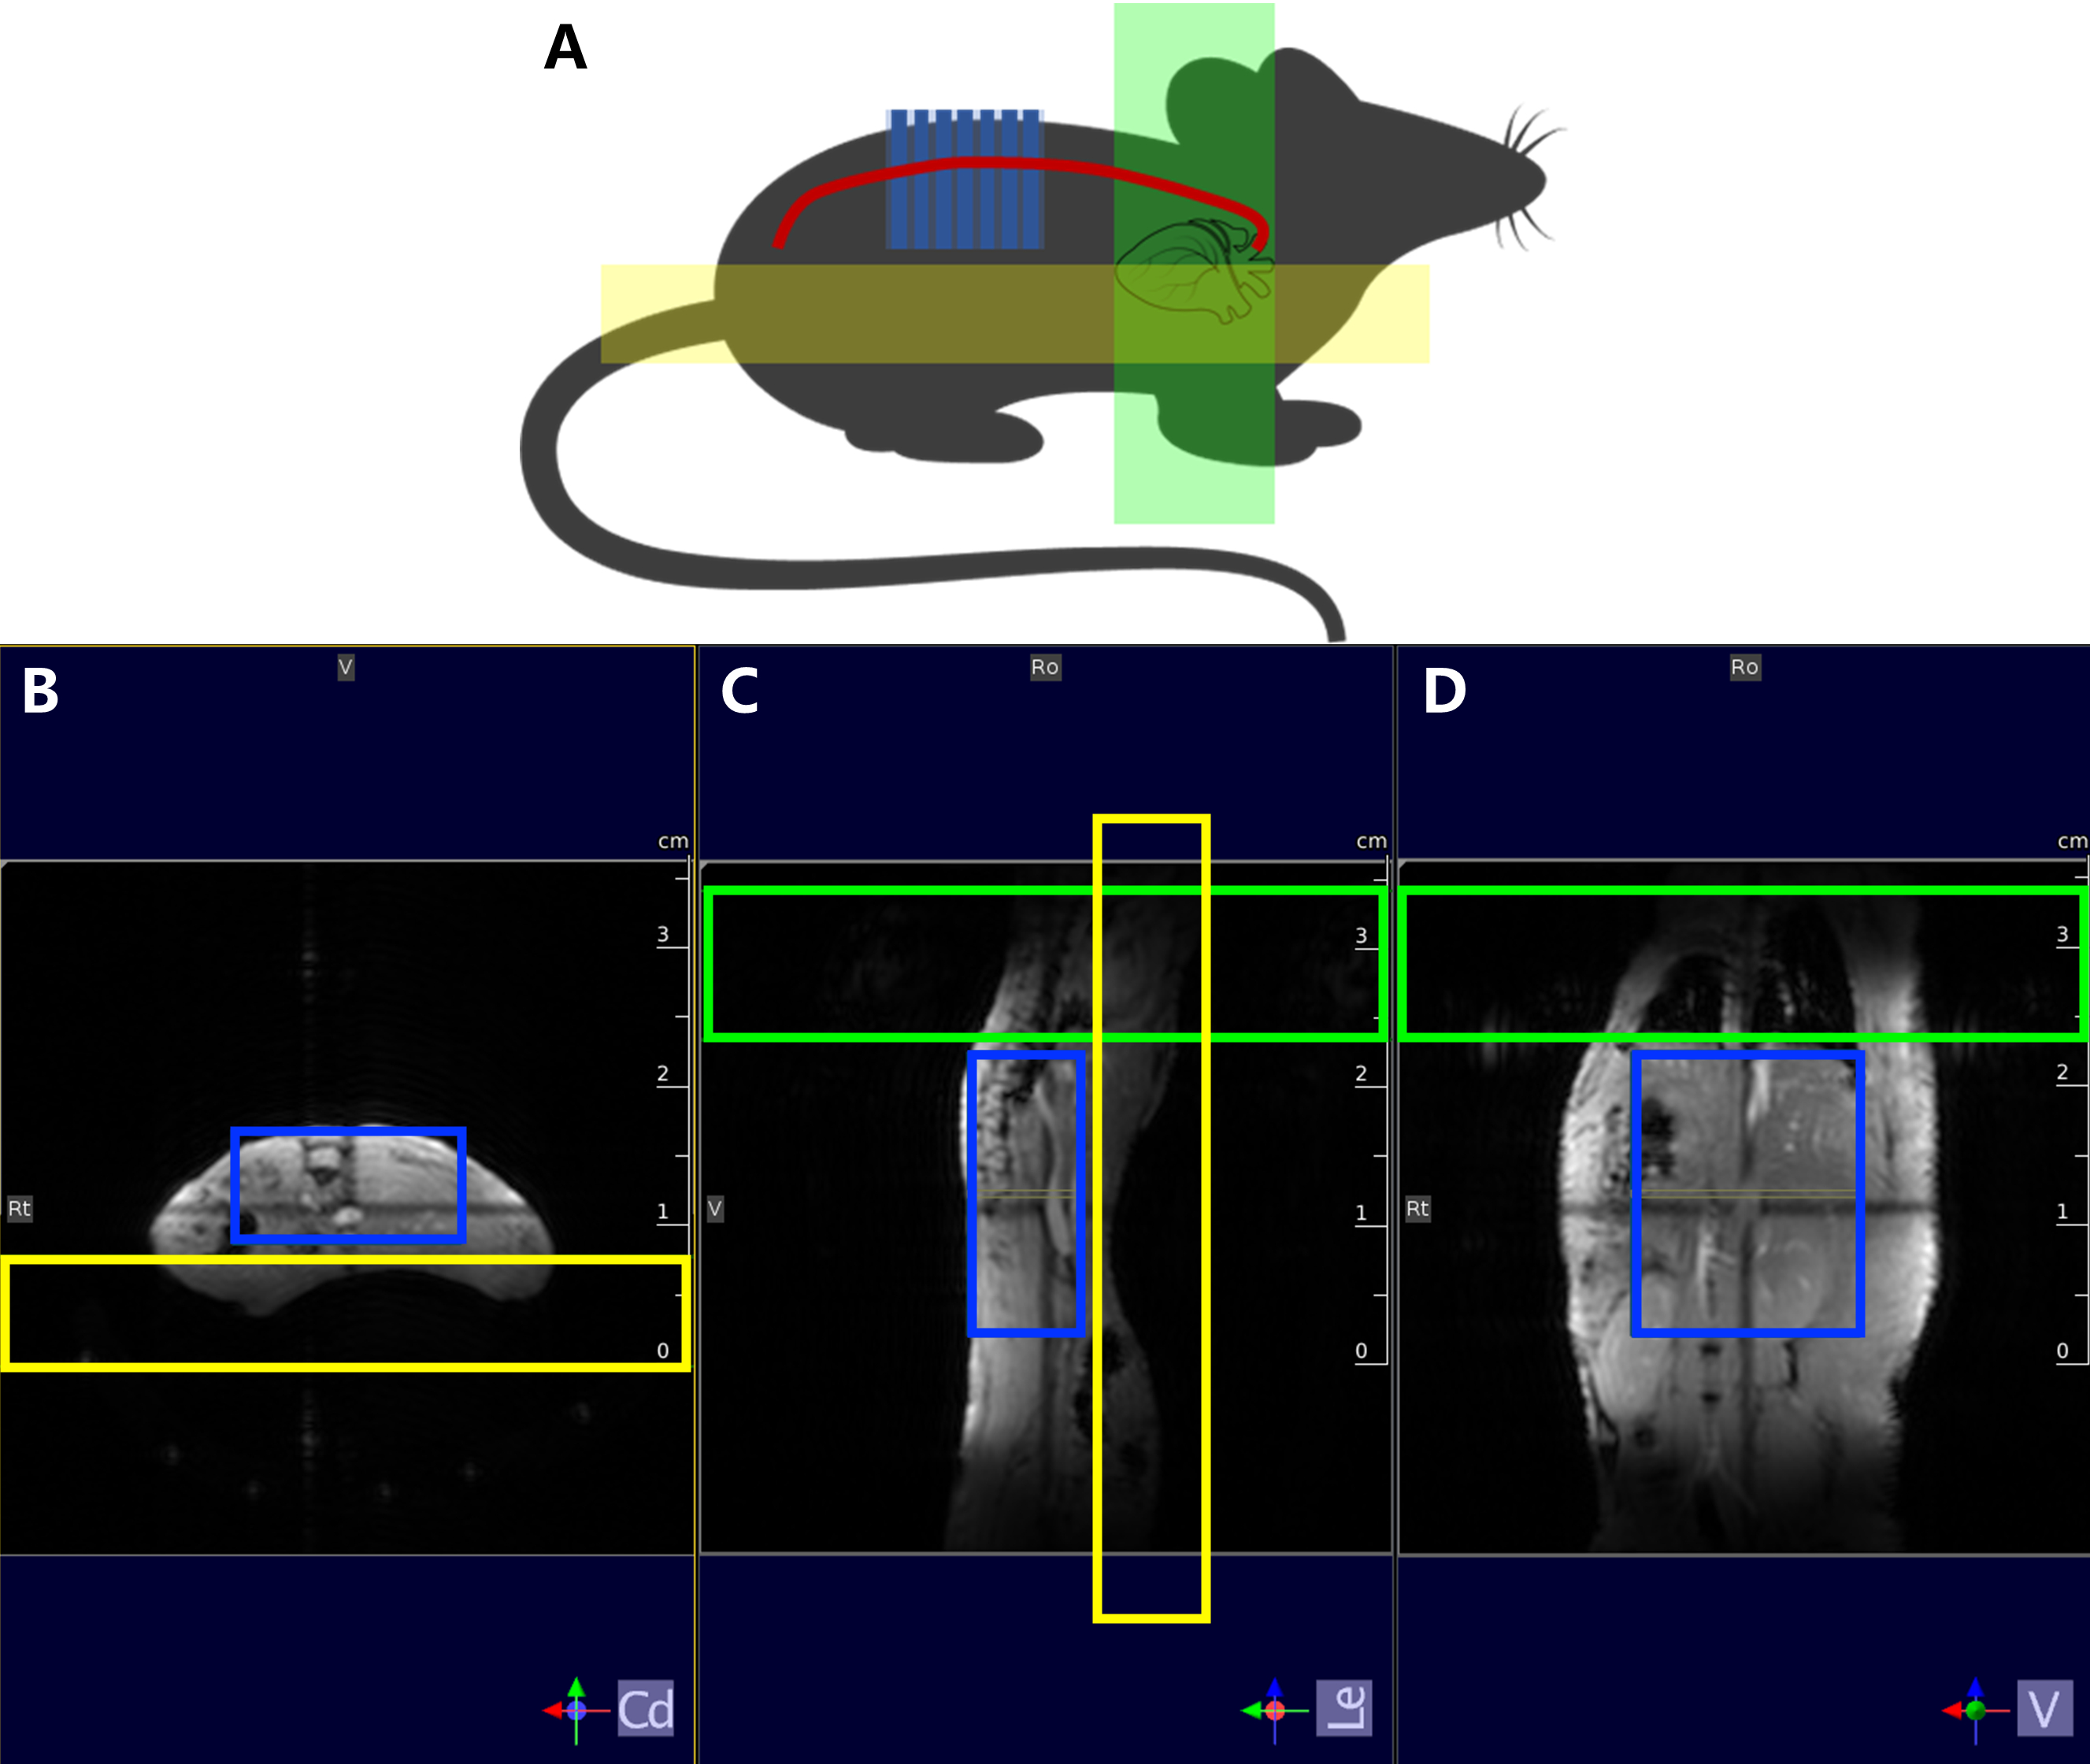
Figure 1. Locating method of HRHS-TOF protocol. (A) Sketch map of locating method. The artery vessel of the mouse is in the red line; the heart-saturated spatial saturation band is in the green rectangle; the anti-fold spatial saturation band is in the yellow rectangle. (B) Axial plane of the localizer. (C) Saggital plane of the localizer. (D) Coronal plane of the localizer. ROI is in the blue boxes; the heart-saturated spatial saturation band is in the green boxes; the anti-fold spatial saturation band is in the yellow boxes.
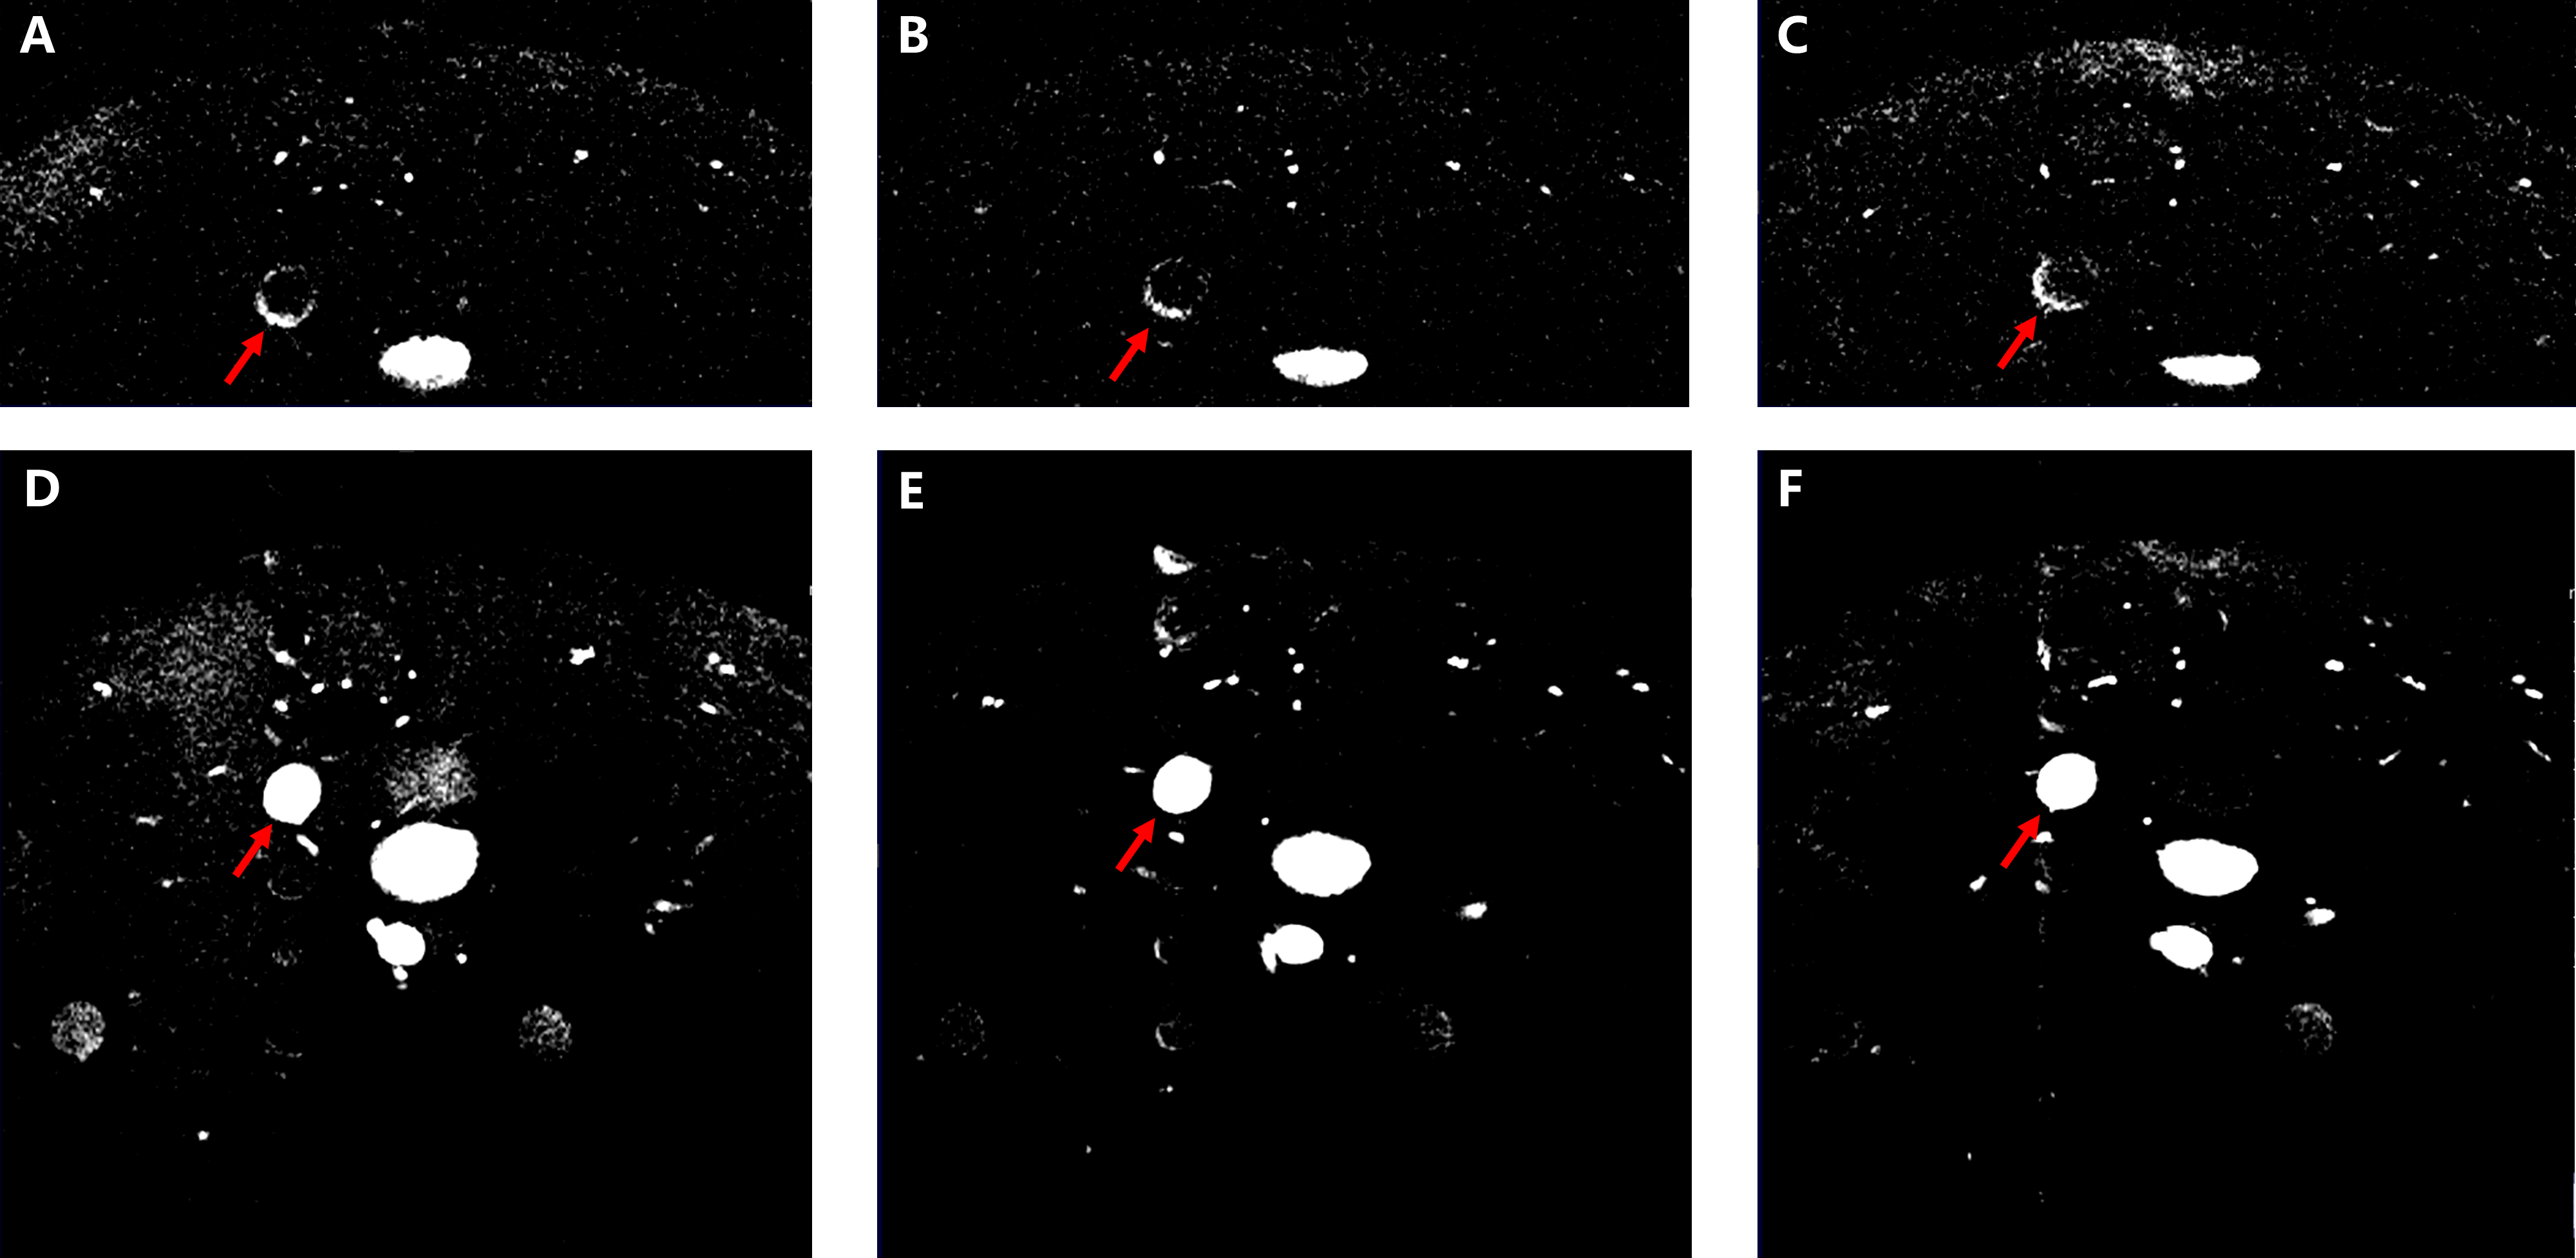
Figure 2. HRHS-TOF and HR-TOF images of the same mouse in the same offsets. (A)-(C) HRHS-TOF images after adjusting the threshold. MR signal of the blood was eliminated, and T1-weighted images of the remained tissue were generated. (D)-(F) HR-TOF images after adjusting the threshold. Blood was the brightest, so the information of AS plaque was hidden.
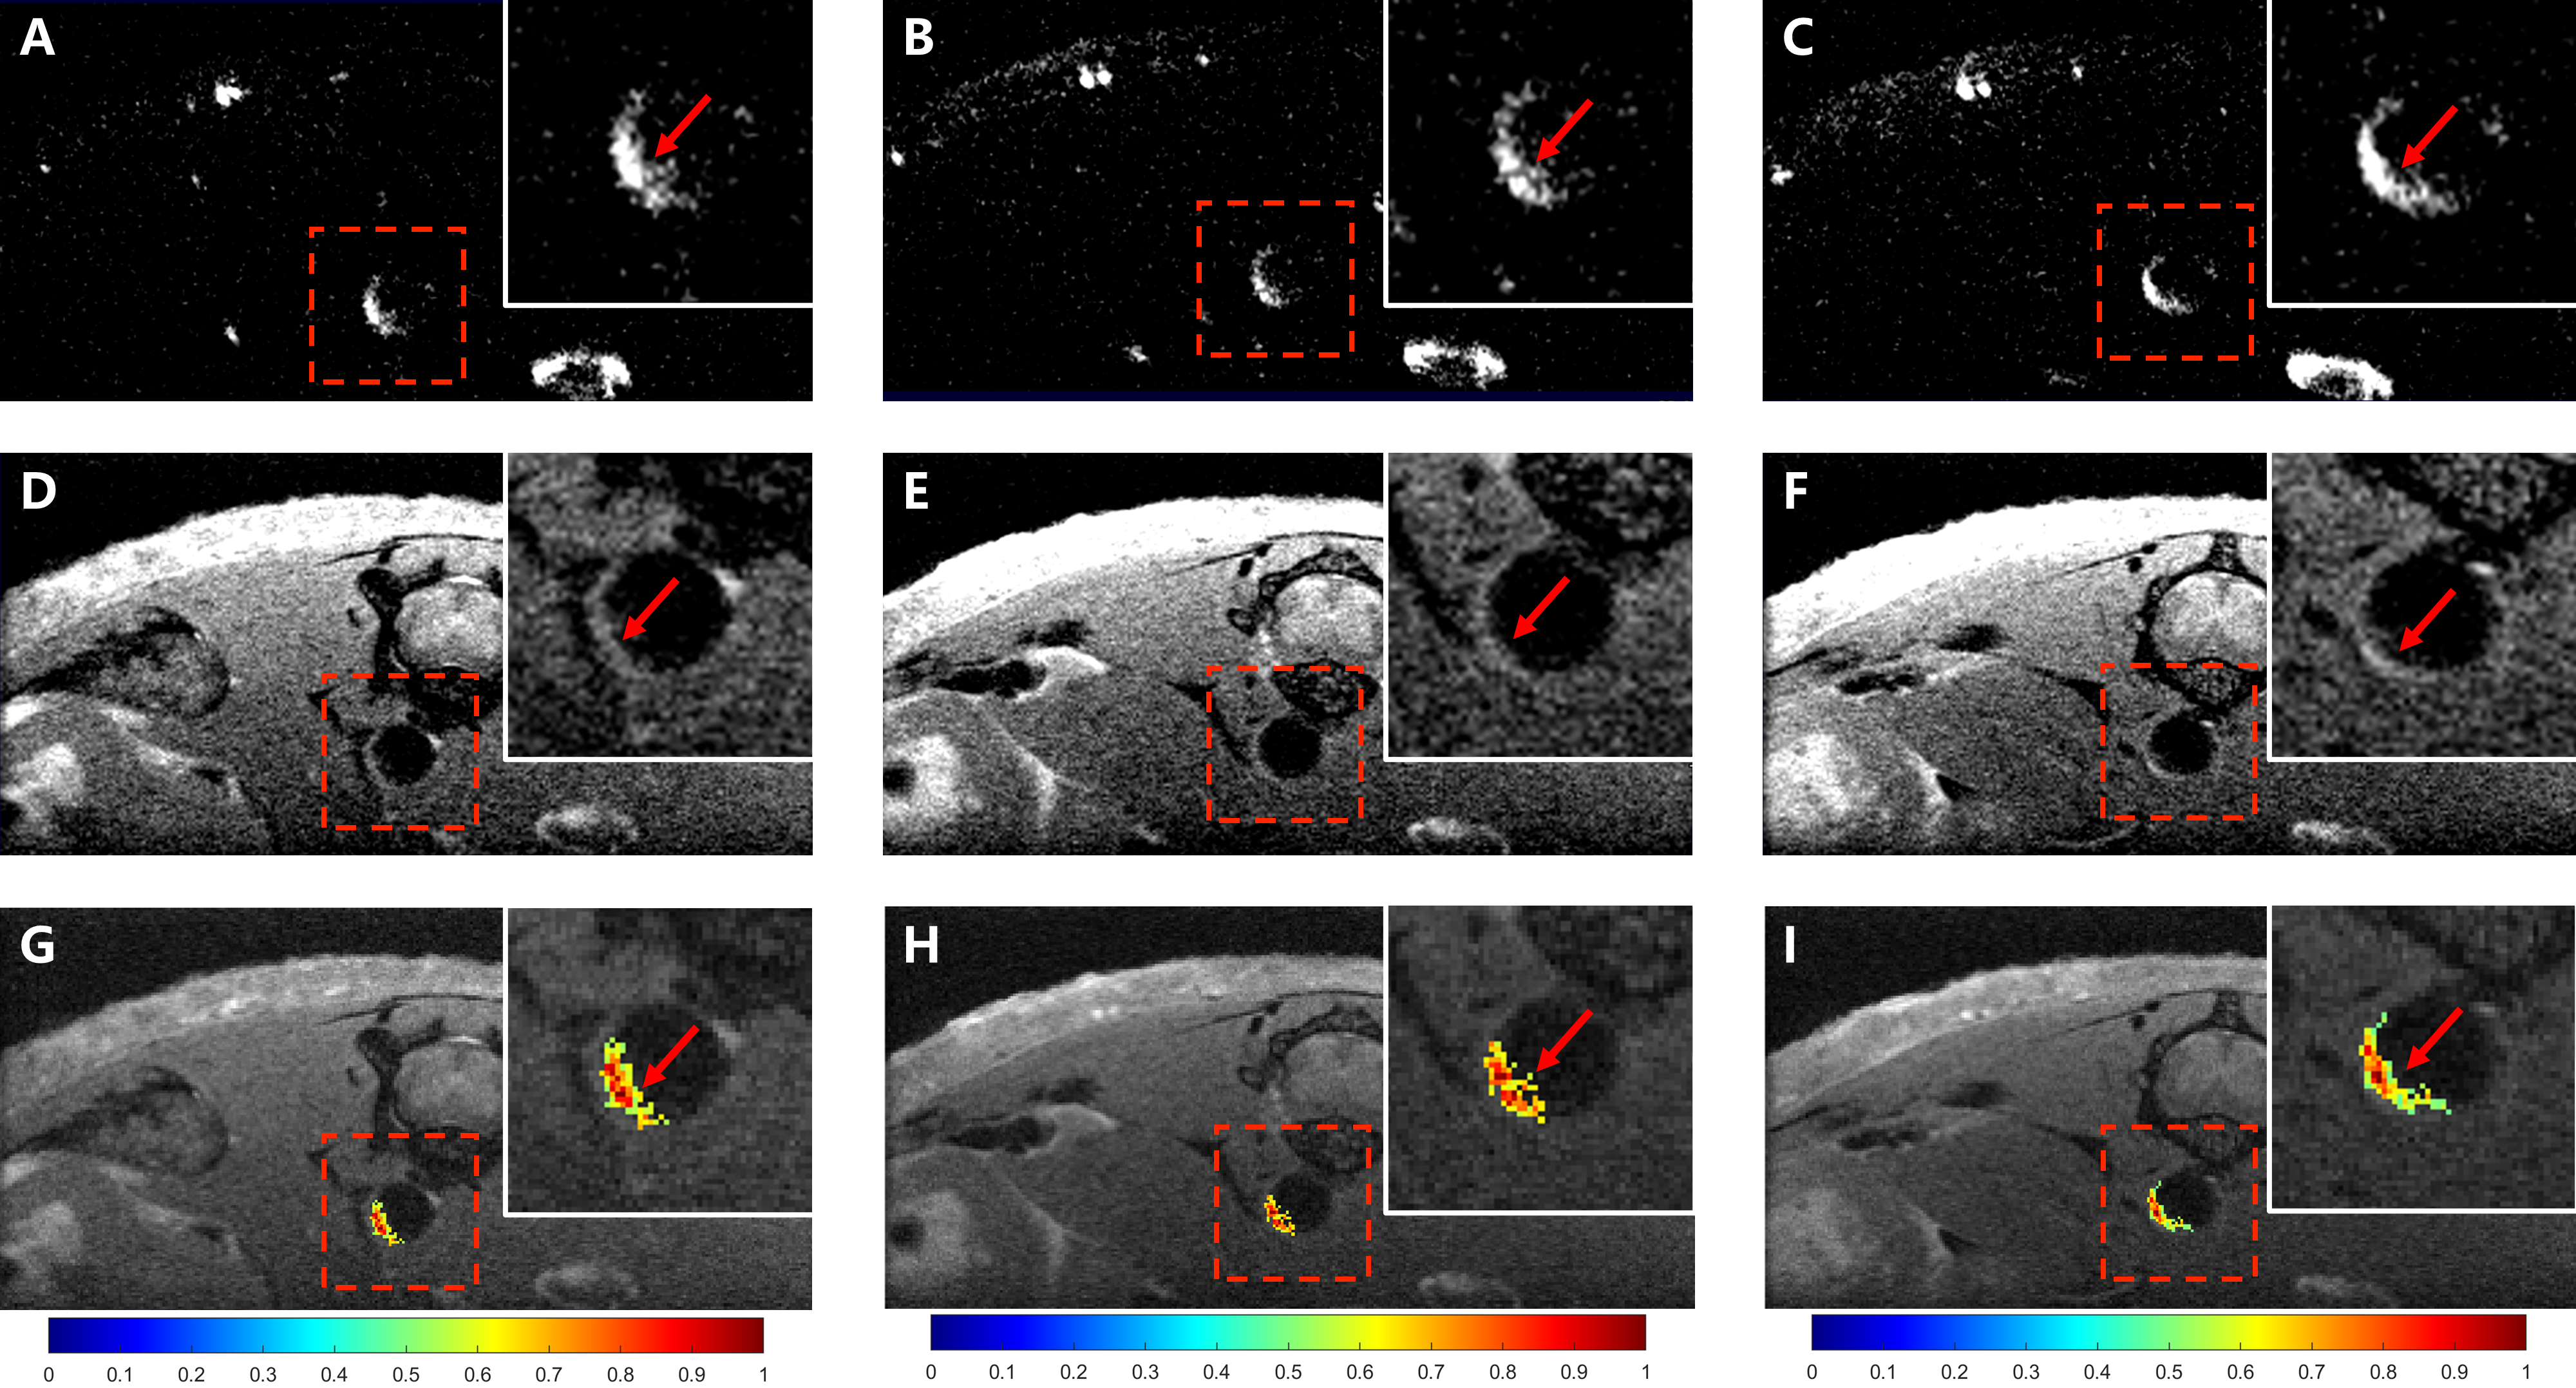
Figure 3. HRHS-TOF, HR-T1w, and AS plaque images of the same mouse in the same offsets. (A)-(C) HRHS-TOF images after adjusting the threshold. Hyperintense signals were found in the same place as HR-T1w images (red arrows). (D)-(F) HR-T1w images after adjusting the threshold. Hyperintense signals (red arrows) indicated the positions of AS plaque. (G)-(I) AS plaque images with anatomical information (red arrows) generated using self-developed software.
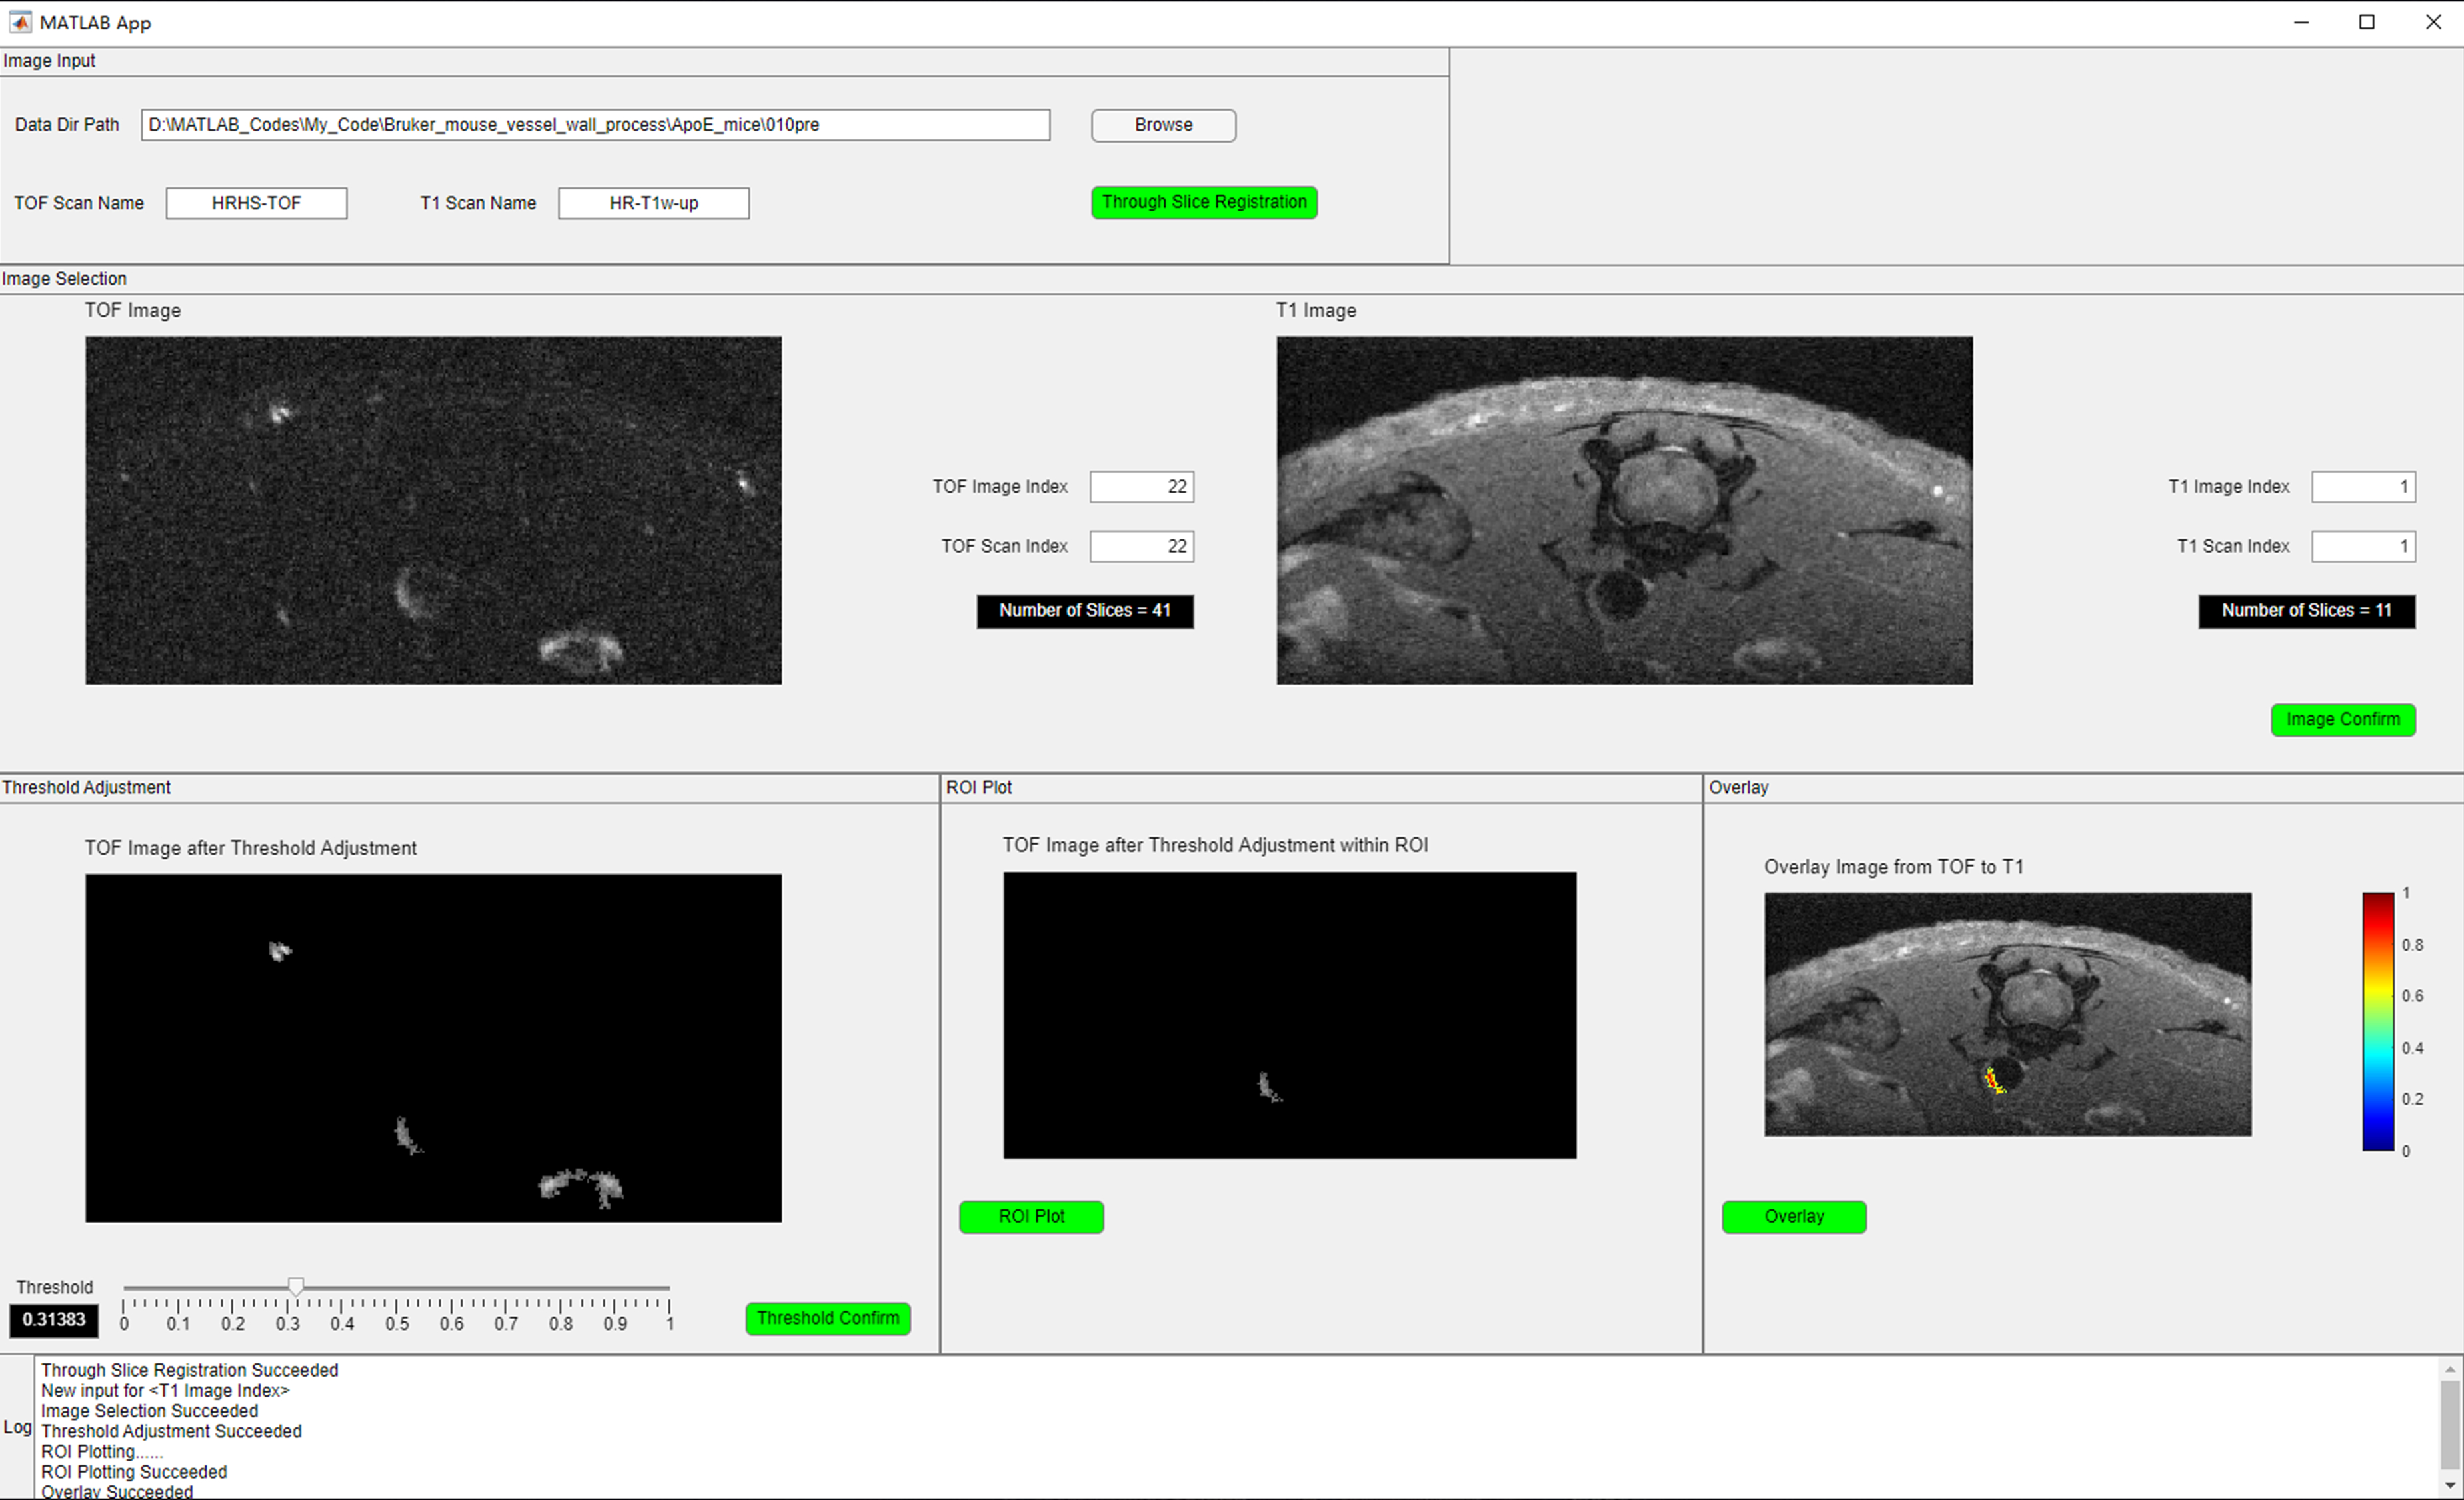
Figure 4. The interface of self-developed AS plaque image processing software. The specific procedures are as follows: 1. Image Input; 2. Image Selection; 3. Threshold adjustment; 4. ROI plot; 5. Overlay.