1683
Comparison of fitting methods for Non-Gaussian diffusion and IVIM MRI parameter estimation in two mice xenograft models1Department of Diagnostic Imaging and Nuclear Medicine, Kyoto University Graduate School of Medi, Kyoto, Japan, 2Diagnostic Radiology, Kobe City Medical Center General Hospital, Kobe, Japan, 3Kyoto University Faculty of Medicine, Kyoto, Japan, 4Department of Systems science, Graduate School of Informatics, Kyoto University Graduate School of Medi, Kyoto, Japan, 5CEA-Saclay Center, Paris-Saclay, NeuroSpin, Gif-sur-Yvette, France, 6Human Brain Research Center, Kyoto University Graduate School of Medicine, Kyoto, Japan
Synopsis
Keywords: Cancer, Diffusion/other diffusion imaging techniques
The optimal fitting method (1-step or 2-step) and b-value threshold (200 or 600 s/mm2) in analyzing IVIM/diffusion data was investigated using two different mice xenograft models (breast and colon cancer). The threshold of b=600 rather than 200s/mm2 was found better in these models, as many cases showed non negligible residual IVIM components left with b=200s/mm2. From simulations, it appears that a too low b value threshold leads to an overestimation of ADC0 and underestimation of K and fIVIM .Those results suggest that the b-value threshold must be checked depending on the tissue types.Introduction
Non-Gaussian diffusion and IVIM MRI may provide important information about tissue microstructure and blood microcirculation non-invasively. A commonly used 2-step strategy consists in first processing assumed “pure diffusion” signals acquired above a given b-value threshold using a diffusion model, such as Kurtosis model1. The “diffusion” component of the signals is then removed from the raw signals, leaving residual signals which are then fitted with an IVIM model. It is clear that errors in both diffusion and IVIM parameter estimates are expected if the hypothesis that the IVIM component is negligible at the threshold b values is not met. Yet, a one-size-fits-all typical threshold value of b=200s/mm² is often used, although the validity of this leading hypothesis is rarely checked. Thus, we have processed data obtained in 2 mice xenograft models using the 1-step and 2-steps models with 2 different b-value thresholds, and compared the results with those obtained from simulations.Methods
Eight and ten BALB/c mice were injected subcutaneously with 1×10⁶ breast cancer (4T1) cells and colon cancer (CT-26) cells, respectively, in both hind limbs. MRI data were acquired on a 7T MRI scanner (Bruker, Germany) using a 1H quadrature transmit/receive volume coil. DWI acquisition parameters were as follows; resolution,250x250μm², FOV,25x25 mm², slice thickness,1.5mm, TE=57ms, TR=2500ms, 8averages. IVIM/Diffusion images were acquired using 2 different diffusion times (9 and 27.6ms) and 19 b values (7-4105s/mm²). Data were processed according to the IVIM/Kurtosis model2,3 after correction for Noise floor effects4;S(b)/S0= fIVIM exp (-b D*) + (1- fIVIM) exp [-bADC0 +(bADC0)²K/6] [1]
where fIVIM is the flowing blood fraction, D* the pseudo-diffusion coefficient, ADC0 is the ADC value extrapolated when b is close to 0 (pure Gaussian diffusion) and K is the Kurtosis. ROIs were drawn on tumors in both hind limbs and for the short and long diffusion times. ROI averaged signals were processed using a 1-step fitting with Eq.[1] to estimate all parameters at once, and a 2-step fitting using the diffusion part of Eq.[1] with 2 b-value thresholds (b=200 and 600s/mm²) to estimate ADC0 and K, first, and then fIVIM and D*. Simulations were also conducted using b=200, 400, 600, 800 and 1000s/mm² as IVIM thresholds without and with noise (2%), taking for ADC0 and K ground true values those typically found in our mice data. MRI data analysis and all numerical simulations were implemented in a code developed in Matlab (Mathworks, Natick, MA). The quality of the fitting in the in vivo data was evaluated qualitatively (IVIM component of the signal) and quantitatively using the Akaike Information Criterion to take into account differences in the number of signals below and above the threshold b value. The validity of the IVIM b threshold hypothesis (assuming that the IVIM component at the b-value threshold, Sivim, is less than 1% of the overall signal, Stotal) was compared between the 2-step_b200 group and 2-step_b600 group by Fisher's exact test.
Results
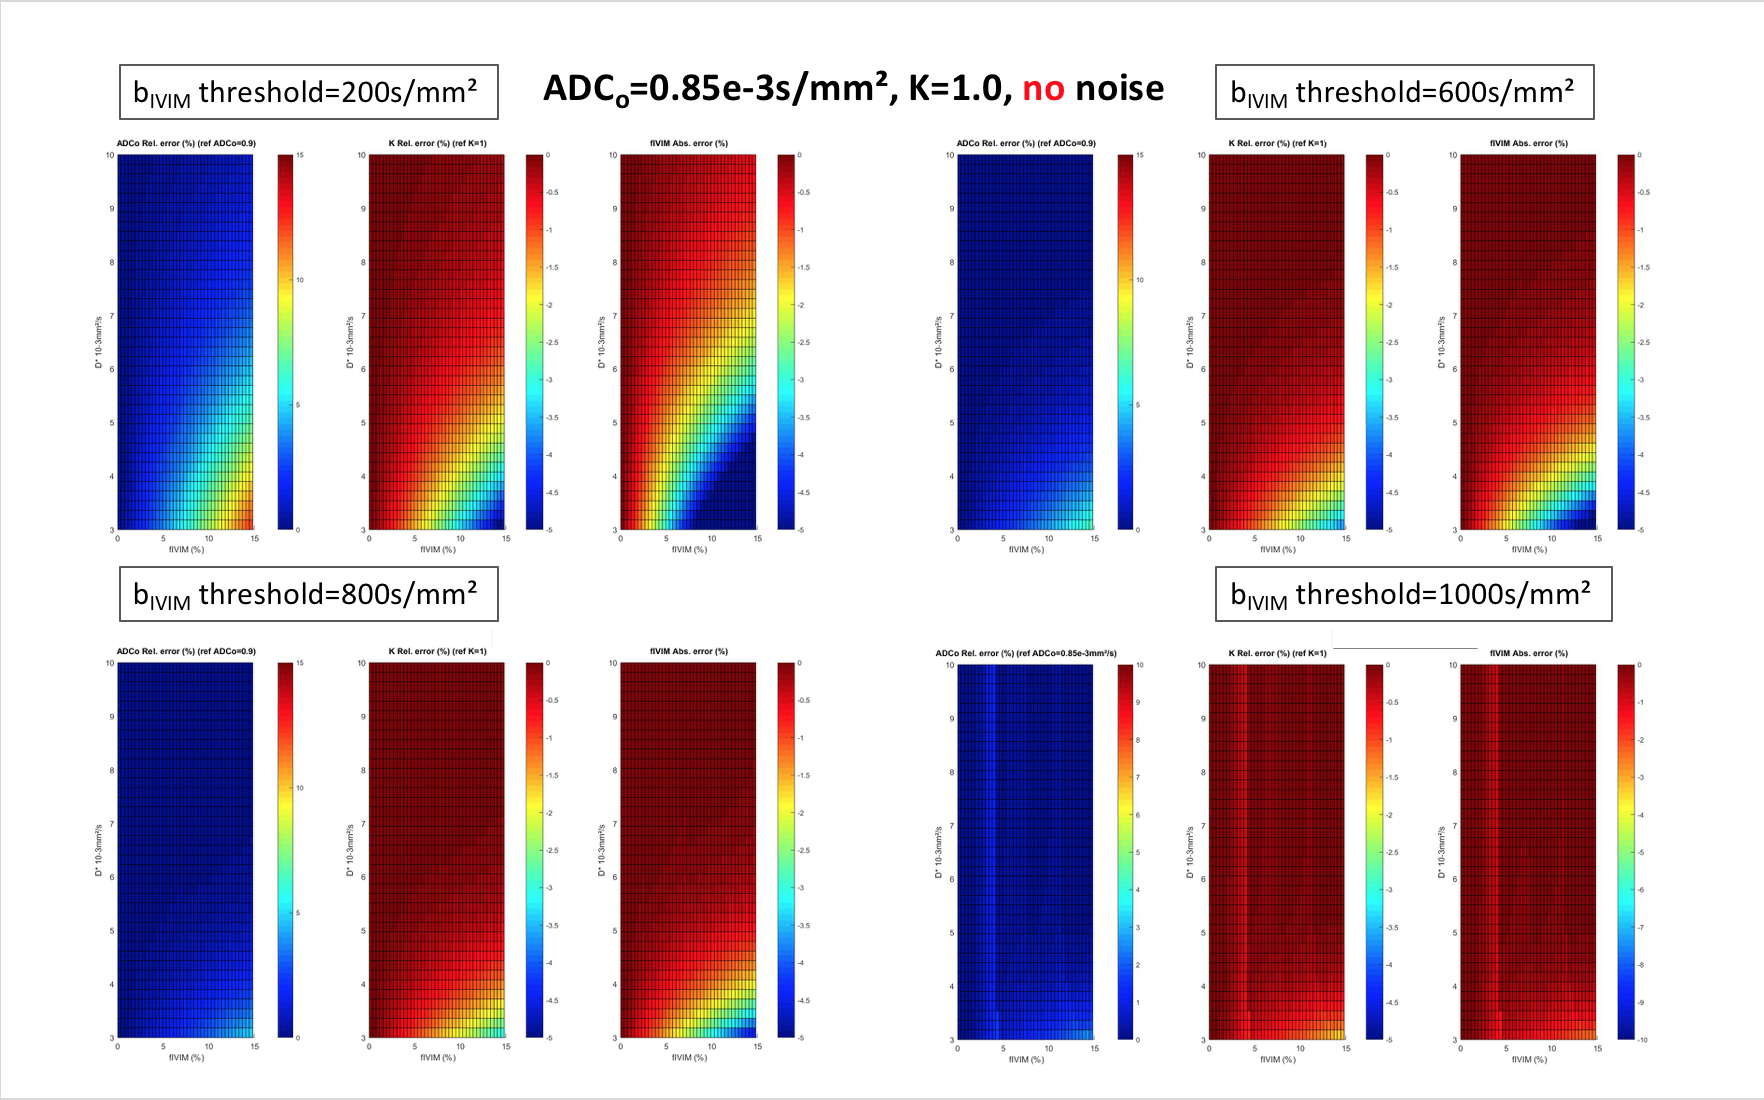
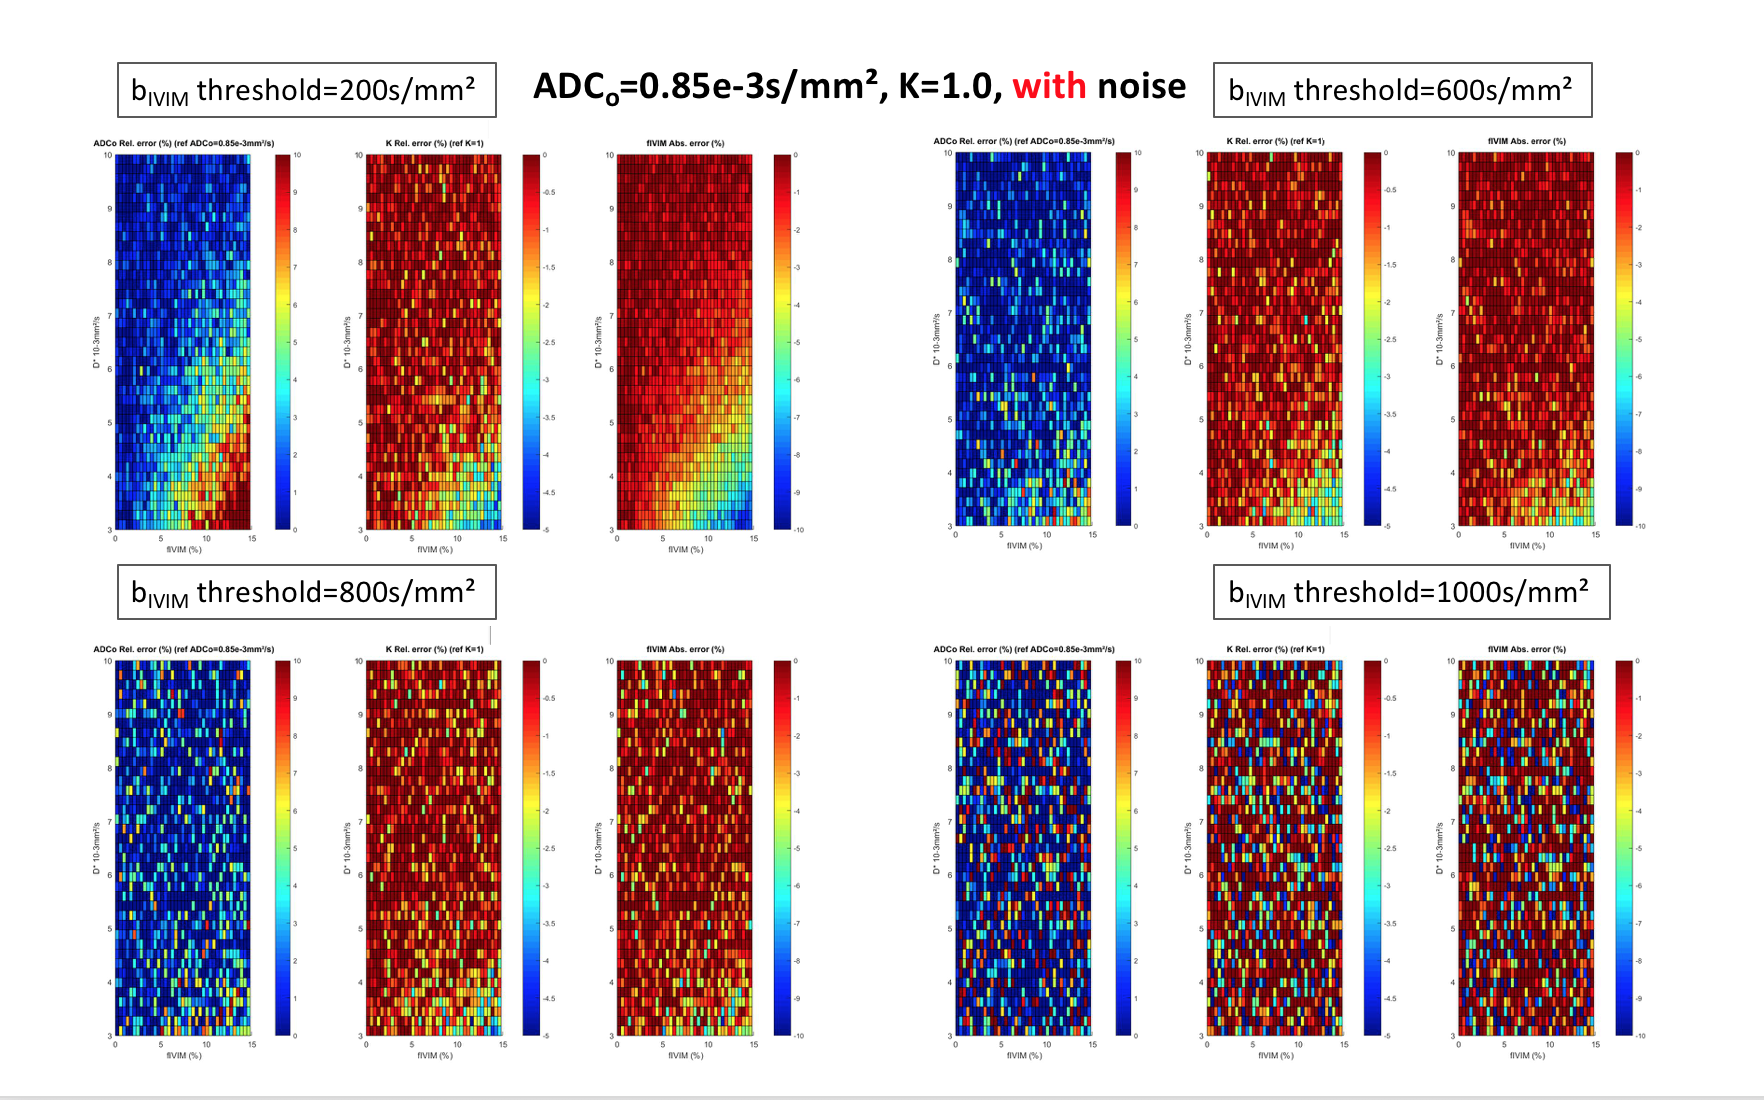
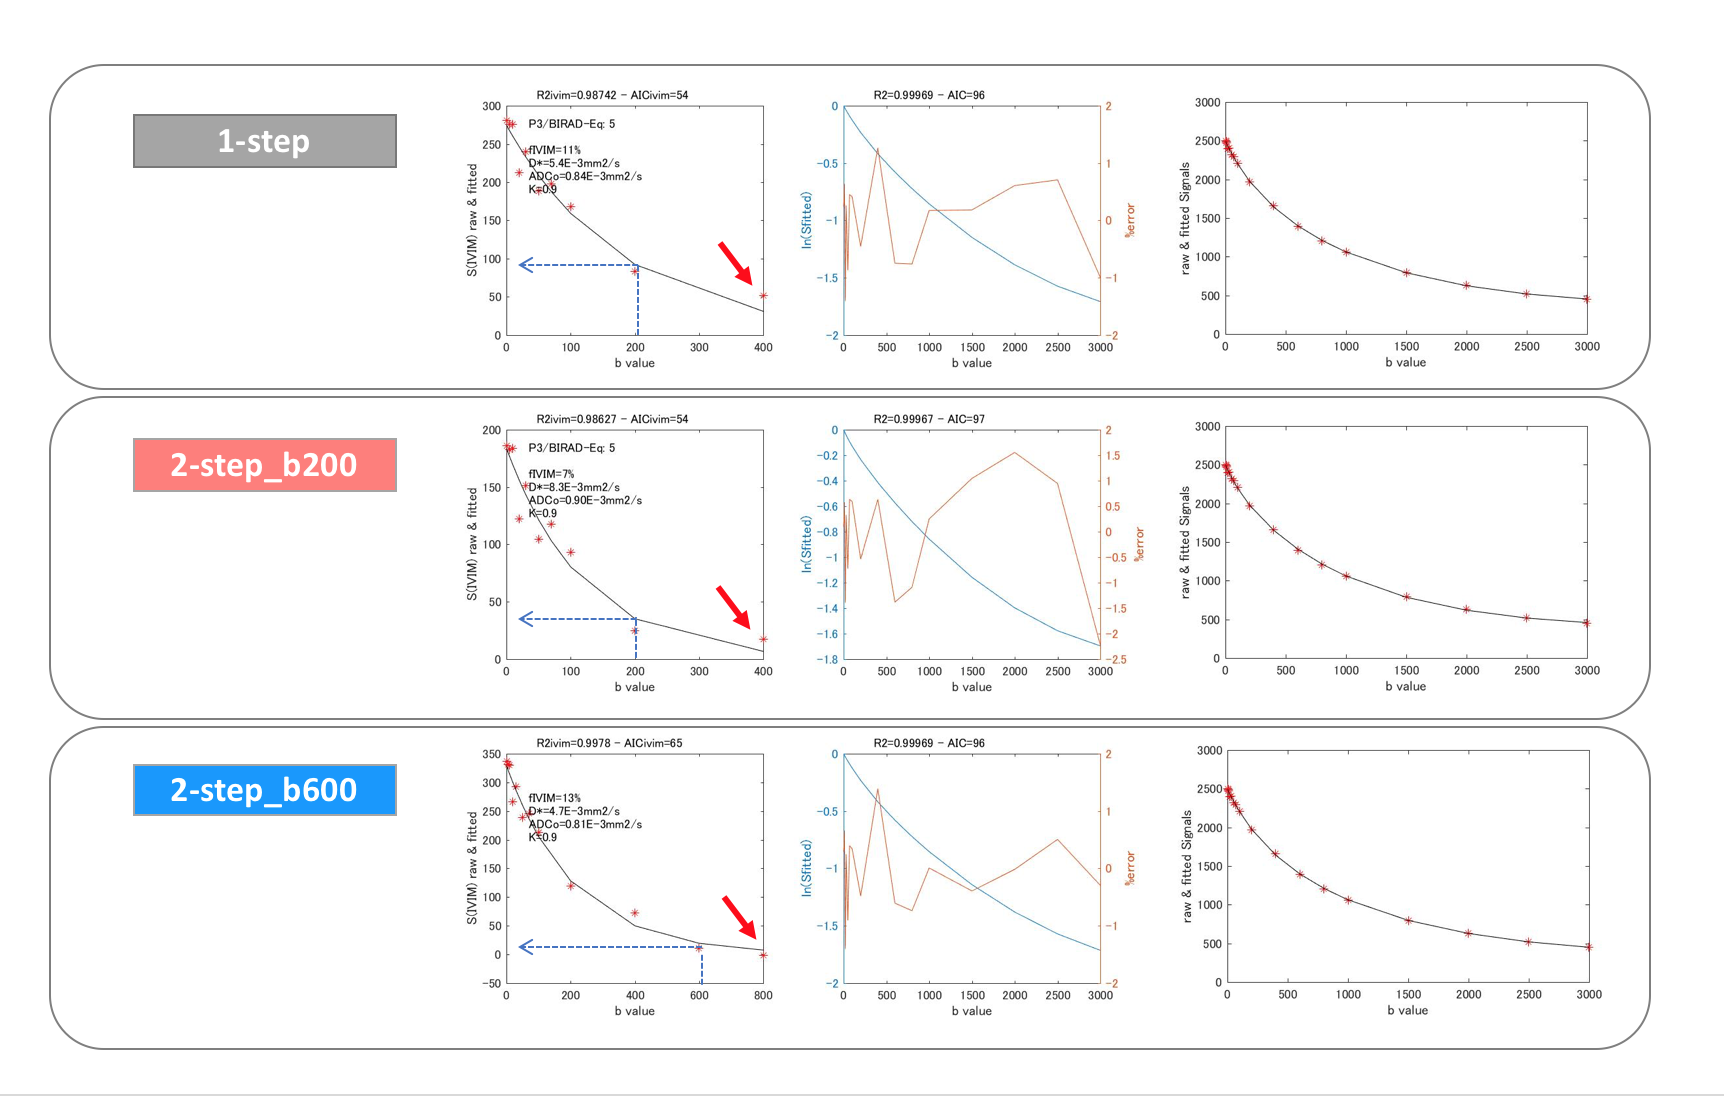
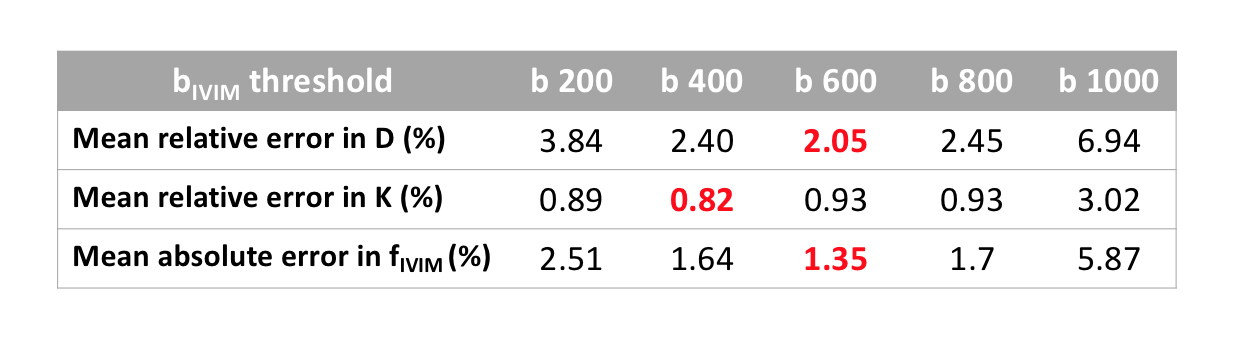
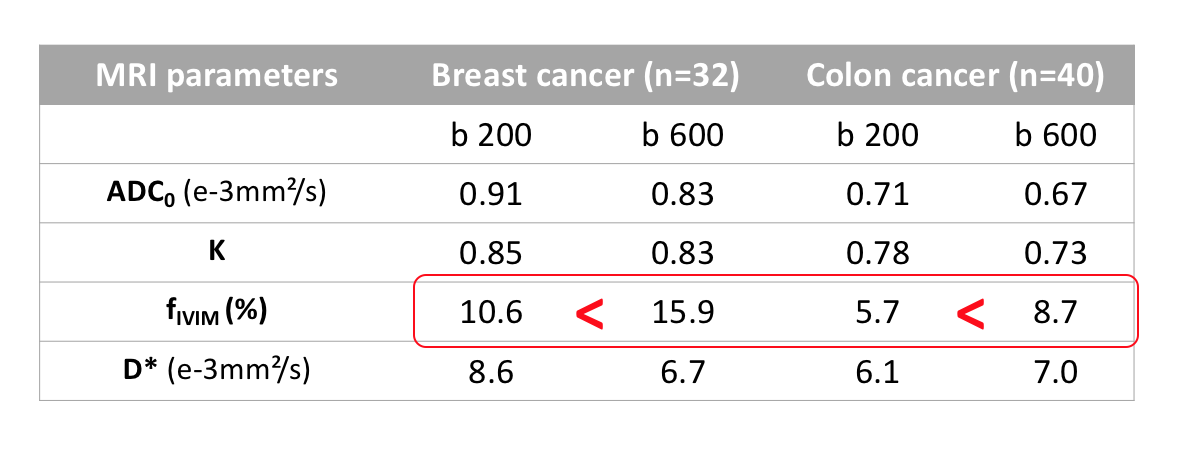
Simulations (Fig.1) show that, by principle, errors as large as 5-10% can be found in the estimates of ADC0, K and fIVIM when lowering the b value threshold for IVIM, especially for high values of fIVIM (>10%) and low values of D* (<4e-3mm²/s). Hence, a b-value threshold for IVIM as high as possible is recommended. However, in the presence of noise (Fig. 2), when the b threshold for IVIM becomes too high, fitting becomes inaccurate as less and noisier signals become available for the fitting of the diffusion component. With ADC0=0.85 e-3mm²/s and K=1.0, the optimal b threshold for IVIM is around 600s/mm² (Table 1). In vivo data confirmed those trends (Table 2, and typical example shown in Fig.3). In the breast cancer model the best fitting approach was found to be 26/32 (81%) for 2-step_b600 approach, 3/32 (9%) for 2-step_b200 and 10/32 (31%) for 1-step approach. The validity of the hypothesis that IVIM the component remains <1% of the total signal at the b value threshold was significantly more often violated with b=200s/mm² (91%, 29/32 ROIs vs. 63%, 20/32 ROIs for 600s/mm² in breast cancer and 78%, 31/40 ROIs vs. 45%, 18/40 ROIs for 600s/mm² in colon cancer, respectively (P<0.001).Discussion & Conclusion
This study using simulations and breast and colon cancer xenografts shows that the 2-step fitting approach using b=600s/mm² as the IVIM threshold provided the best fitting quality than when using b=200s/mm² as the threshold. The 1-step fitting, while simpler, is prone to noise effects for the estimation of IVIM parameters when the contribution of the flowing blood pseudo-diffusion component is much smaller than the tissue diffusion component. The two-step fitting model is more robust to noise, but an appropriate b-value threshold must be set (i.e.,Sivim/Stotal<1%). Interestingly, we found ROIs with low values of D* (around or smaller than 4e-3mm²/s), suggesting the presence of high diffusion water pools (large still blood pool, etc) artifactually contributing to the perfusion-driven IVIM component. Using a too low b value as a IVIM threshold in the 2-step fitting approach for the IVIM/Kurtosis model may lead to an overestimation of ADC0, and an underestimation of K and fIVIM values. The choice of the b-value threshold must be modulated depending on the tissue types.Acknowledgements
This work was supported by AMED Grant Number 22he0422025j0001 and JSPS KAKENHI Grant Number 19K17136.
References
1. Iima M, Thakur SB, Jerome NP, et al. Chapter 8 - IVIM and Non-Gaussian DWI of the Breast. In: Iima M, Partridge SC, Le Bihan D, editors. Diffusion MRI of the Breast. New Delhi: Elsevier; 2023. pp. 116–143.
2. Le Bihan D, Breton E, Lallemand D, Grenier P, Cabanis E, Laval-Jeantet M. MR imaging of intravoxel incoherent motions: application to diffusion and perfusion in neurologic disorders. Radiology 1986;161:401–407.
3. Jensen JH, Helpern JA, Ramani A, Lu H, Kaczynski K. Diffusional kurtosis imaging: the quantification of non-gaussian water diffusion by means of magnetic resonance imaging. Magn. Reson. Med. 2005;53:1432–1440.
4. Iima M, Yano K, Kataoka M, et al. Quantitative non-Gaussian diffusion and intravoxel incoherent motion magnetic resonance imaging: differentiation of malignant and benign breast lesions. Invest. Radiol. 2015;50:205–211.
Figures