1680
Added-value of 3D amide proton transfer MRI in assessing cervical cancer: a comparison with multiple model diffusion-weighted imaging1the First Affiliated Hospital of Zhengzhou University, Zhengzhou, China, 2Advanced Technical Support, Philips Healthcare, Beijing, China
Synopsis
Keywords: Cancer, CEST & MT, Cervical cancer
This study compared the diagnostic performances of mean, minimum, and maximum values of APT SI for preoperative identifying the prognostic factors (tumor stage, subtype, grade and LVSI status) of cervical cancer with those of multi-model DWI, and examined the additive value of 3D-APT imaging combined with multi-model DWI for the preoperative characterization of cervical cancer. The results showed that 3D-APT imaging was comparable with multi-model DWI for cervical cancer typing and grading. Adding APT to DWI can significantly improve the diagnostic performance with an AUC of 0.908 to predict tumor subtype, and an AUC of 0.903 to predict histological grade.Purpose
Amide proton transfer (APT) imaging has been gradually applied to cervical cancer [1-3], however, the relationships between 3D APT and multiple model diffusion-weighted imaging (DWI) have yet to be investigated. To evaluate the added value of 3D APT imaging to multiple model DWI for assessing prognostic factors of cervical cancer.Methods
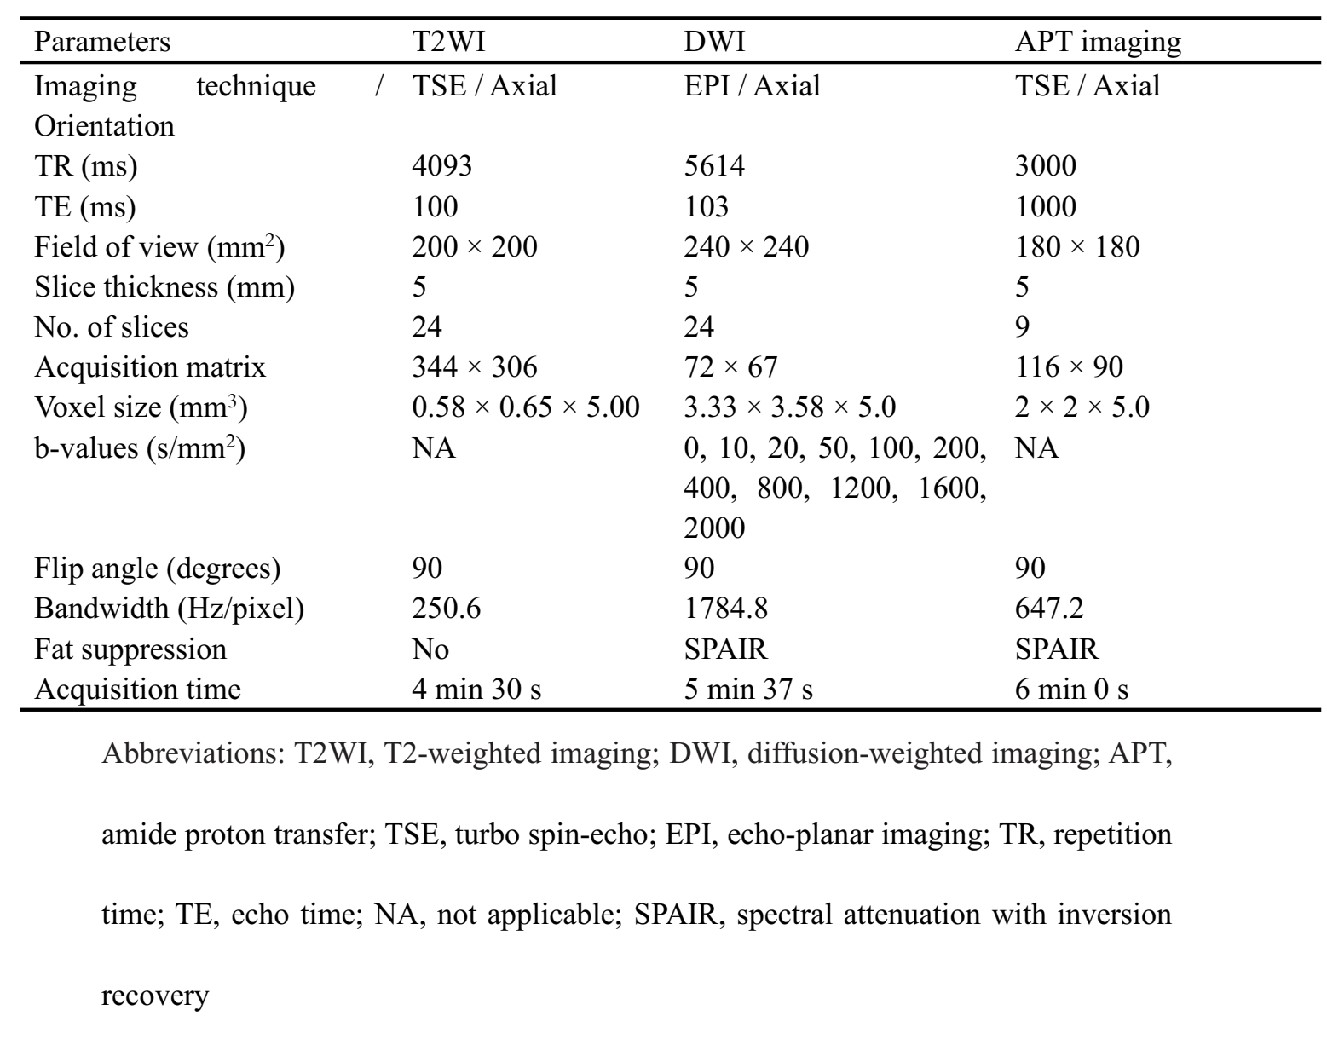
Eighty-eight patients with pathologically confirmed cervical cancer underwent APT imaging and DWI with 11 b-values on a 3T system (Ingenia CX, Philips Healthcare, Best, the Netherlands). APT imaging was conducted using an optimized 3D TSE pulse sequence combined with chemical shift-selective fat suppression for better robustness to field inhomogeneity and 3D volume coverage. The pre-saturation pulses consisted of 3 consecutive radiofrequency pulses of 500-ms duration with 500-ms interpulse delays and a time-average amplitude of 2 μT. Six different image volumes at saturation frequencies (± 3.5 ppm, ± 3.42 ppm, ± 3.58 ppm, and − 1560 ppm, relative to the water resonance frequency) were acquired for the Z-spectrum normalization and interpolation, and three acquisition were performed at + 3.5 ppm with different echo time shifts to obtain a Dixon-type B0 field map to correct for B0 inhomogeneities in the Z-spectrum frequency domain. DWI was obtained in a single-shot echo-planar imaging (EPI) sequence with diffusion gradient b factors of 0, 10, 20, 50, 100, 200, 400, 800, 1,200, 1,600, and 2,000 s/mm2. Detailed descriptions of MRI parameters are listed in Table 1. All data were transferred to a post-processing station (IntelliSpace Portal V10, Philips Healthcare, the Netherlands) for quantitative analysis. Mono-exponential, bi-exponential, and kurtosis models were fitted to calculate apparent diffusion coefficient (ADC), pure molecular diffusion (D), pseudo-diffusion (D*), perfusion fraction (f), mean diffusivity (MD), and mean kurtosis (MK). The APT SI was calculated as the asymmetry of the magnetization transfer rate (MTRasym) at the frequency offset of +3.5 ppm. The mean, minimum, and maximum values of APT signal intensity (APT SI) and DWI-derived metrics were compared based on tumor stages, subtypes, grades, and lymphovascular space invasion (LVSI) status. Receiver operating characteristic (ROC) curves were generated to examine the ability of each metric to distinguish different prognostic factors when appropriate. Logistic regression analyses were used to identify independent factors and combination diagnosis.Results
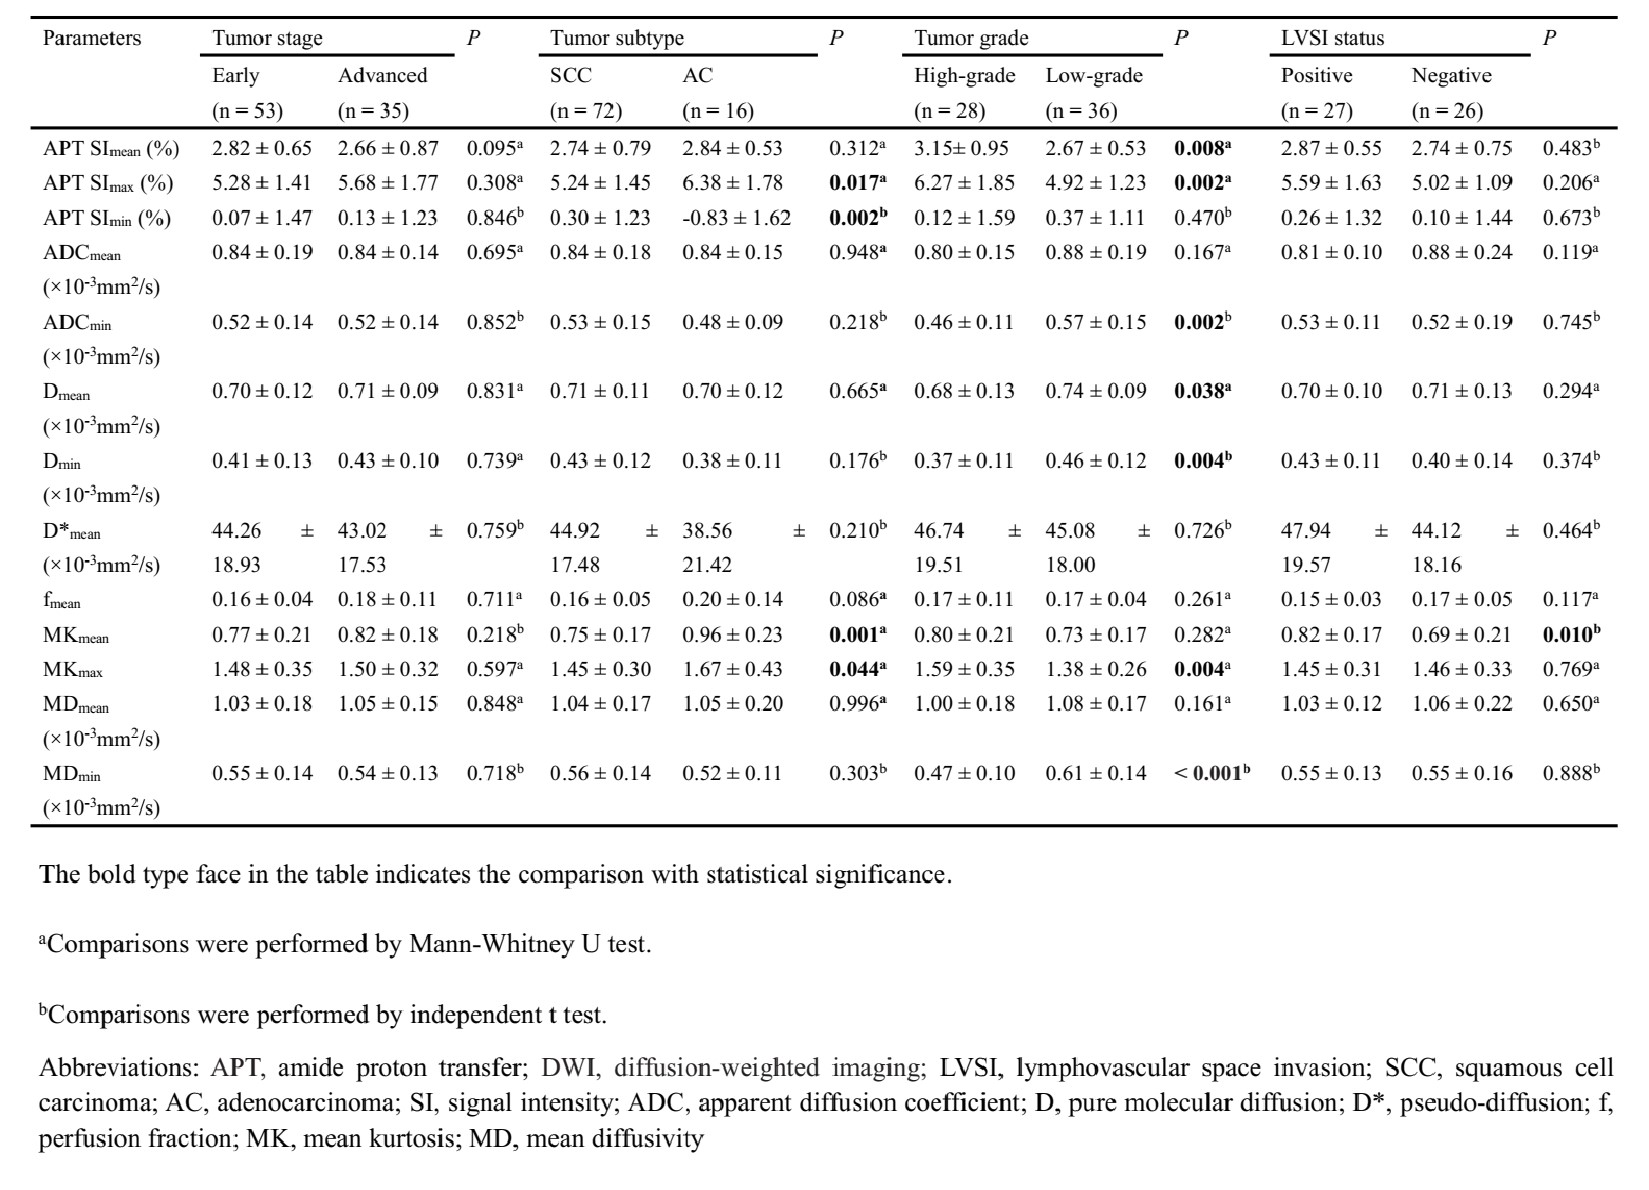
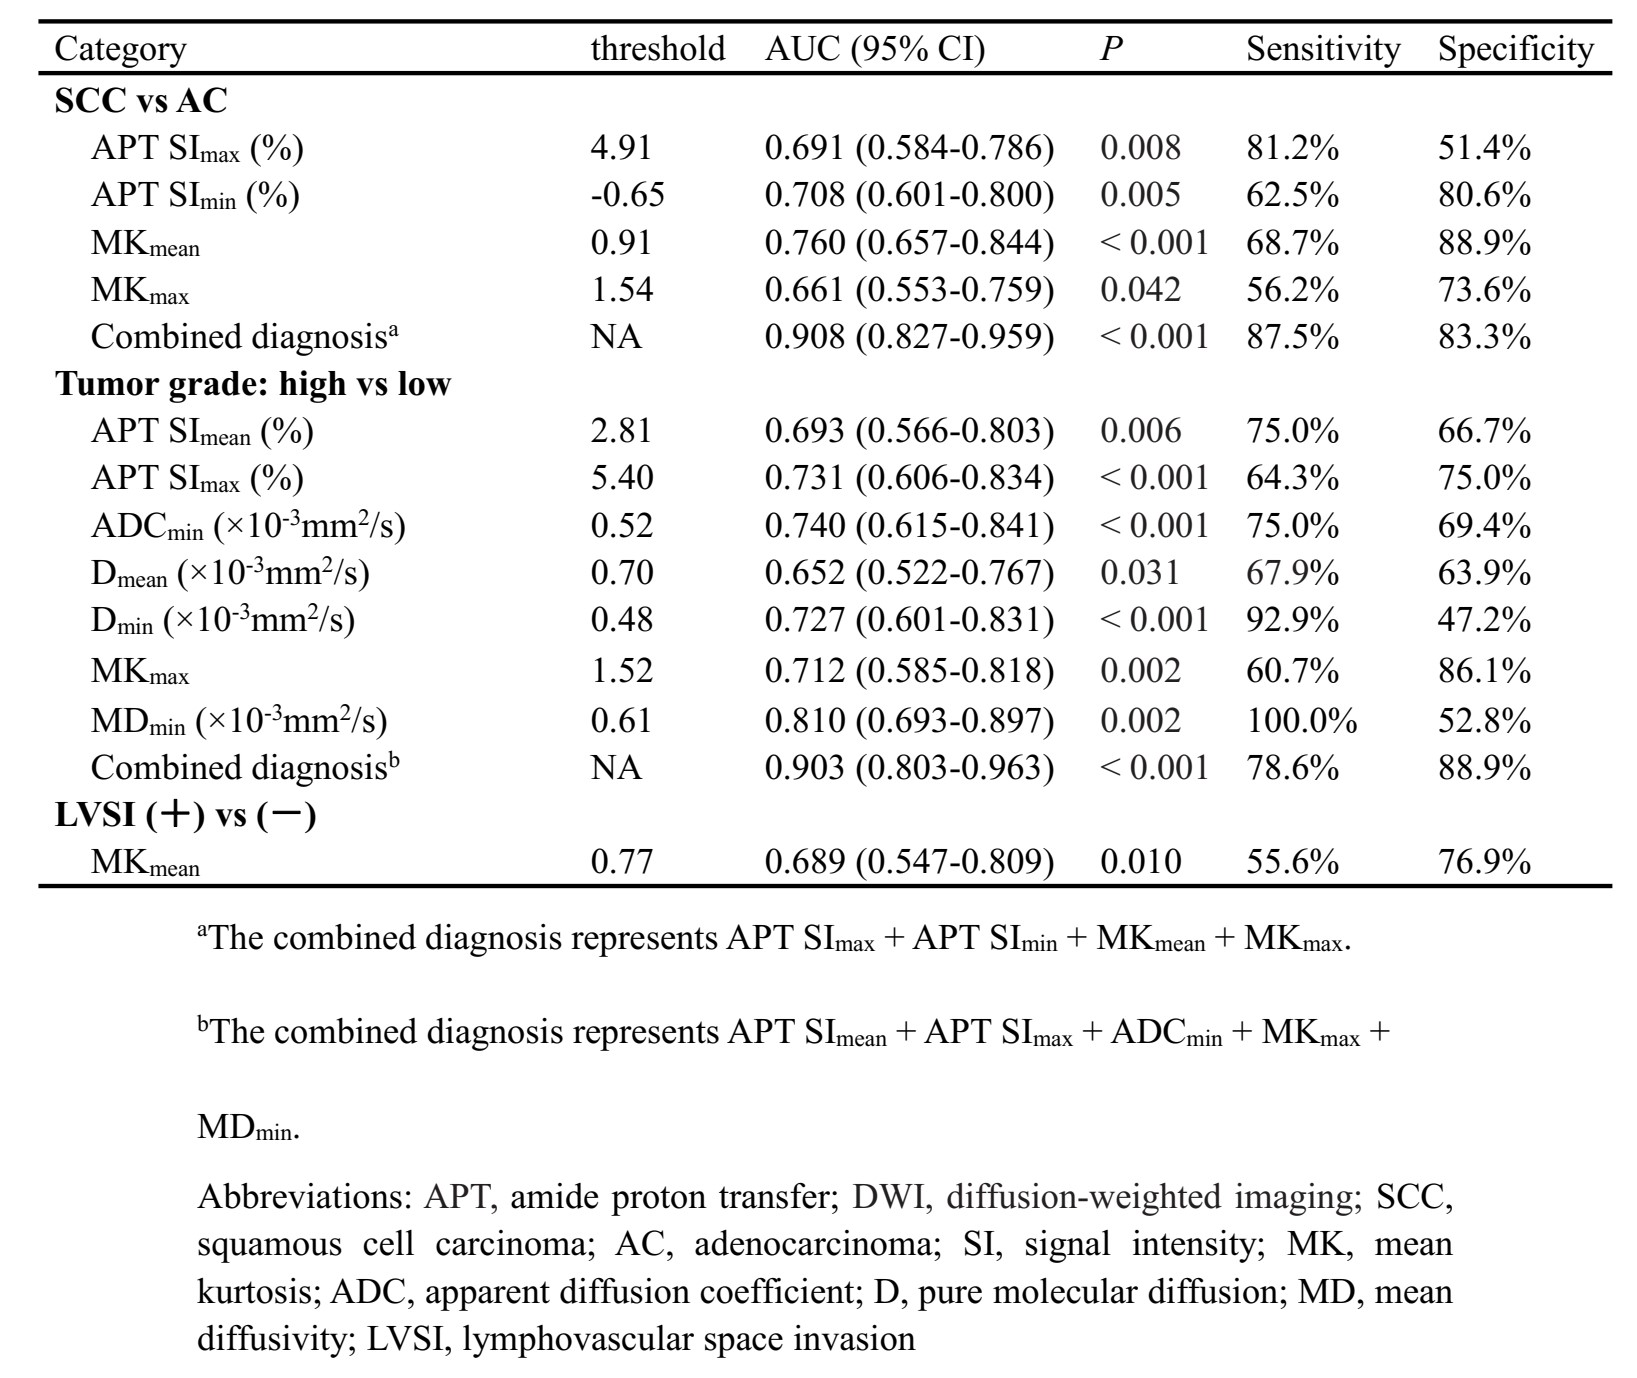
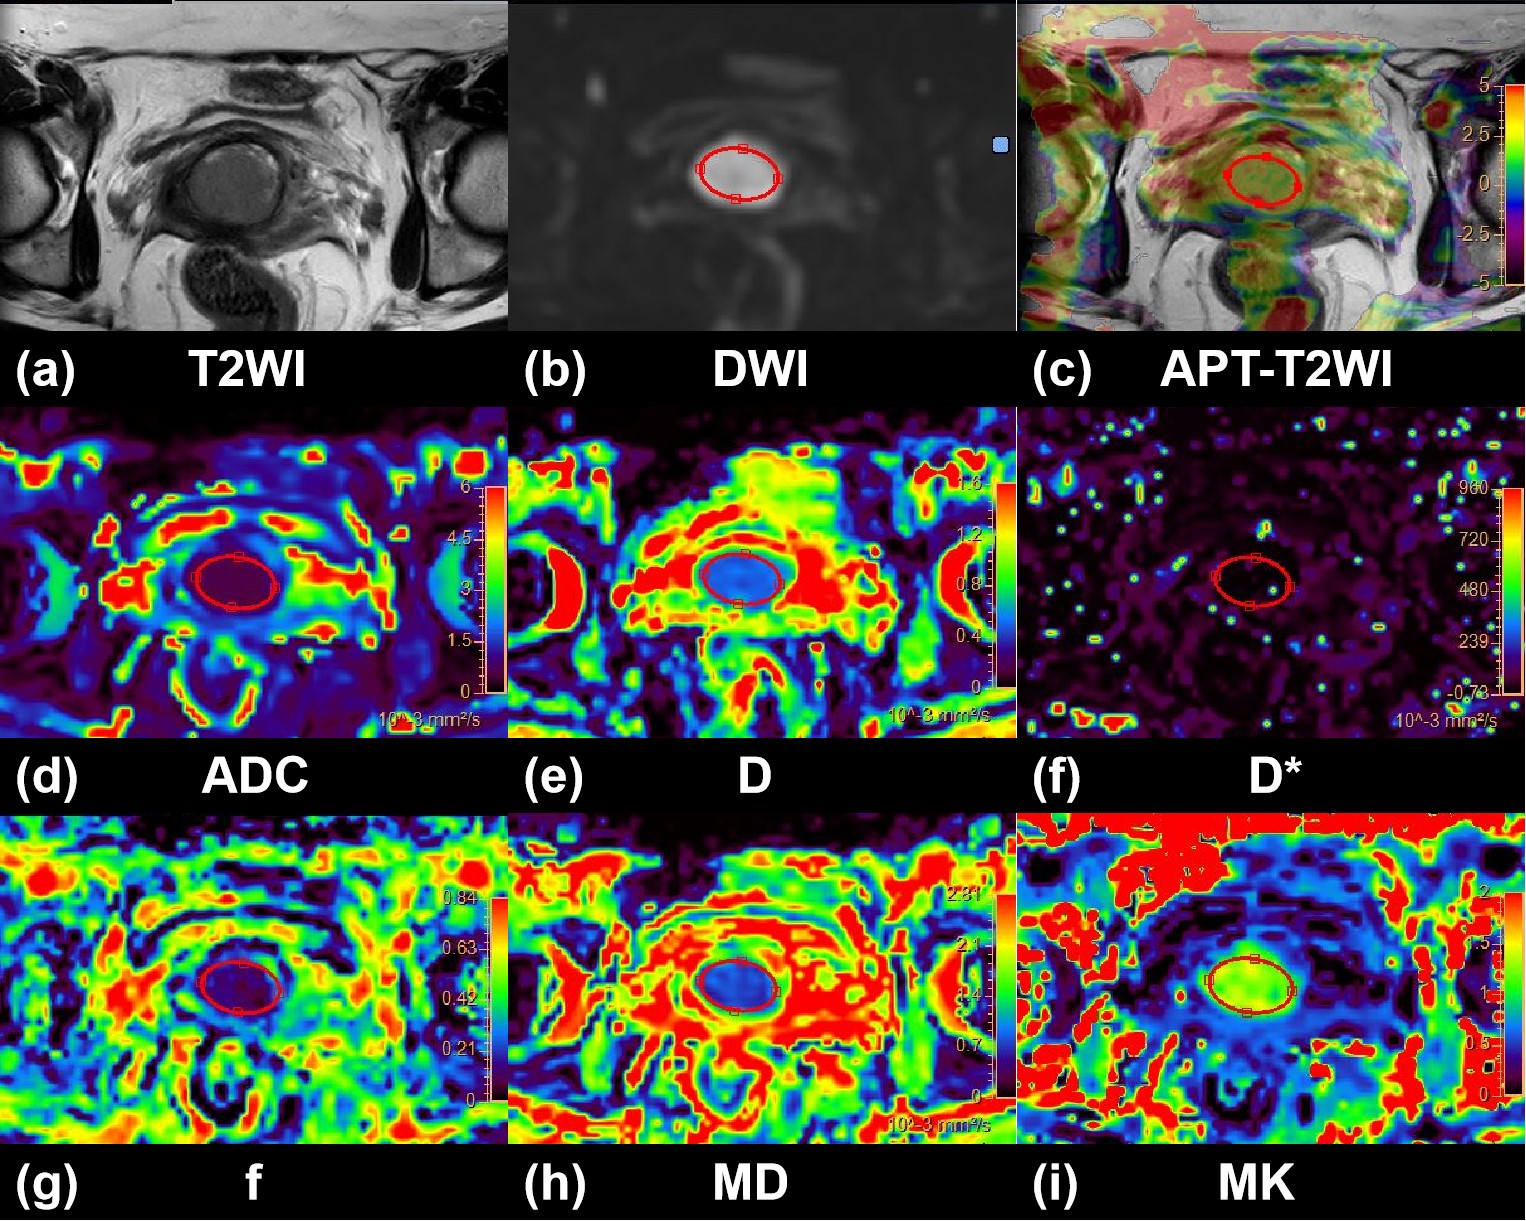
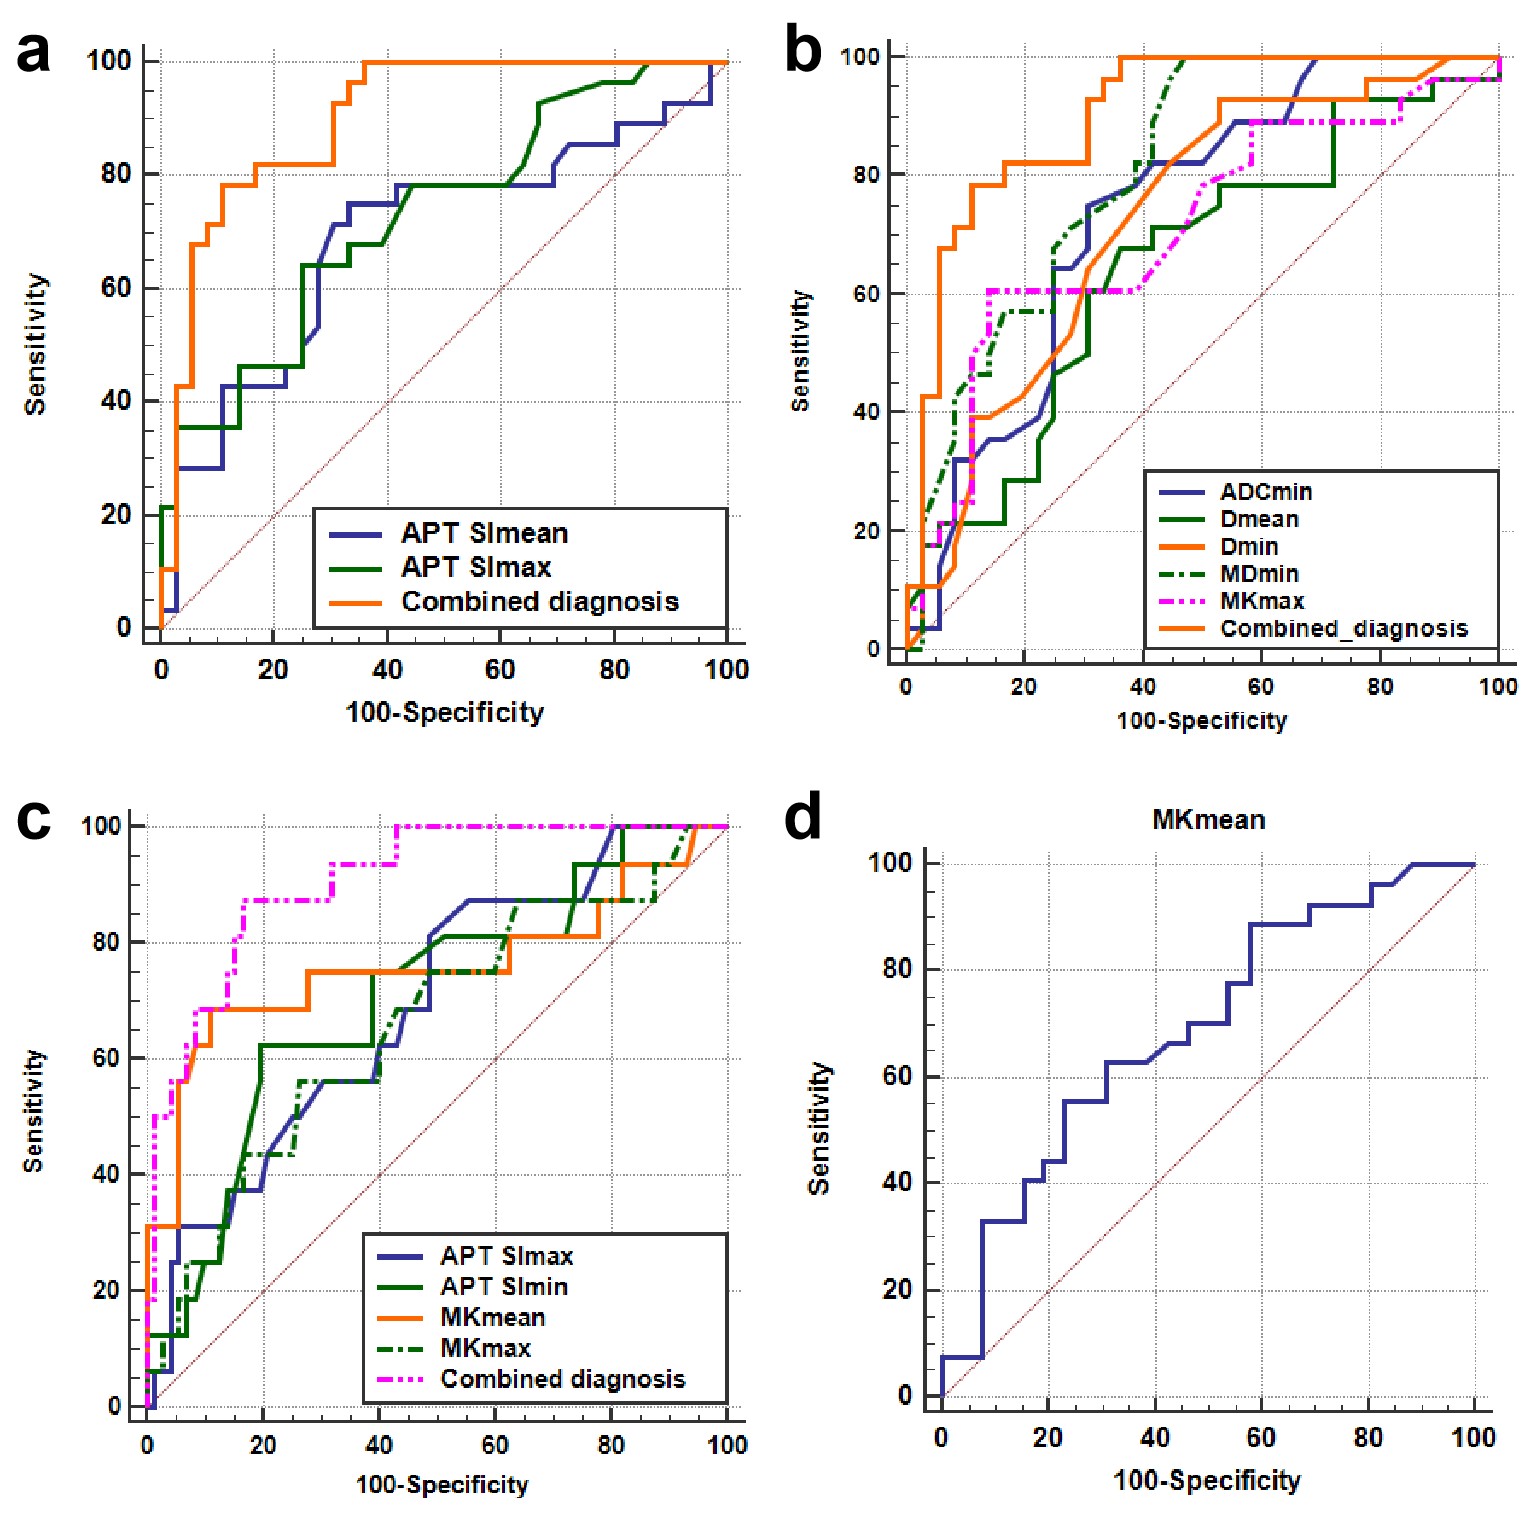
APT SImax, APT SImin, MKmean, and MKmax showed significant differences between squamous cell carcinoma (SCC) and adenocarcinoma (AC) (all P < 0.05). APT SImean, APT SImax, and MKmax were higher and ADCmin, Dmean, Dmin, and MDmin were lower in the high-grade group than in low-grade group (all P < 0.05). For distinguishing LVSI, only MKmean showed significant difference (P < 0.05). There was no significant difference between any metrics with regard to stages (all P > 0.05). The detailed results are shown in Table 2. Images from conventional T2W, APT imaging, and the three diffusion models of representative images are shown in Figure 1. APT SImax, APT SImin, and MKmean were the independent predictors for tumor subtype, and APT SImax, MDmin were the independent predictors for histological grade of cervical cancer. Table 3 and Figure 2 summarize the results of ROC curve analysis for significantly different metrics. When APT SImin and APT SImax was combined with MKmean and MKmax, the diagnostic performance was significantly improved for differentiating SCC and AC (AUC, 0.908). The combination of APT SImean, APT SImax, ADCmin, MKmax, and MDmin demonstrated a higher diagnostic performance than each individual metric (all P < 0.05) for predicting tumor grade (AUC, 0.903).Discussion
In this study, our results demonstrated that both APT imaging and multi-model DWI can be used to identify the histological subtype and grade of cervical cancer. Multiparametric analysis showed that adding APT to DWI can significantly improve the diagnostic performance with an AUC of 0.908 to predict tumor subtype, and an AUC of 0.903 to predict histological grade. The results of additional value of APT to DWI were basically consistent with the conclusions of Choi et al. and Meng et al. [4, 5]. Choi et al. found that APT imaging added value to the ADC for discriminating high-grade from low-grade gliomas [4]. Meng et al. demonstrated that the AUC of the combination of D, MK, and APT SI was significantly higher than that of any single metric for risk stratification in early-stage endometrial carcinoma [5]. These findings support the hypothesis that APT imaging complement the multi-model DWI for cervical cancer typing and grading, when the APT signal reflects a different aspect of the tumor microenvironment in comparison to the DWI metrics, namely the protein and peptide concentrations. To the best of our knowledge, this is the first report on the application of maximum and minimum values of APT SI in cervical cancer. Previous studies were performed at a single slice containing the maximum cross-sectional tumor area [1, 2]. In the present study, APT imaging was acquired using a 3D TSE sequence, which allowed the measurement of maximum and minimum values of APT SI based on volumetric coverage.Conclusion
3D-APT imaging was comparable with multi-model DWI for cervical cancer typing and grading. Addition of APT to DWI may improve the ability to noninvasively predict poor prognostic factors of cervical cancer.Acknowledgements
None.References
[1] Meng N, Wang X, Sun J, et al. Application of the amide proton transfer-weighted imaging and diffusion kurtosis imaging in the study of cervical cancer. Eur Radiol. 2020;30(10):5758-67.
[2] Hou M, Song K, Ren J, et al. Comparative analysis of the value of amide proton transfer-weighted imaging and diffusion kurtosis imaging in evaluating the histological grade of cervical squamous carcinoma. BMC Cancer. 2022;22(1):87.
[3] He YL, Li Y, Lin CY, et al. Three-dimensional turbo-spin-echo amide proton transfer-weighted mri for cervical cancer: A preliminary study. J Magn Reson Imaging. 2019 Oct;50(4):1318-1325. doi: 10.1002/jmri.26710. Epub 2019 Mar 12. PMID: 30859696.
[4] Choi YS, Ahn SS, Lee SK, et al. Amide proton transfer imaging to discriminate between low- and high-grade gliomas: added value to apparent diffusion coefficient and relative cerebral blood volume. Eur Radiol. 2017;27(8):3181-89.
[5] Meng N, Fang T, Feng P, et al. Amide Proton Transfer-Weighted Imaging and Multiple Models Diffusion-Weighted Imaging Facilitates Preoperative Risk Stratification of Early-Stage Endometrial Carcinoma. J Magn Reson Imaging. 2021;54(4):1200-11.
Figures