1673
R2* and ADC values in differentiating endometriosis-associated ovarian cancer from ovarian cancer1The First Affiliated Hospital of Dalian Medical University, Dalian, China, 2Clinical and Technical Support, Philips Healthcare, Beijing, China
Synopsis
Keywords: Cancer, fMRI
A total of 9 lesions from 7 EAOC patients and 21 lesions from 19 OC patients were collected to compare the differences in R2* and ADC values between the EAOC and OC groups. The results showed that the ADC values were able to discriminate between the two and there was no difference in R2* values.Summary of Main Findings
A total of 9 lesions from 7 EAOC patients and 21 lesions from 19 OC patients were collected to compare the differences in R2* and ADC values between the EAOC and OC groups. The results showed that the ADC values were able to discriminate between the two while there was no statistical difference in R2* values.Introduction
Several studies have reported an association between endometriosis and ovarian cancer[1], reflecting the overlapping risk factors between the two diseases. Endometriosis cystic sac-like fluid is rich in iron, which can cause oxidative stress leading to DNA damage and production of reactive oxygen species, resulting in gene mutations[2]. EAOC is commonly associated with type I ovarian cancer, which tends to be less malignant. In this study, we attempted to apply R2* and ADC values to discriminate EAOC from OC.Methods
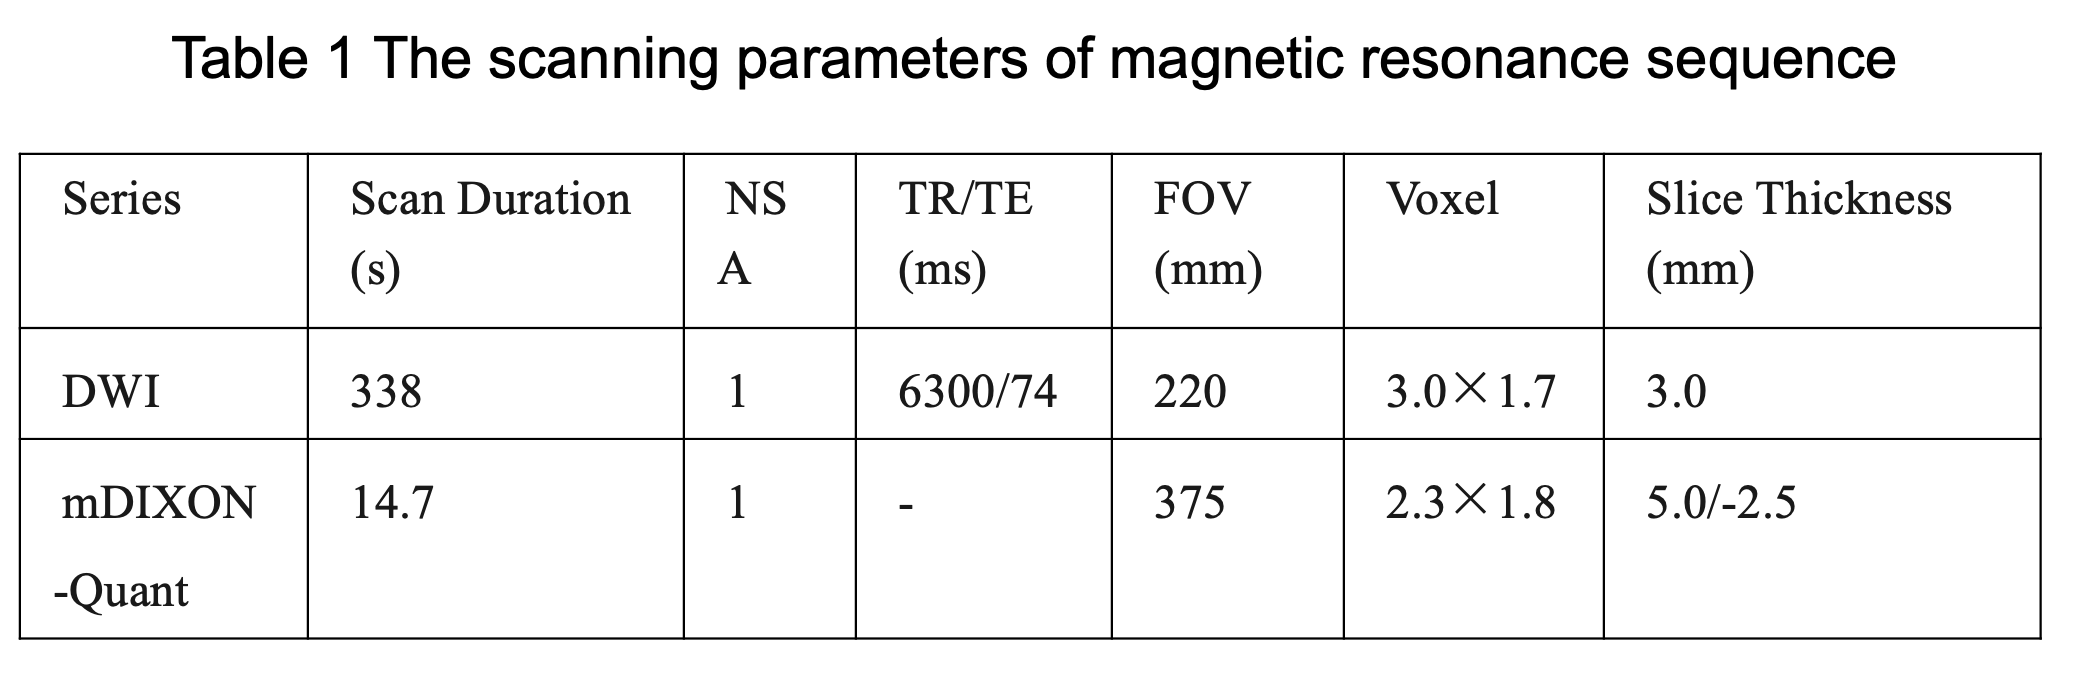
Seven EAOC patients and twenty-one OC patients were scanned using a 3.0 T MR scanner (Ingenia CX, Philips Healthcare, the Netherlands) with the body coil to transmit and a 32-channel receive coil. The MR protocol included a series of mDIXION-Quant and DWI (b=800 s/mm²) sequences, parameters shown in table 1. For each patient, independent measurements R2* and ADC value encompassing the solid lesion on the slice that crosses the largest section of the tumor. The intra-group correlation coefficient (ICC) method was used to evaluate the agreement between the two observers. The Mann-Whitney U test was used to compare the differences of R2* and ADC values between the two groups.Results
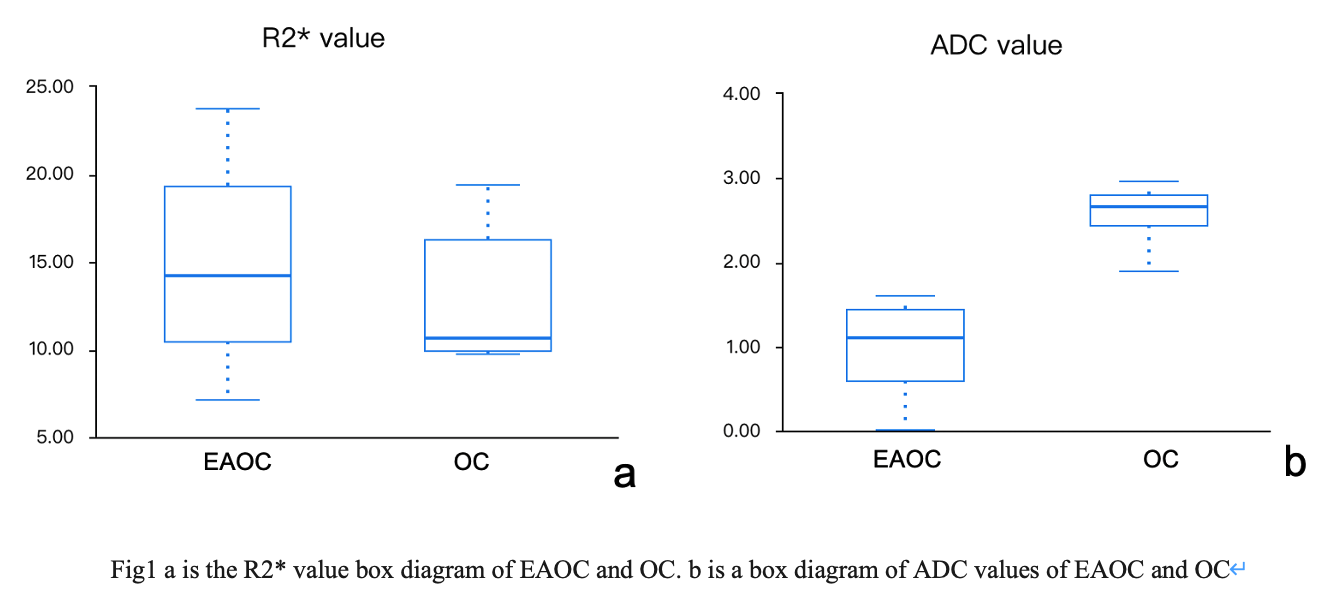
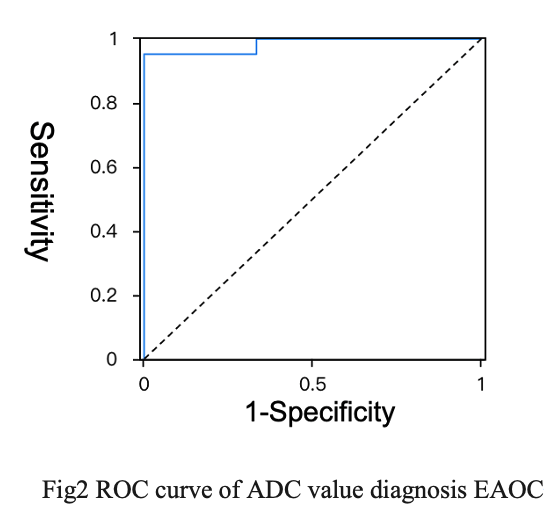
Good agreement was achieved by the two observers (ICC=0.99). The difference of R2* value between EAOC and OC group was not statistically significant (14.3 s-1 (10.4, 19.3) vs 10.6 s-1 (10.0, 16.2), P=0.402, fig 1a). The ADC value of EAOC was significantly lower than that of OC (1.1 ×10⁻³ mm²/s (0.6, 1.4) vs 2.7 ×10⁻³mm²/s (2.4, 2.8), P<0.01, fig 1b). The AUC value for identifying EAOC from OC was 0.984 (fig 2). When the ADC value was lower than 0.952×10⁻³mm²/s, the sensitivity of diagnosing EAOC was 0.952 and the specificity was 1.000, respectively.Discussion
Although endometriosis cystic vesicles are rich in iron and R2* can reflect tissue iron concentration, previous study showed no significant difference in iron content between EAOC and OC[3]. There was no difference in R2* values between EAOC and OC observed in this study,because that decrease in iron levels (<64.8 mg/L) suggests malignant transformation of endometriosis [4]. The ADC values of EAOC were lower than OC, Theoretically, increased cellular density in type II tumor should indeed result in a decrease in ADC values. However, blood flow in the capillary network contributes to DWI signal attenuation, and lead to the change the ADC value[5].Conclusion
The ADC value is potentially an imaging marker differentiating EAOC from OC.Acknowledgements
No acknowledgement found.References
[1] Terzic M, Aimagambetova G, Kunz J, et al. Molecular Basis of Endometriosis and Endometrial Cancer: Current Knowledge and Future Perspectives. Knowledge and Future Perspectives. Int J Mol Sci. 2021 Aug 27;22(17):9274.
[2] Guidozzi F. Endometriosis-associated cancer. climacteric. 2021 Dec;24(6):587-592.
[3] Imanaka S, Yamada Y, Kawahara N, et al. Validation of magnetic resonance relaxometry R2 value and cyst fluid iron level for diagnosis of ovarian endometrioma. Redox Rep. 2021 Dec;26(1):105-110.
[4] Yoshimoto C, Iwabuchi T, Shigetomi H, et al.. Cyst fluid iron-related compounds as useful markers to distinguish malignant transformation from benign endometriotic cysts. Cancer Biomark. 2015;15(4):493–499.
[5] Wang F, Wang Y, Zhou Y, et al. Comparison between types I and II epithelial ovarian cancer using histogram analysis of monoexponential, biexponential, and stretched-exponential diffusion models. J Magn Reson Imaging. 2017 Dec;46(6):1797-1809.
Figures