1671
Radiomic signature based on enhanced CT and 3T MRI for survival analysis in patients with esophageal squamous carcinoma
Dexuan Li1, Chenglong Wang1, Funing Chu2, Jinrong Qu2, Yang Song3, and Guang Yang1
1Shanghai Key Laboratory of Magnetic Resonance, East China Normal University, Shanghai, China, 2Department of Radiology, The Affiliated Cancer Hospital of Zhengzhou University &Henan Cancer Hospital, Zhengzhou, China, 3MR Scientific Marketing, Siemens Healthcare, Shanghai, China
1Shanghai Key Laboratory of Magnetic Resonance, East China Normal University, Shanghai, China, 2Department of Radiology, The Affiliated Cancer Hospital of Zhengzhou University &Henan Cancer Hospital, Zhengzhou, China, 3MR Scientific Marketing, Siemens Healthcare, Shanghai, China
Synopsis
Keywords: Cancer, Tumor
We enrolled 478 patients with esophageal squamous carcinoma (ESCC) split them into a training and a test cohort with a ratio of 7 to 3. Radiomic features were extracted from lesions on both MR and CT images and used to build models for predicting disease-free survival (DFS) and overall survival (OS). For both MR and CT images, the radiomic signature combined with clinical variables achieved performance comparable to radiological signature. Over the test cohort, MRI-based models achieved C-index values of 0.707 and 0.663 for DFS and OS predictions, respectively; CT-based models achieved 0.731 and 0.68 for DFS and OS, respectively.Introduction
Esophageal cancer (EC) is a common malignant tumor around the world1. Squamous and adenocarcinomas are the two types of EC. The former predominates in Asian countries and the latter in Europe and the United States 2,3. CT is the modality of choice for EC. MRI can provide valuable supplementary information when CT cannot distinguish the relationship between the primary focus of the EC and the surrounding tracheal, bronchial membranes and outer membrane of the aorta.Survival analysis can provide information for personalized treatment planning and better follow-up plans to monitor recurrence. In this study, we built radiomic models for survival analysis and compared their performance with those of machine learning models built with radiological features. Our goal was to evaluate whether radiomic signature can replace the radiological signature in the survival analysis of esophageal squamous carcinoma (ESCC).
Methods
We retrospectively enrolled 478 ESCC patients and randomly split them into training (n=334) and test (n=144) cohorts. Re-splitting was used to ensure that there were no significant differences between the distribution of clinical and radiological features in two cohorts.All patients performed contrast-enhanced chest CT on one of three systems (Phillips 256 iCT, Phillips Medical System; Bright speed 16-slice CT or light speed Pro 32-slice VCT, GE Medical systems, USA) using following acquisition parameters: 110-120 kV; 168-324 mA; rotation time, 0.5 or 0.4s; detector collimation: 64 × 1.25 mm, 64 × 0.625 mm, 16 × 1.25 mm or 32 × 1.25 mm; field of view, 500 × 500 mm; matrix, 512 × 512. All CT images were reconstructed with the standard kernel.
Esophageal MRI was performed using a 3T scanner (Magnetom Skyra, Siemens Healthcare, Germany). A post-contrast StarVIBE was performed (section thickness, 3 mm; slice, 48; repetition time/echo time, 3.98/1.91 msec; number of excitations,1; matrix, 288 × 288; field of view, 300 × 300 × 216 mm3; voxel size, 1.0 × 1.0 × 3.0 mm3; flip angle, 12°; radial views, 1659; scanning time, 309 seconds) for the whole chest with free breathing 20 seconds after intravenous injection.
For both MR and CT images, we build two models: one using radiological signatures (T-staging, tumor length, and tumor thickness at baseline) combined with clinical variables (sex, age, location of tumor, M-staging, and N-staging), and one using radiomic features combined with clinical variables.
The workflow is shown in Figure 1. As for radiomic feature extraction, first, image resolution for MR and CT images was resampled to 0.83 × 0.83 ×1 and 0.79 × 0.79 ×0.8 respectively. Then the intensity was normalized to the range of [0, 1]. Radiomic features were extracted from ROIs with PyRadiomics4 (ver. 3.0.1) on both MR and CT images. Besides 14 shape features, 18 first order and 75 texture features were extracted from original images and 3 images filtered with LoG (Laplacian of Gaussian) with different sigma values (1.0, 3.0, and 5.0). Texture features included the features based on gray-level co-occurrence matrix (GLCM, 24), gray-level size zone matrix (GLSZM, 16), gray-level dependence matrix (GLDM, 14), neighboring gray tone difference matrix (NGTDM, 5), and gray-level run length matrix (GLRLM, 16). Totally, 386 radiomic features were extracted for each ROI. All features were normalized with z-score. We selected features using Cox regression with elastic net regulation5. Five-fold cross validation was used to select best parameter for elastic net. Finally, we combined radiomic features from the original and LoG-filtered images to build the final radiomic model. All models were built with scikit-survival6 (ver.0.19.0), a Python module for survival analysis built on top of scikit-learn.
Results
The comparison results of the two models are visualized in Figure 2. The results demonstrated that for both OS and DFS prediction, the radiomic model achieved competitive performance with the radiological model on MR and CT images (p-value > 0.1). Detailed OS and DFS prediction results are listed in Table 1 and Table 2. Coefficients (i.e. logarithm of the hazard rate) of the selected features are visualized in Figure 3.Discussion
In our previous study, we have investigated the performance of 3T MR-based radiomic models in predicting DFS and OS in EC patients7. In this work, we also included the validation of CT-based radiomic models for survival analysis for ESCC patients. On both MR and CT images, the prognostic efficacy of the radiomic models was comparable to that of the models based on radiological features. To the best of our knowledge, this is the first work to validate radiomic signature on both MRI and CT images for the survival analysis of esophageal cancer. This work has shown the potential of radiomic model to replace classic radiological characteristics in survival analysis for ESCC, which can effectively reduce the labor of the radiologists. For future works, we need to increase the dataset size and group patients by the treatment plan to obtain stratified, treatment plan-dependent prognostic assessments.Acknowledgements
This work is supported in part by Shanghai Pujiang Program (Grant No. 2020PJD016), China Postdoctoral Science Foundation (Grant No. 2021M691038)References
- Siegel RL, Miller KD, Fuchs HE, Jemal A. Cancer statistics.CA Cancer J Clin.2022; (72):7-33.
- Chen W, Zheng R, Baade PD, et al. Cancer statistics in China. 2015; CA Cancer J Clin(66):115–132.
- Arnold M, Soerjomataram I, Ferlay J, Forman D. Global incidence of oesophageal cancer by histological subtype in 2012. 2015; Gut 64:381–387.
- Van Griethuysen J J M, Fedorov A, Parmar C, et al. Computational radiomics system to decode the radiographic phenotype. Cancer research. 2017; 77(21): e104-e107.
- Zou H, Hastie T. Regularization and variable selection via the elastic net. Journal of the royal statistical society: series B (statistical methodology). 2005; 67(2): 301-320.
- Pölsterl S. scikit-survival: A Library for Time-to-Event Analysis Built on Top of scikit-learn. J. Mach. Learn. Res. 2020; 21(212): 1-6.
- Chu F, Liu Y, et al. Development and validation of MRI-based radiomics signatures models for prediction of disease-free survival and overall survival in patients with esophageal squamous cell carcinoma. Eur Radiol. 2022 Sep;32(9):5930-5942.
Figures

Table1 C-index of OS prediction

Table
2 C-index of DFS prediction
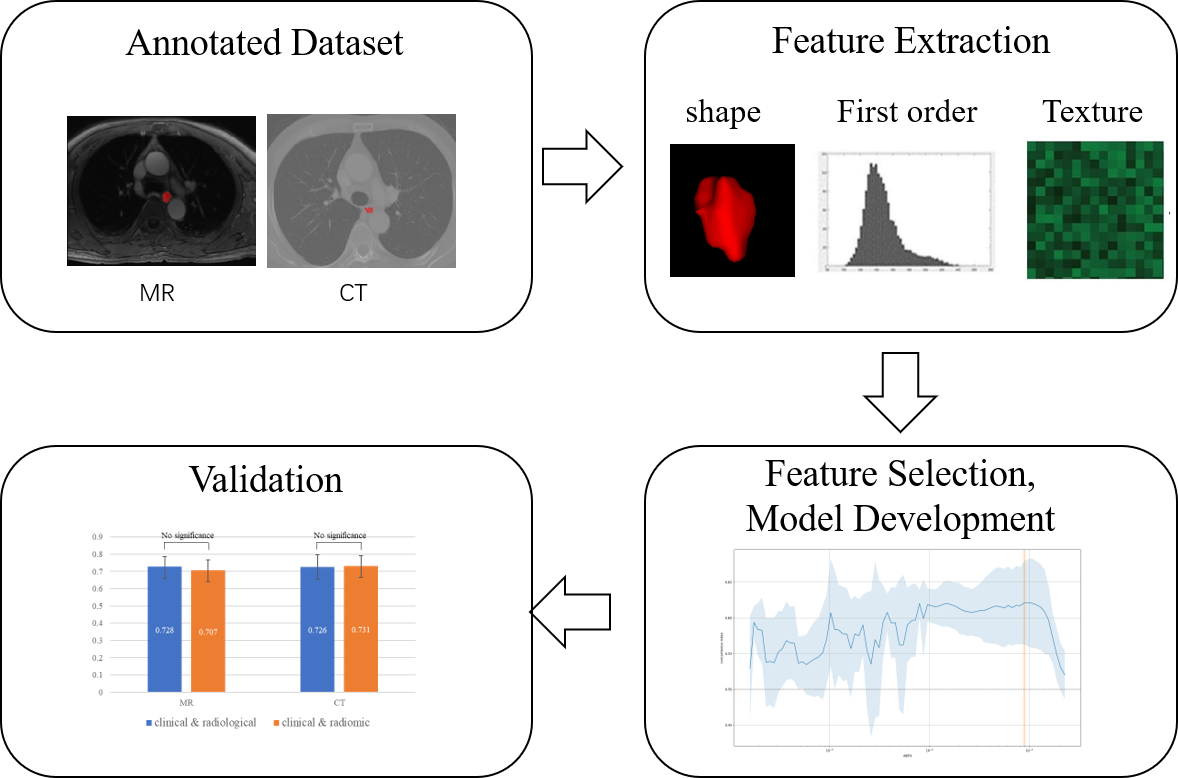
Figure 1 Workflow of this study
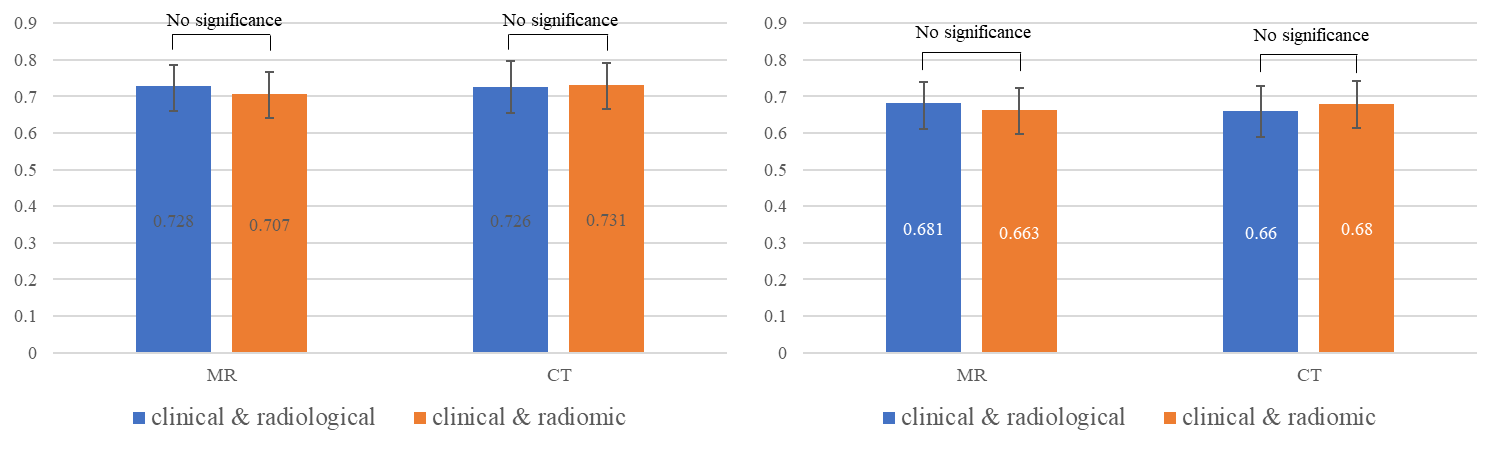
Figure
2 Results of OS (left) and DFS (right) prediction on
test cohort. Blue and orange bars indicate radiological and radiomic models,
respectively.
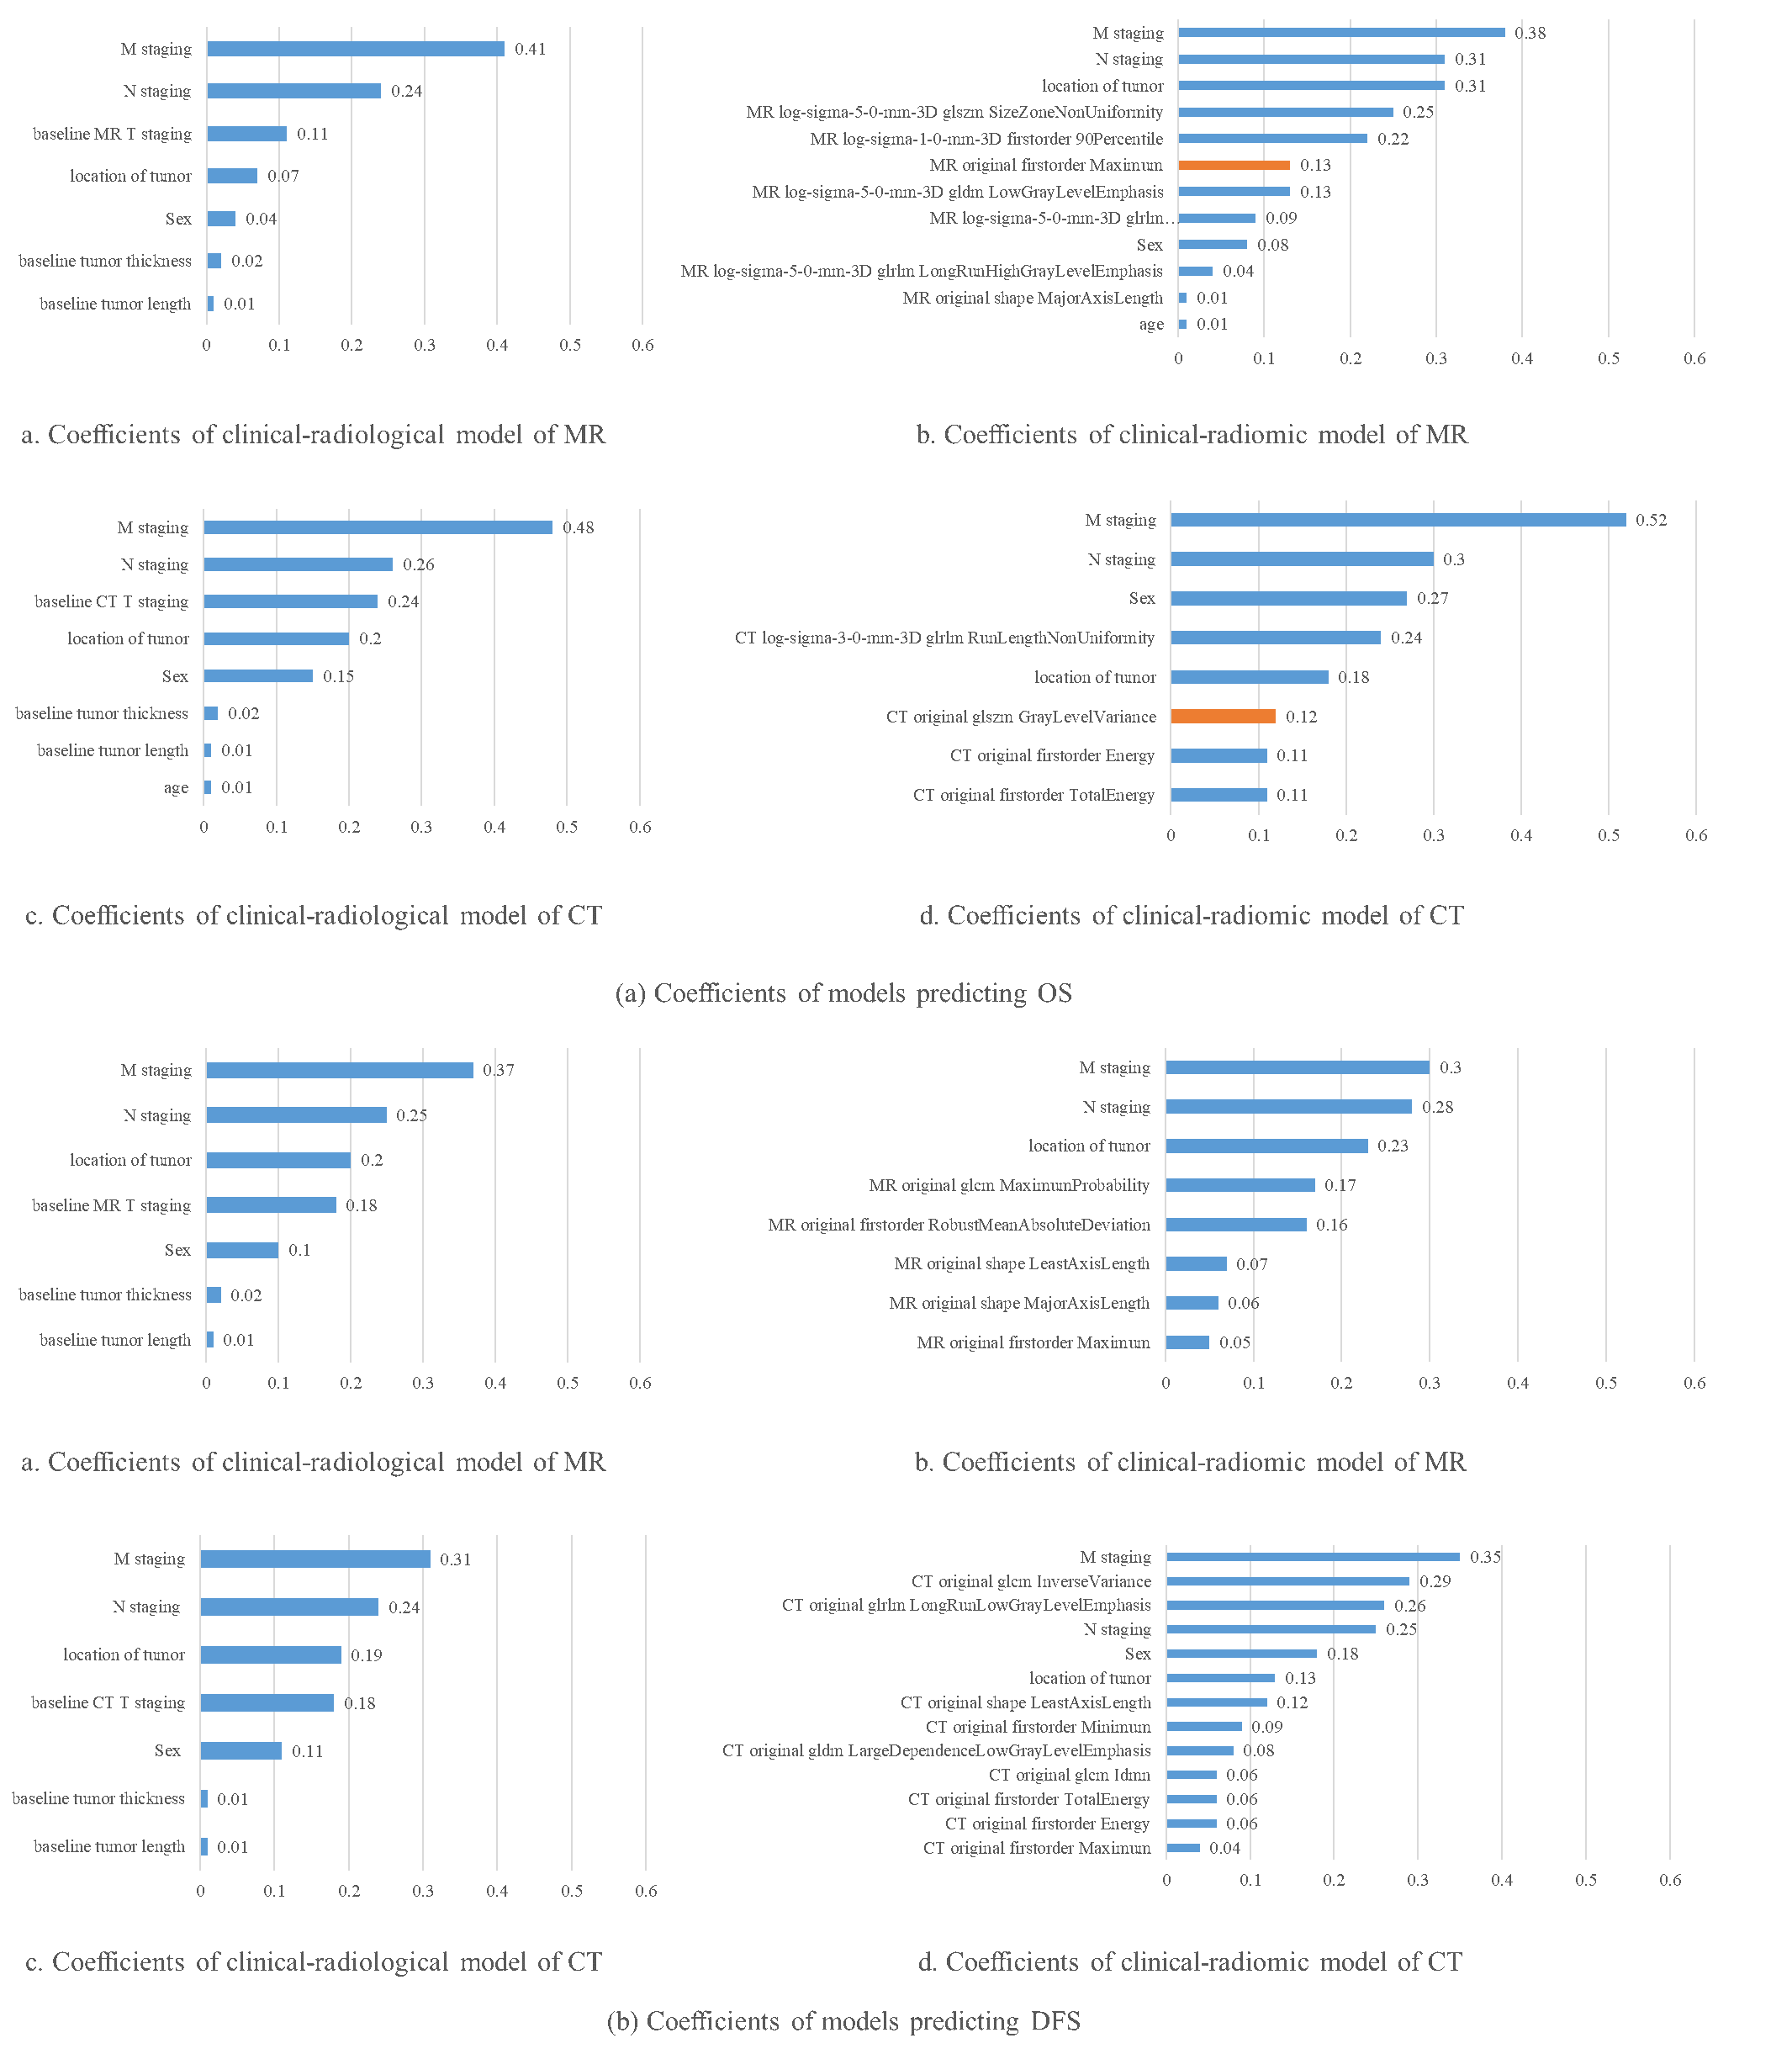
Figure
3 Features and their corresponding coefficients
in all models. (a) OS prediction models, (b) DFS prediction models. Blue and
orange bars indicate positive and negative coefficients respectively.
DOI: https://doi.org/10.58530/2023/1671