1665
Mammary tumor COX-2 expression in immunocompromised mice contributes to splenic MDSC expansion and alters splenic metabolism
James Dion Barnett1, Marie-France Penet1,2, Santosh Kumar Bharti1, Yelena Mironchik1, Balaji Krishnamachary1, and Zaver M Bhujwalla1,2,3
1The Russell H. Morgan Department of Radiology and Radiological Science, Johns Hopkins University School of Medicine, Baltimore, MD, United States, 2Sidney Kimmel Comprehensive Cancer Center, Baltimore, MD, United States, 3Department of Radiation Oncology and Molecular Radiation Sciences, Baltimore, MD, United States
1The Russell H. Morgan Department of Radiology and Radiological Science, Johns Hopkins University School of Medicine, Baltimore, MD, United States, 2Sidney Kimmel Comprehensive Cancer Center, Baltimore, MD, United States, 3Department of Radiation Oncology and Molecular Radiation Sciences, Baltimore, MD, United States
Synopsis
Keywords: Cancer, Preclinical, Spleen, MDSC, Cancer, COX-2
Tumor COX-2 expression in breast cancer has been associated with increased aggressiveness. Here we have investigated the effects of tumor COX-2 levels on spleen metabolism and on the expansion of myeloid derived suppressor cells (MDSCs) that potentiate cancer progression. Studies were performed with human triple negative breast cancer cells in immune suppressed mice and mouse breast cancer cells in immune competent mice. COX-2 levels significantly altered splenic metabolism and MDSC expansion in immune suppressed mice but not in immune competent mice that may have implications for breast cancer patients that are immune compromised.Introduction
Cyclooxygenase-2 (COX-2) is an inducible enzyme that catalyzes the conversion of arachidonic acid into its proinflammatory downstream mediator prostaglandin E2 (PGE2). An inflammatory tumor microenvironment (TME) has been reported to contribute to drug resistance [1] and immunosuppression [2] through PGE2 signaling. COX-2 overexpression in human cancers is a strong prognostic factor for poor clinical survival and disease recurrence [3]. We generated genetically modified human triple negative breast cancer (TNBC) to overexpress COX-2 [4] and murine TNBC cells to silence COX-2 for the investigation of its role in promoting cancer aggressiveness. High resolution 1H magnetic resonance spectroscopy (MRS) was used to study how modulating tumor COX-2 expression impacts spleen metabolism in female severe combined immunodeficient (SCID) and immunocompetent BALB/c mice. During tumorigenesis, the spleen serves as a major reservoir for myeloid-derived suppressor cells (MDSCs). MDSCs are potent immunosuppressors that support immune evasion and cancer progression [5]. Flow cytometric analysis of spleens from COX-2-modulated tumor-bearing (TB) mice was also conducted to determine changes in MDSC abundance. Interrogating how tumor COX-2 induces changes in spleen metabolism is crucial for understanding the connection between the tumor and its macroenvironment.Methods
We generated human triple negative SUM-149 cells stably overexpressing COX-2 (SUM-149-COX2) by cloning the COX-2 gene into an expression vector as previously reported [4]. Cells with an empty vector (SUM-149-EV) were generated similarly [4]. After discovering that murine triple negative 4T1 cells express high COX-2, we established 4T1 cells with an empty vector (4T1-EV) and COX-2-silenced cells through shRNA-mediated gene silencing (4T1-COX2shRNA). We implanted SUM-149-EV and SUM-149-COX2 cells in the mammary fat pad of SCID mice, and 4T1-EV and 4T1-COX2shRNA cells in the mammary fat pad of immune competent BALB/c mice. Uninoculated, age-matched female mice of both strain were used as controls (Ctrl). Once tumors reached an approximate volume of 400 - 500 mm3, the tumor and mouse organs were harvested. Western blot analysis to confirm tumor COX-2 expression. Mouse spleens were freeze clamped and cryopulverized in liquid nitrogen followed by dual-phase extraction using methanol, chloroform and water. 1H MRS was performed on a Bruker Avance III 750 MHz (17.6T) MR spectrometer for water-soluble metabolites identification. Data acquisition was performed using a 5 mm inverse triple-resonance (TXI) probe. Topspin 3.5 software was used for data processing, analysis and quantification. Internal standard sodium trimethylsilyl propionate (TSP) and spleen sample weight were used to determine metabolite concentrations. To evaluate the involvement of tumor COX-2 expression on splenic MDSC expansion, mice were housed under the same inoculation regimen for BALB/c mice (Ctrl, 4T1-EV and 4T1-COX2shRNA) and SCID mice (Ctrl, SUM-149-EV and SUM-149-COX2). Mice were euthanized and spleens were dissociated through a 70-micron cell strainer followed by red blood cell lysis. Flow cytometric analyses of MDSC markers Gr1 and CD11b were performed using a FACS Calibur system.Results
Figure 1 illustrates COX-2-induced splenomegaly in mice bearing SUM-149-COX2 tumors. While 4T1 tumor burden alone induced splenomegaly, tumor COX-2 downregulation only modestly reduced spleen weight (p = 0.16) in BALB/c mice. Figure 2 summarizes the significant spleen metabolite changes in Ctrl and SUM-149 TB mice for (A) glutamine, (B) glutathione, (C) aspartate, (D) myo-inositol and (E) glucose. Figure 3 summarizes spleen metabolite changes in Ctrl and 4T1-TB mice for (A) lactate, (B) alanine, (C) acetate, (D) glutamine, (E) glutathione, (F) aspartate, (G) myo-inositol, (H) glycine, (I) glucose and (J) formate. Heat maps in Figure 4 represent altered spleen metabolites in (A) SCID and (B) BALB/c mice with tumor burden and modulated tumor COX-2 expression. Summarized flow cytometric analyses in Figure 5 depict representative splenic MDSC populations with corresponding graphical representation of splenic MDSCs in (A) SCID and (B) BALB/c mice as a result of tumor burden and tumor COX-2 status.Discussion
We identified a COX-2-dependent increase in glutamine, glutathione and aspartate and a reduction of myo-inositol in the spleens of SUM-149-COX2-bearing SCID mice. Interestingly, 4T1-tumor COX-2 status did not significantly alter spleen metabolism, but 4T1 tumor burden alone resulted in the alteration of the same metabolites as observed in SUM-149-COX2 tumor-bearing mice. COX-2 overexpression in SUM-149 tumors induced splenomegaly while 4T1 COX-2 status did not significantly correlate with changes in spleen weight. COX-2 overexpression in SUM-149 tumors increased splenic MDSC frequency, but 4T1-tumor COX-2 downregulation did not significantly alter splenic MDSCs. Our findings demonstrate that the tumor microenvironment instructs spleen metabolism and cellular repertoire of the spleen, and that COX-2 may be a major determinant in immune suppressed mice but not in immune competent mice. Tumors with high COX-2 expression may result in increased splenic MDSCs and altered splenic metabolism in immune compromised individuals that may contribute to increased cancer aggressiveness.Acknowledgements
Supported by NIH R01CA193365 and R35CA209960.References
1. Kochel J et al., Oncotarget. 2017; 8(4): 6540–6554
2. Thumkeo D et al., Cell Rep. 2022; 39(10):110914.
3. Generali D et al., Br J Cancer. 2014; 111(1): 46–54.
4. Krishnamachary B et al., Oncotarget. 2017;8(11):17981-94.
5. Wu, C et al., Front Immunol. 2020; 11:1126.
Figures
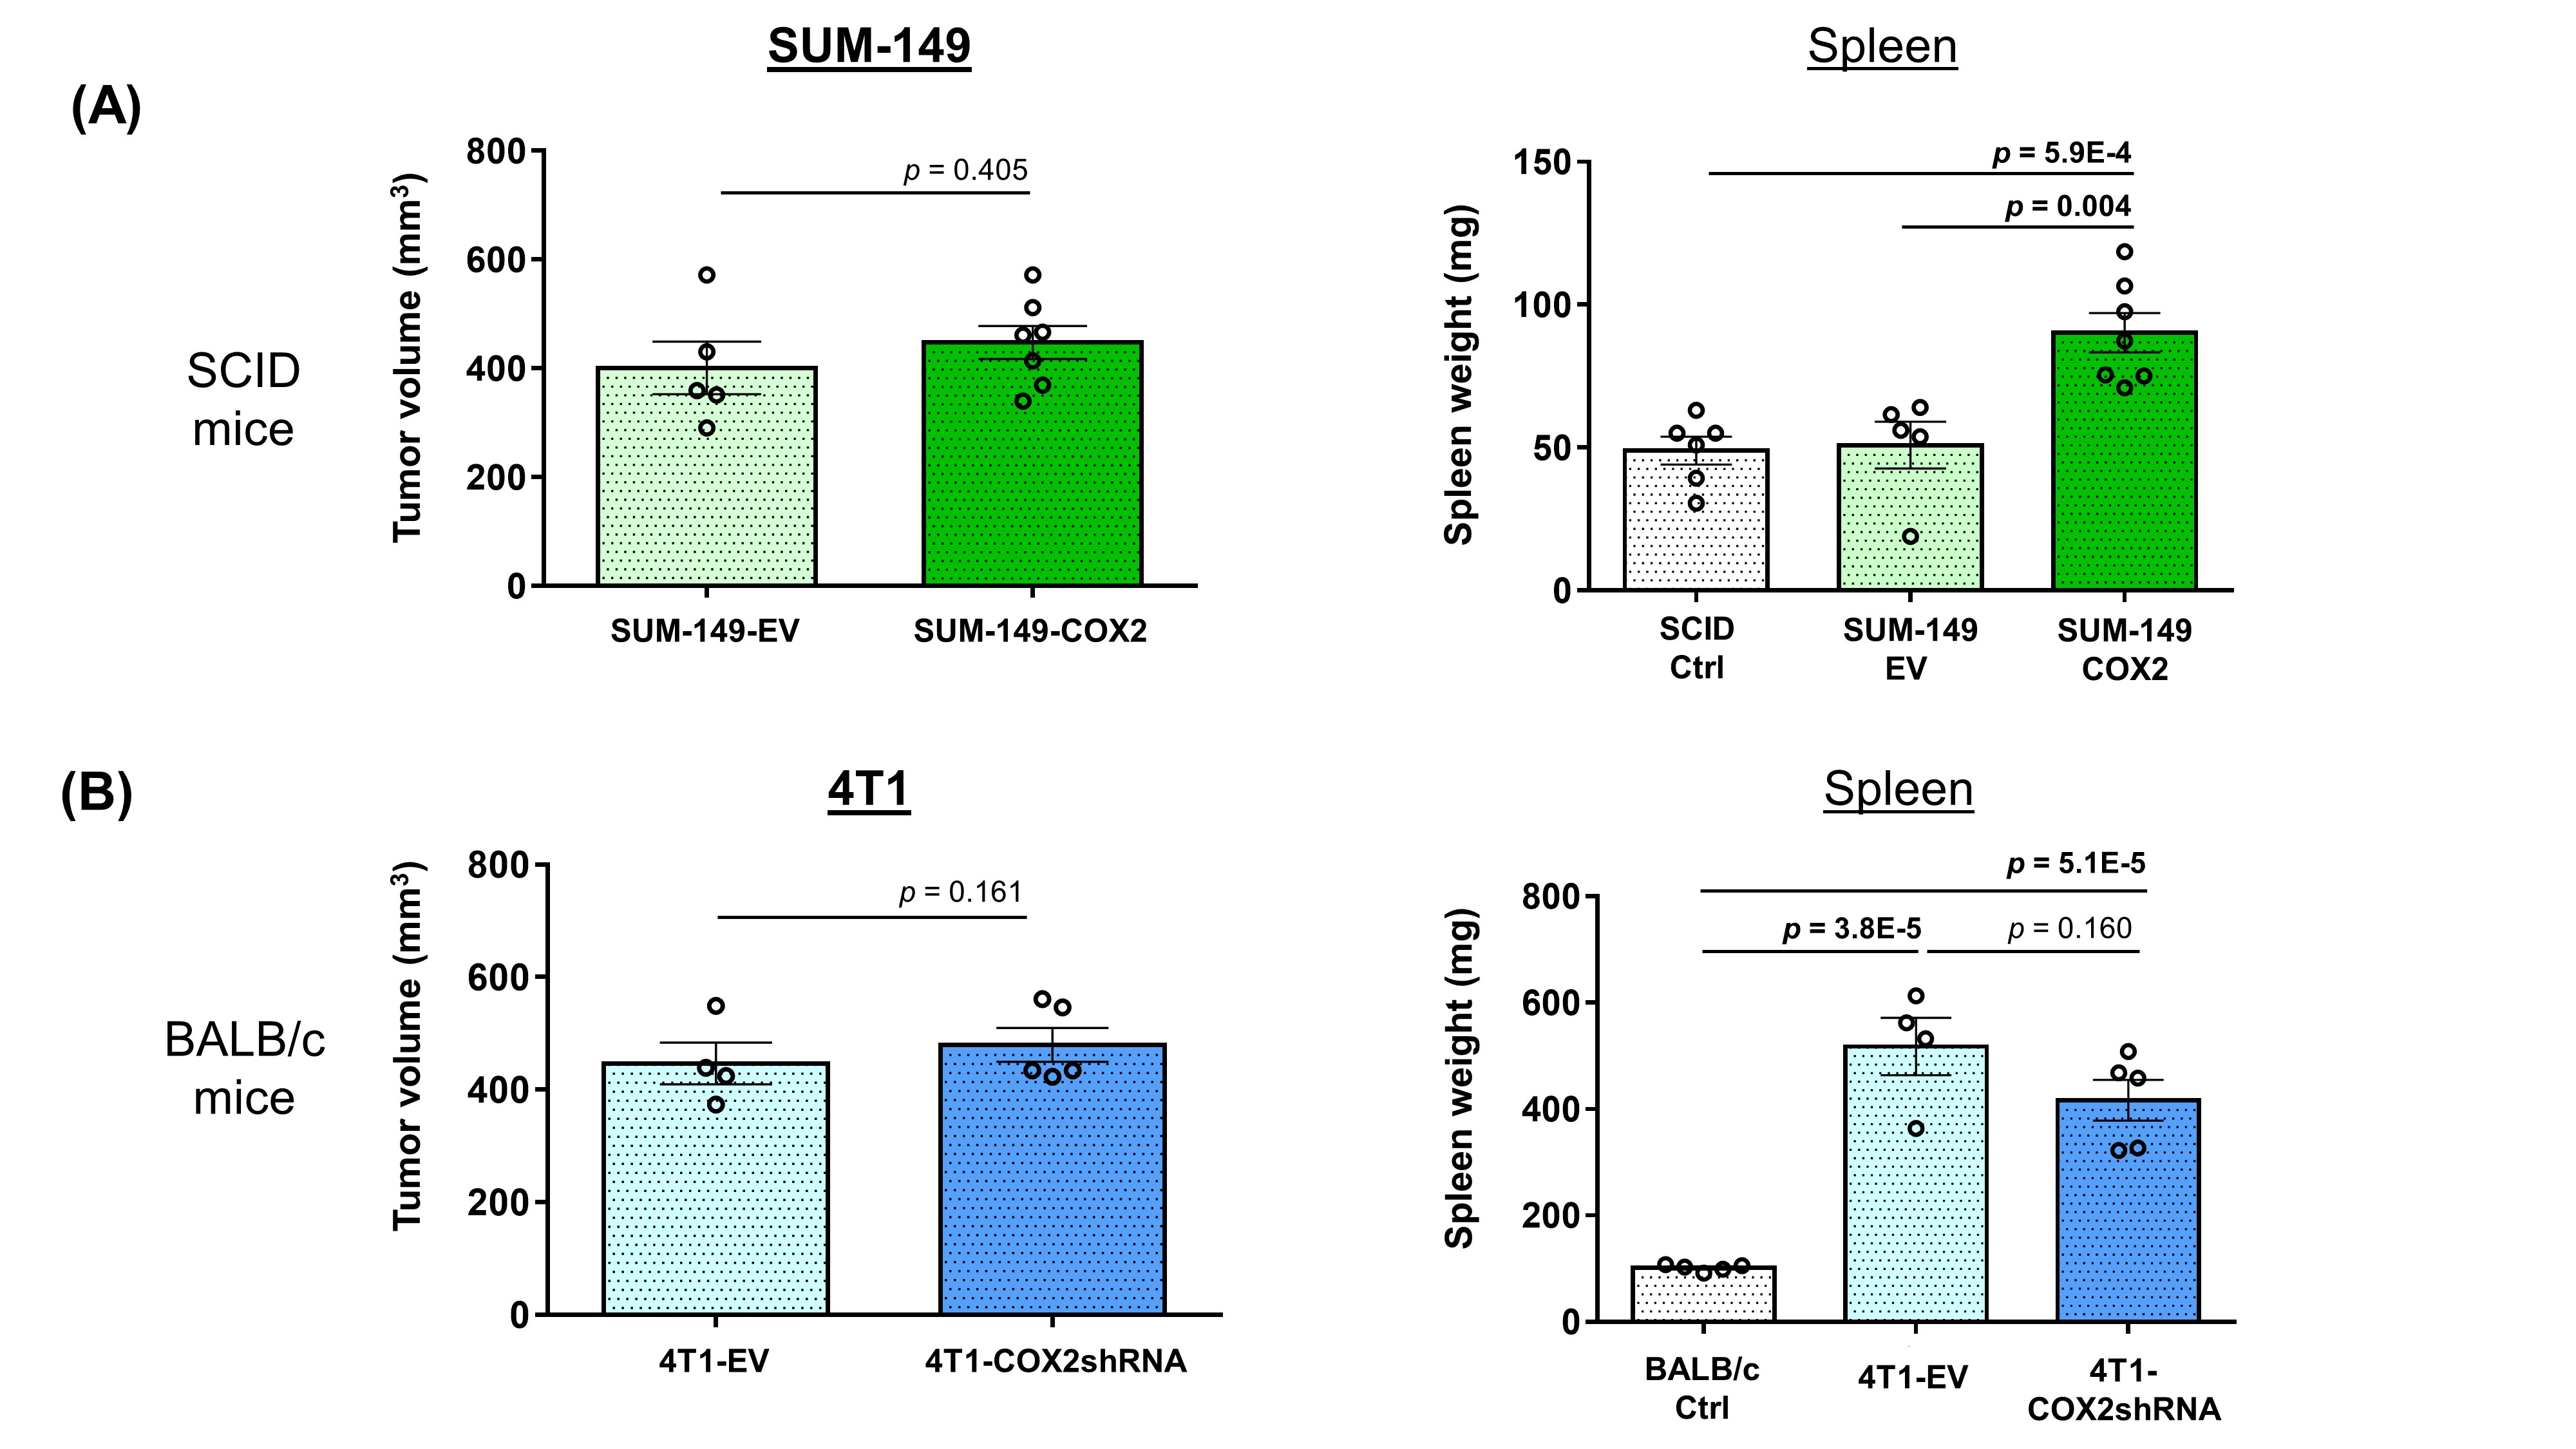
Data summarizing the average tumor volume in (A) SCID mouse groups
SUM-149-EV (n = 5) and SUM-149-COX2 (n = 7) alongside corresponding spleen
weights with non-tumor-bearing SCID control (n = 6), SUM-149-EV (n = 5), SUM-149-COX2 (n = 7) mice
and average tumor volume in (B) BALB/c mouse groups 4T1-EV (n = 4) and
4T1-COX2shRNA (n = 5) alongside corresponding spleen weights of
non-tumor-bearing BALB/c control (n = 5), 4T1-EV (n = 4) and 4T1-COX2shRNA (n =
5) mice. Values represent Mean ± SEM.
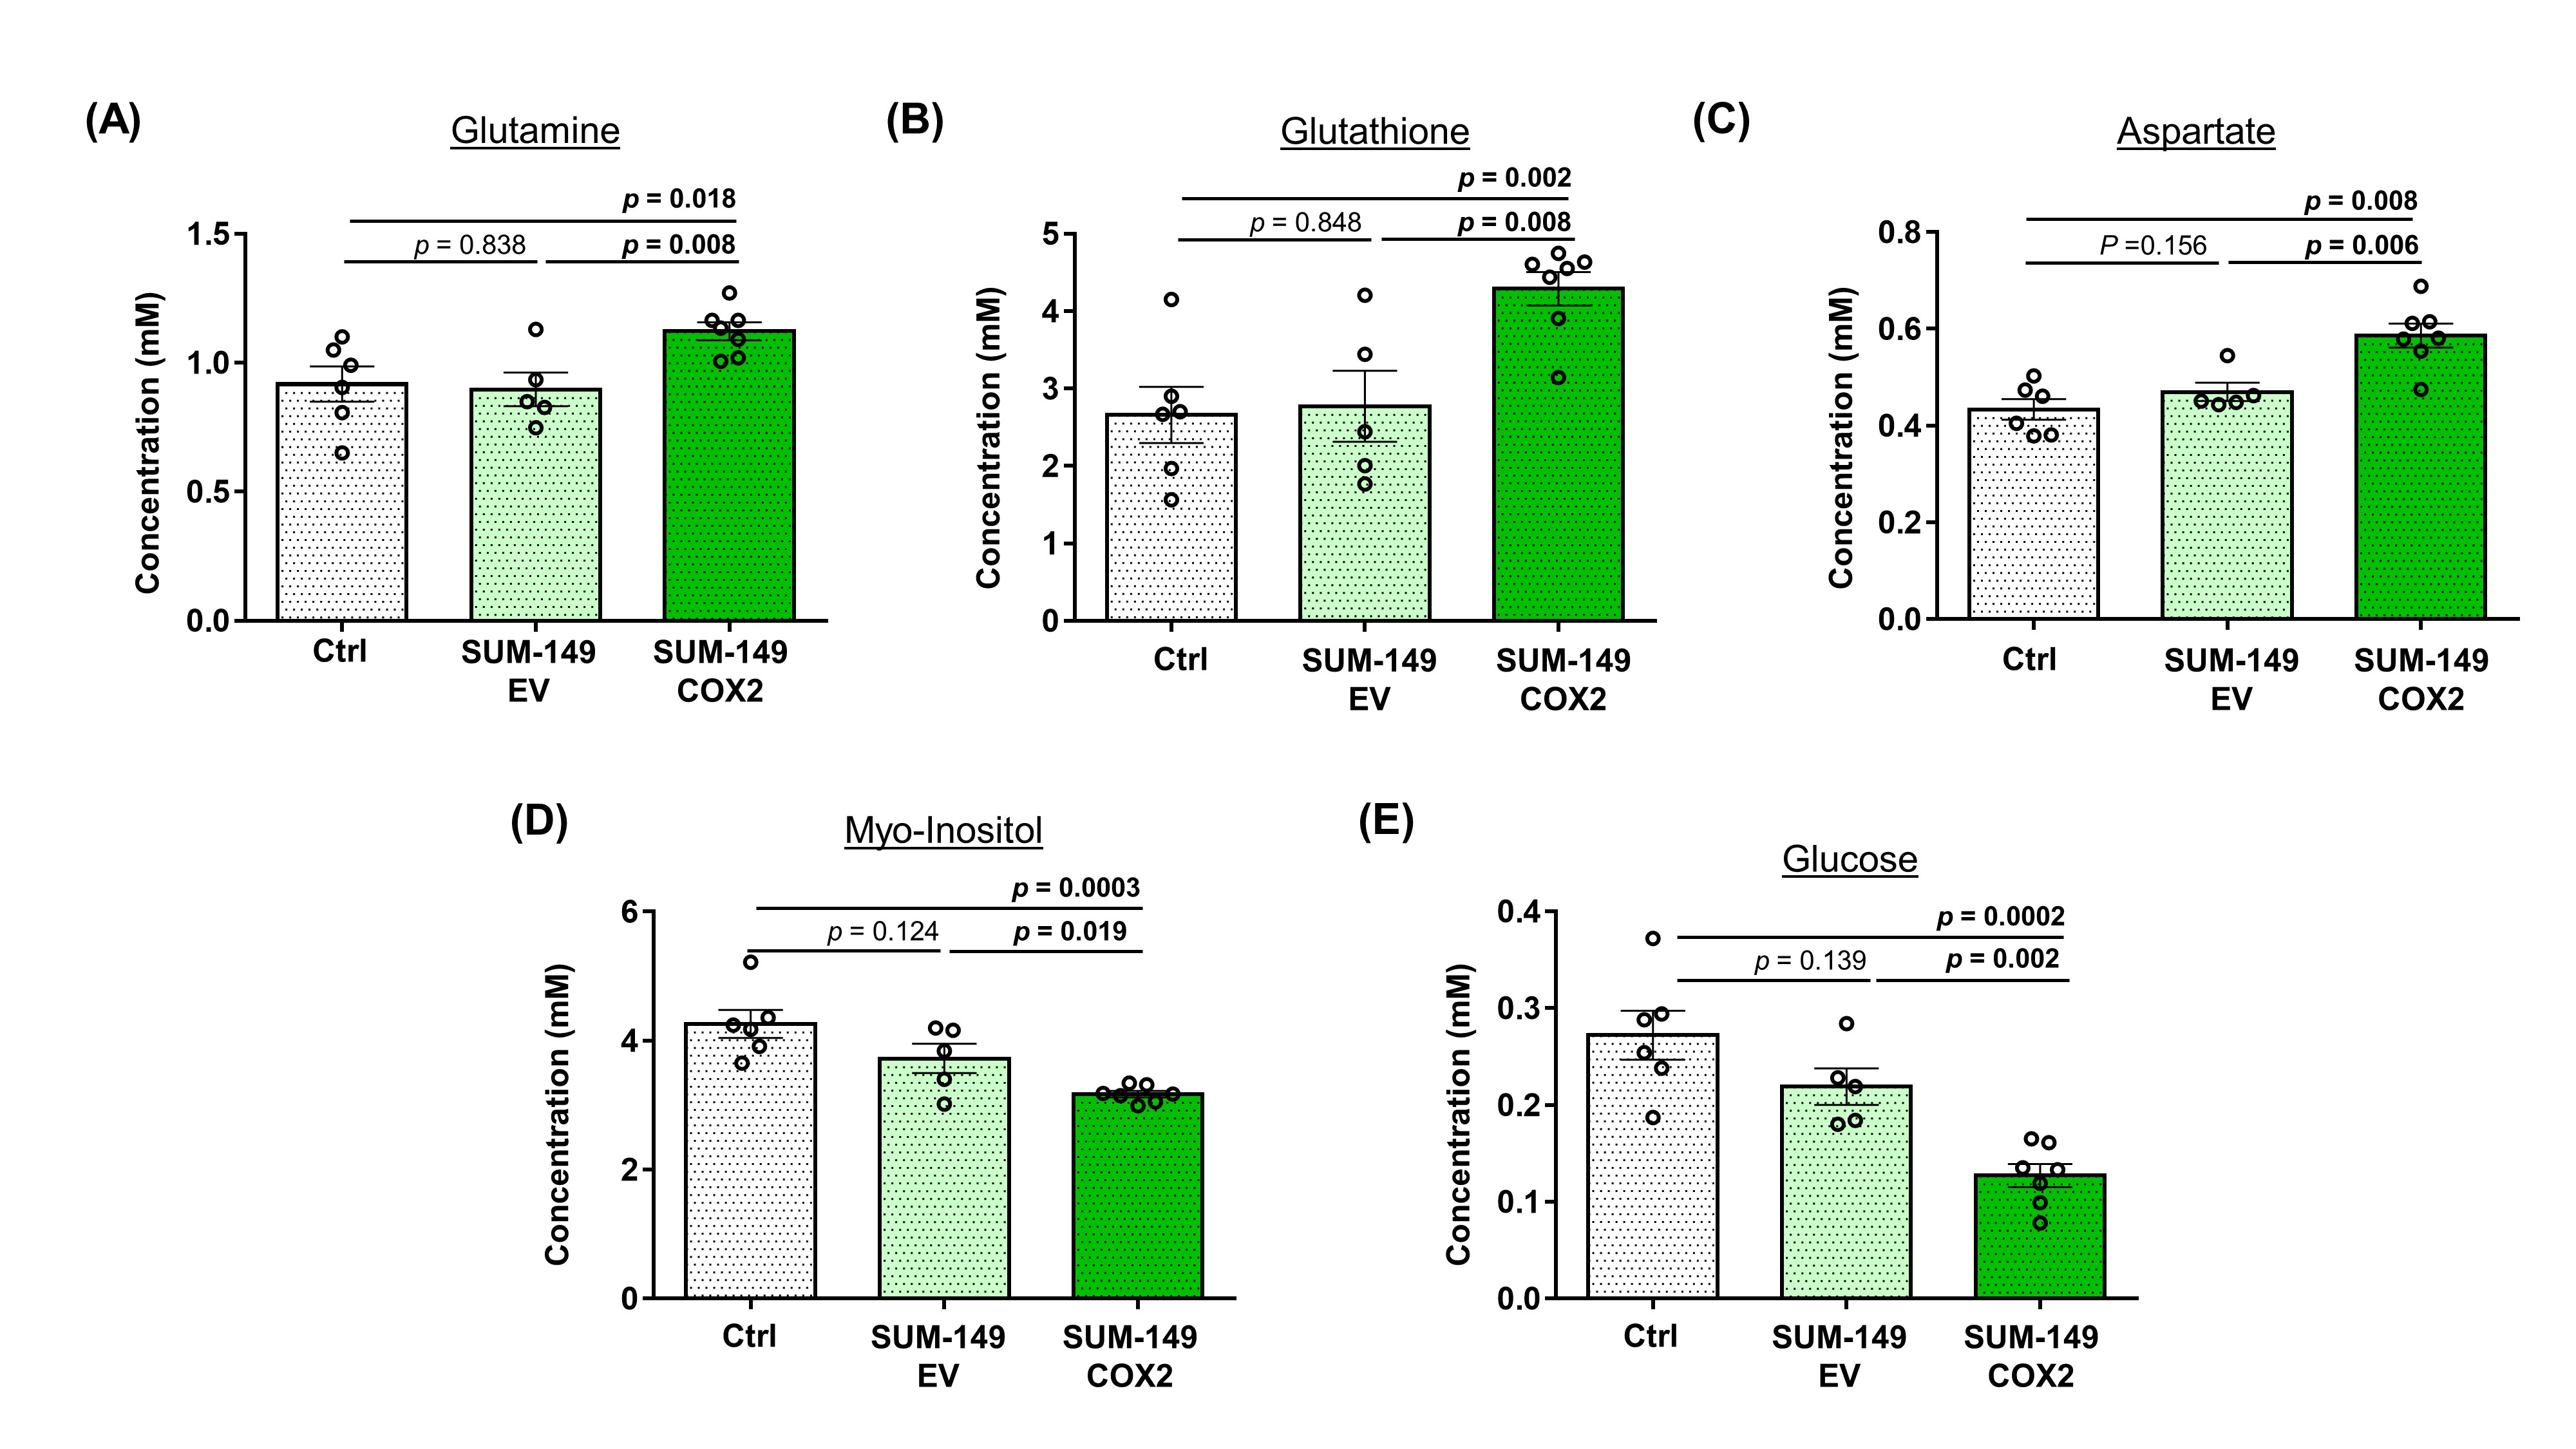
Millimolar
concentrations of significantly altered spleen metabolites in SCID mice from
non-tumor-bearing control (n = 6), SUM-149-EV (n = 5), SUM-149-COX2 (n = 7)
groups illustrated respectively for (A) glutamine, (B) glutathione, (C)
aspartate, (D) myo-inositol and (E) glucose. Values represent Mean ± SEM.
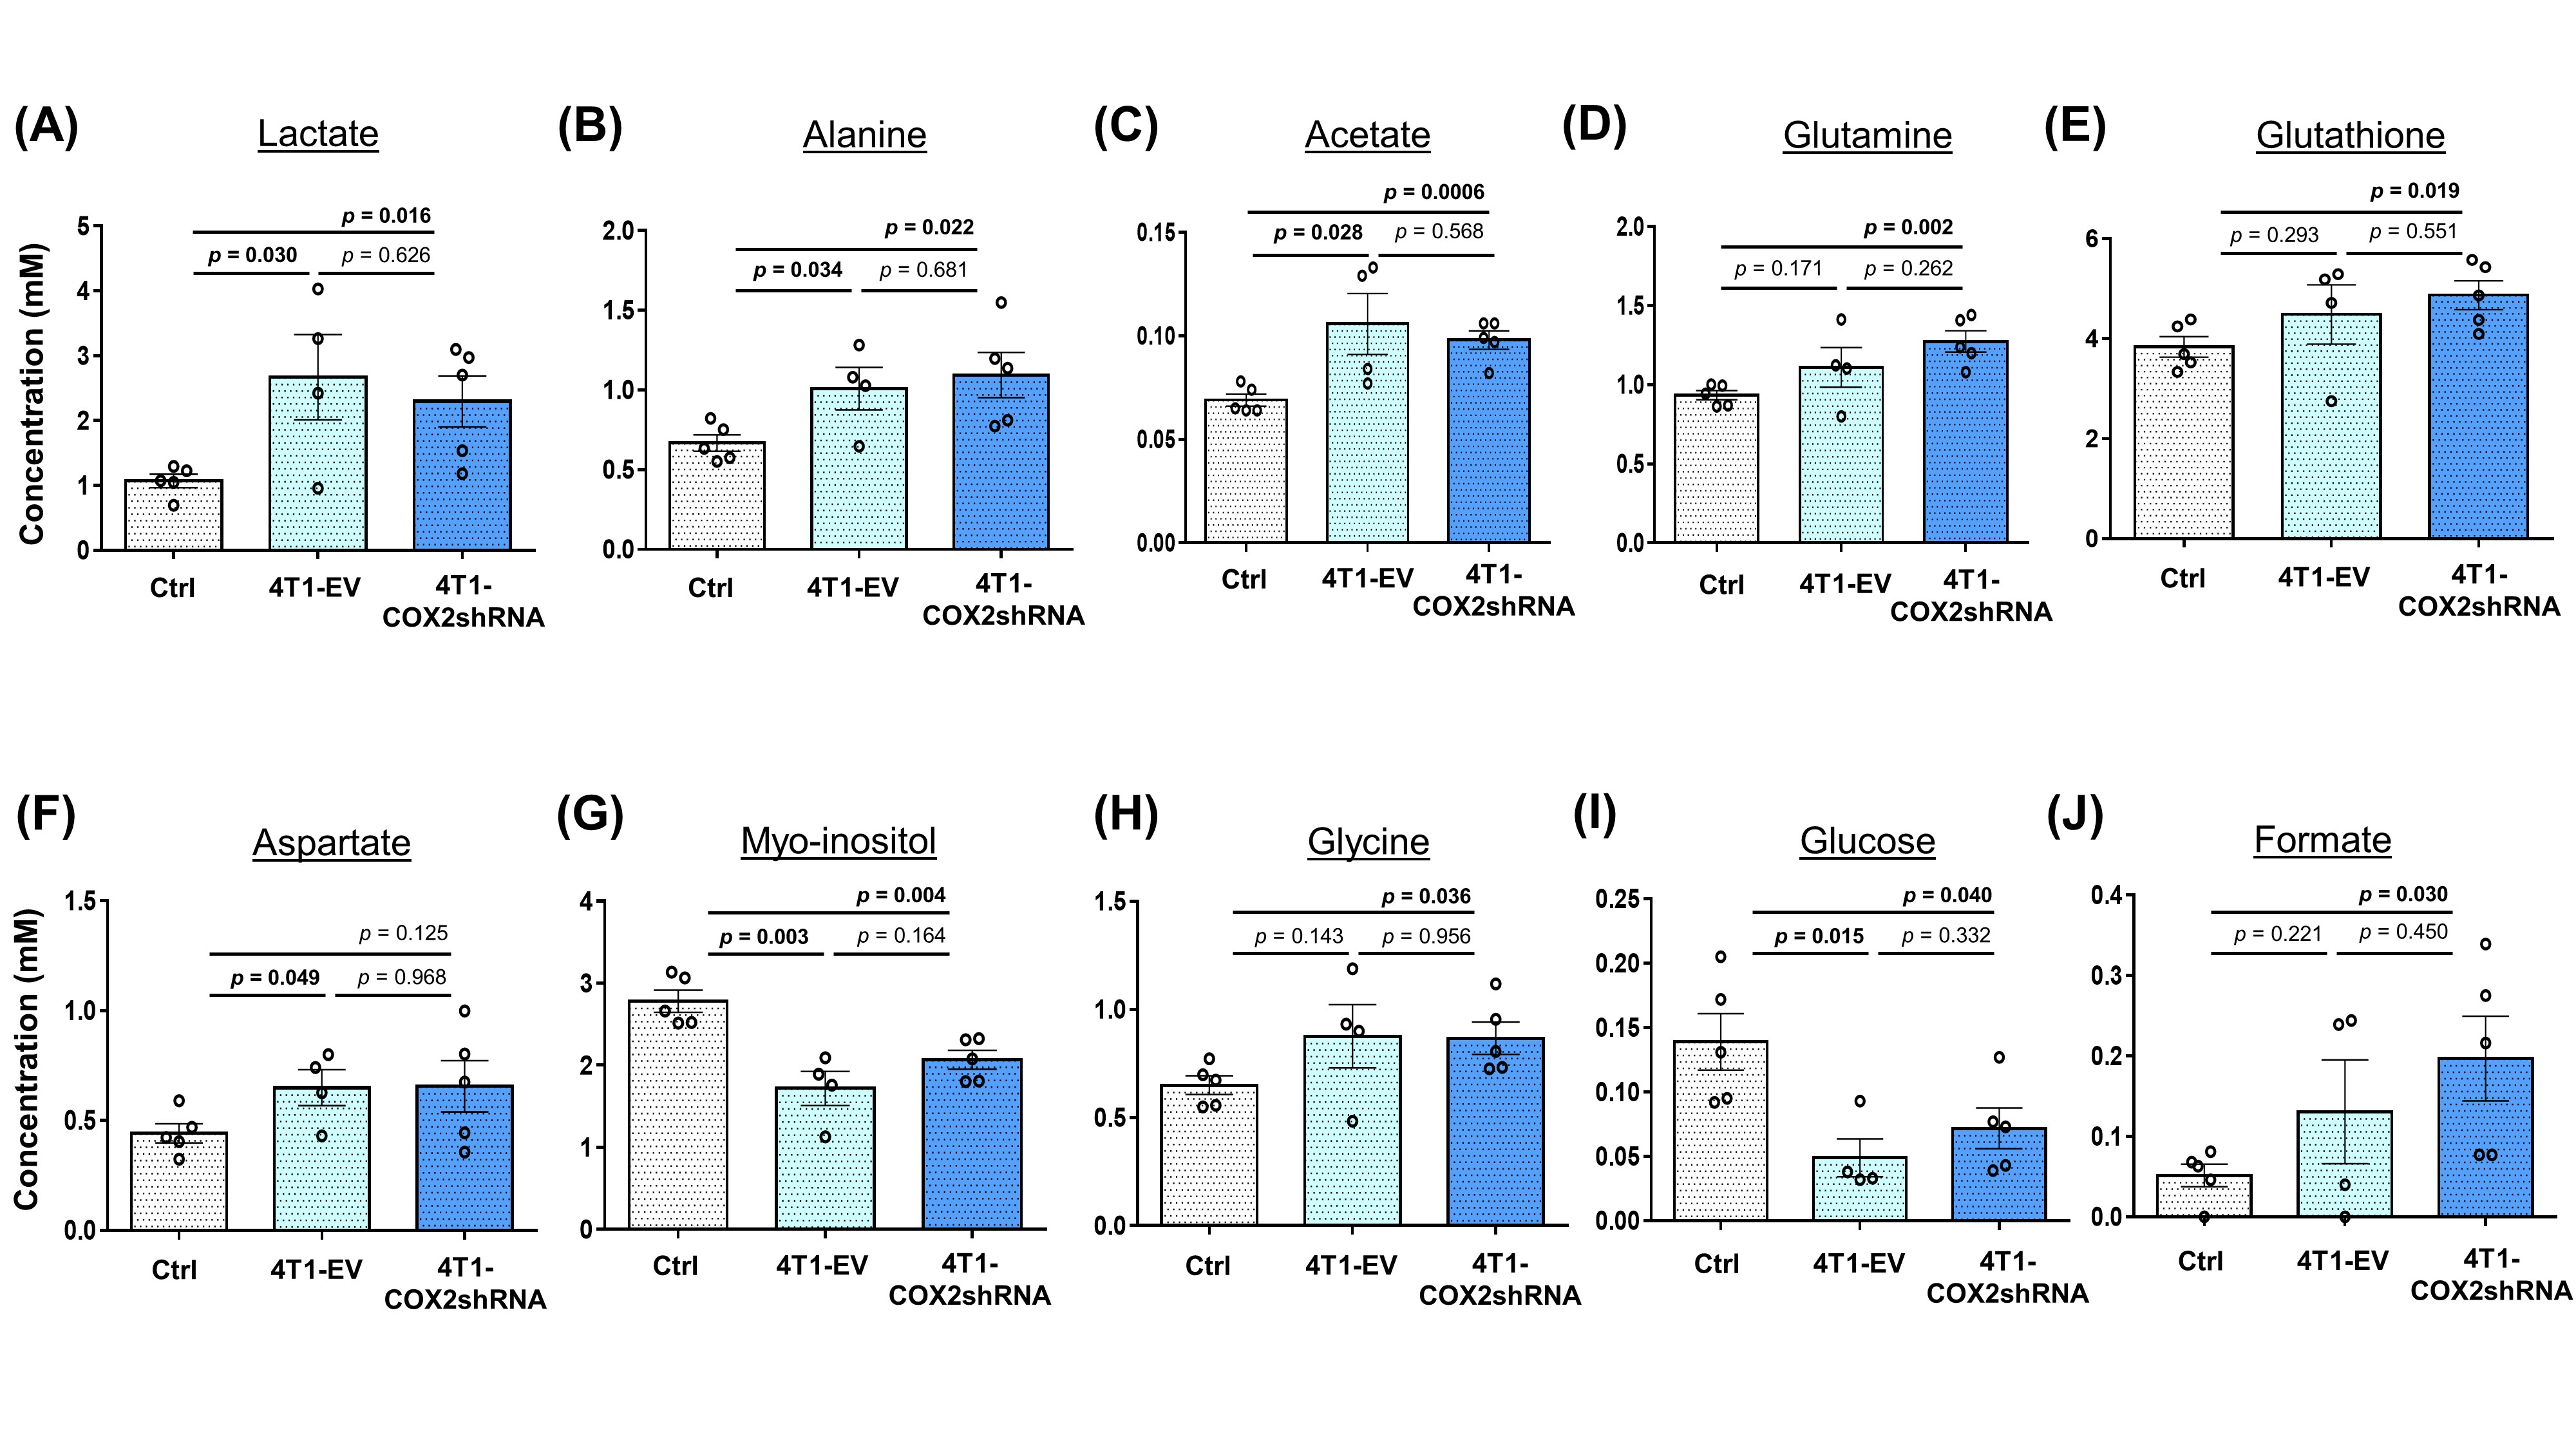
Millimolar
concentrations of significantly altered spleen metabolites in BALB/c mice from
non-tumor-bearing control (n = 5), 4T1-EV (n = 4), 4T1-COX2shRNA (n = 5) groups
illustrated respectively for (A) lactate, (B) alanine, (C) acetate, (D)
glutamine, (E) glutathione, (F) aspartate, (G) myo-inositol, (H) glycine, (I)
glucose and (J) formate. Values represent Mean ± SEM.
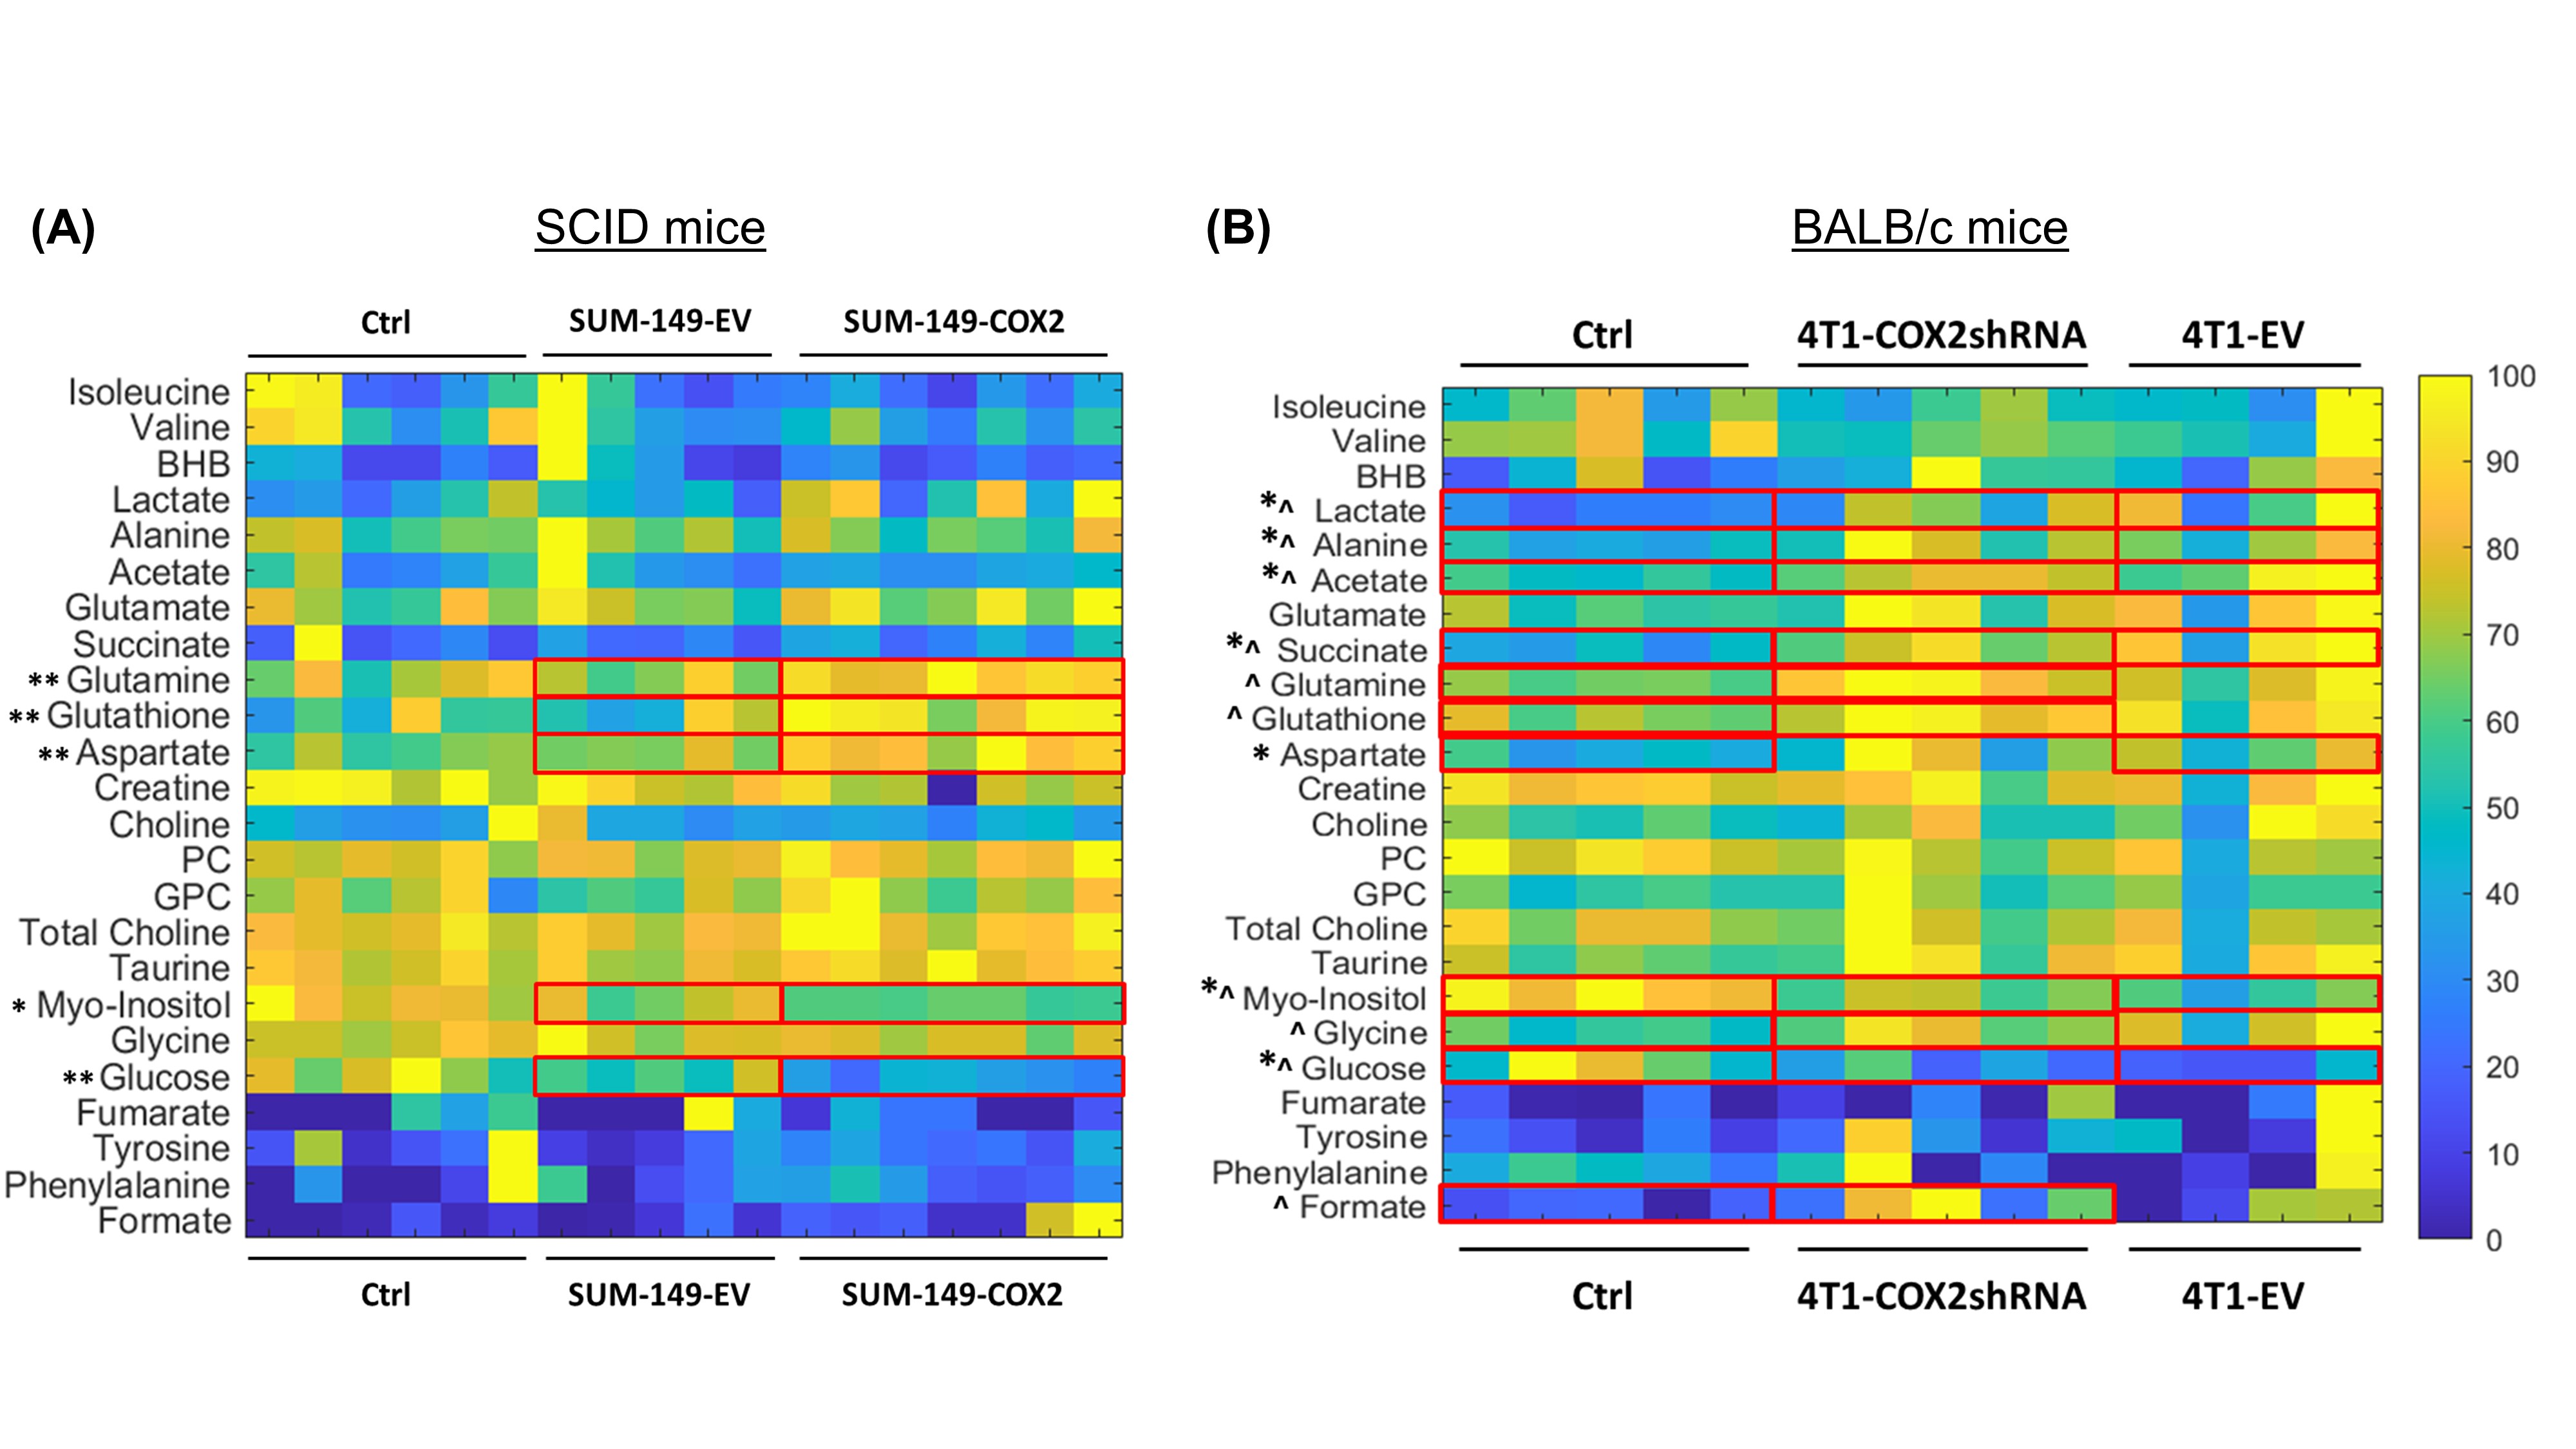
Heat maps of aqueous spleen metabolites from (A) SCID mice with no tumor
(Ctrl, n = 6), SUM-149-EV tumor (n = 5) and SUM-149-COX2 tumor (n = 7).
Two-tailed Student’s t test, *p ≤ 0.05 and **p ≤ 0.01 denote statistical
significance between the SUM-149-EV and SUM-149-COX2 groups; (B) BALB mice with
no tumor (Ctrl, n = 5), 4T1-EV tumor (n = 4) and 4T1-COX2shRNA tumor (n = 5).
Two-tailed Student’s t test, p ≤ 0.05. * denotes Ctrl vs 4T1-EV and ^ denotes Ctrl vs
4T1-COX2shRNA. BHB, beta-hydroxybutyrate; PC, phosphocholine; GPC,
glycerophosphocholine. Red boxes highlight significant metabolites.
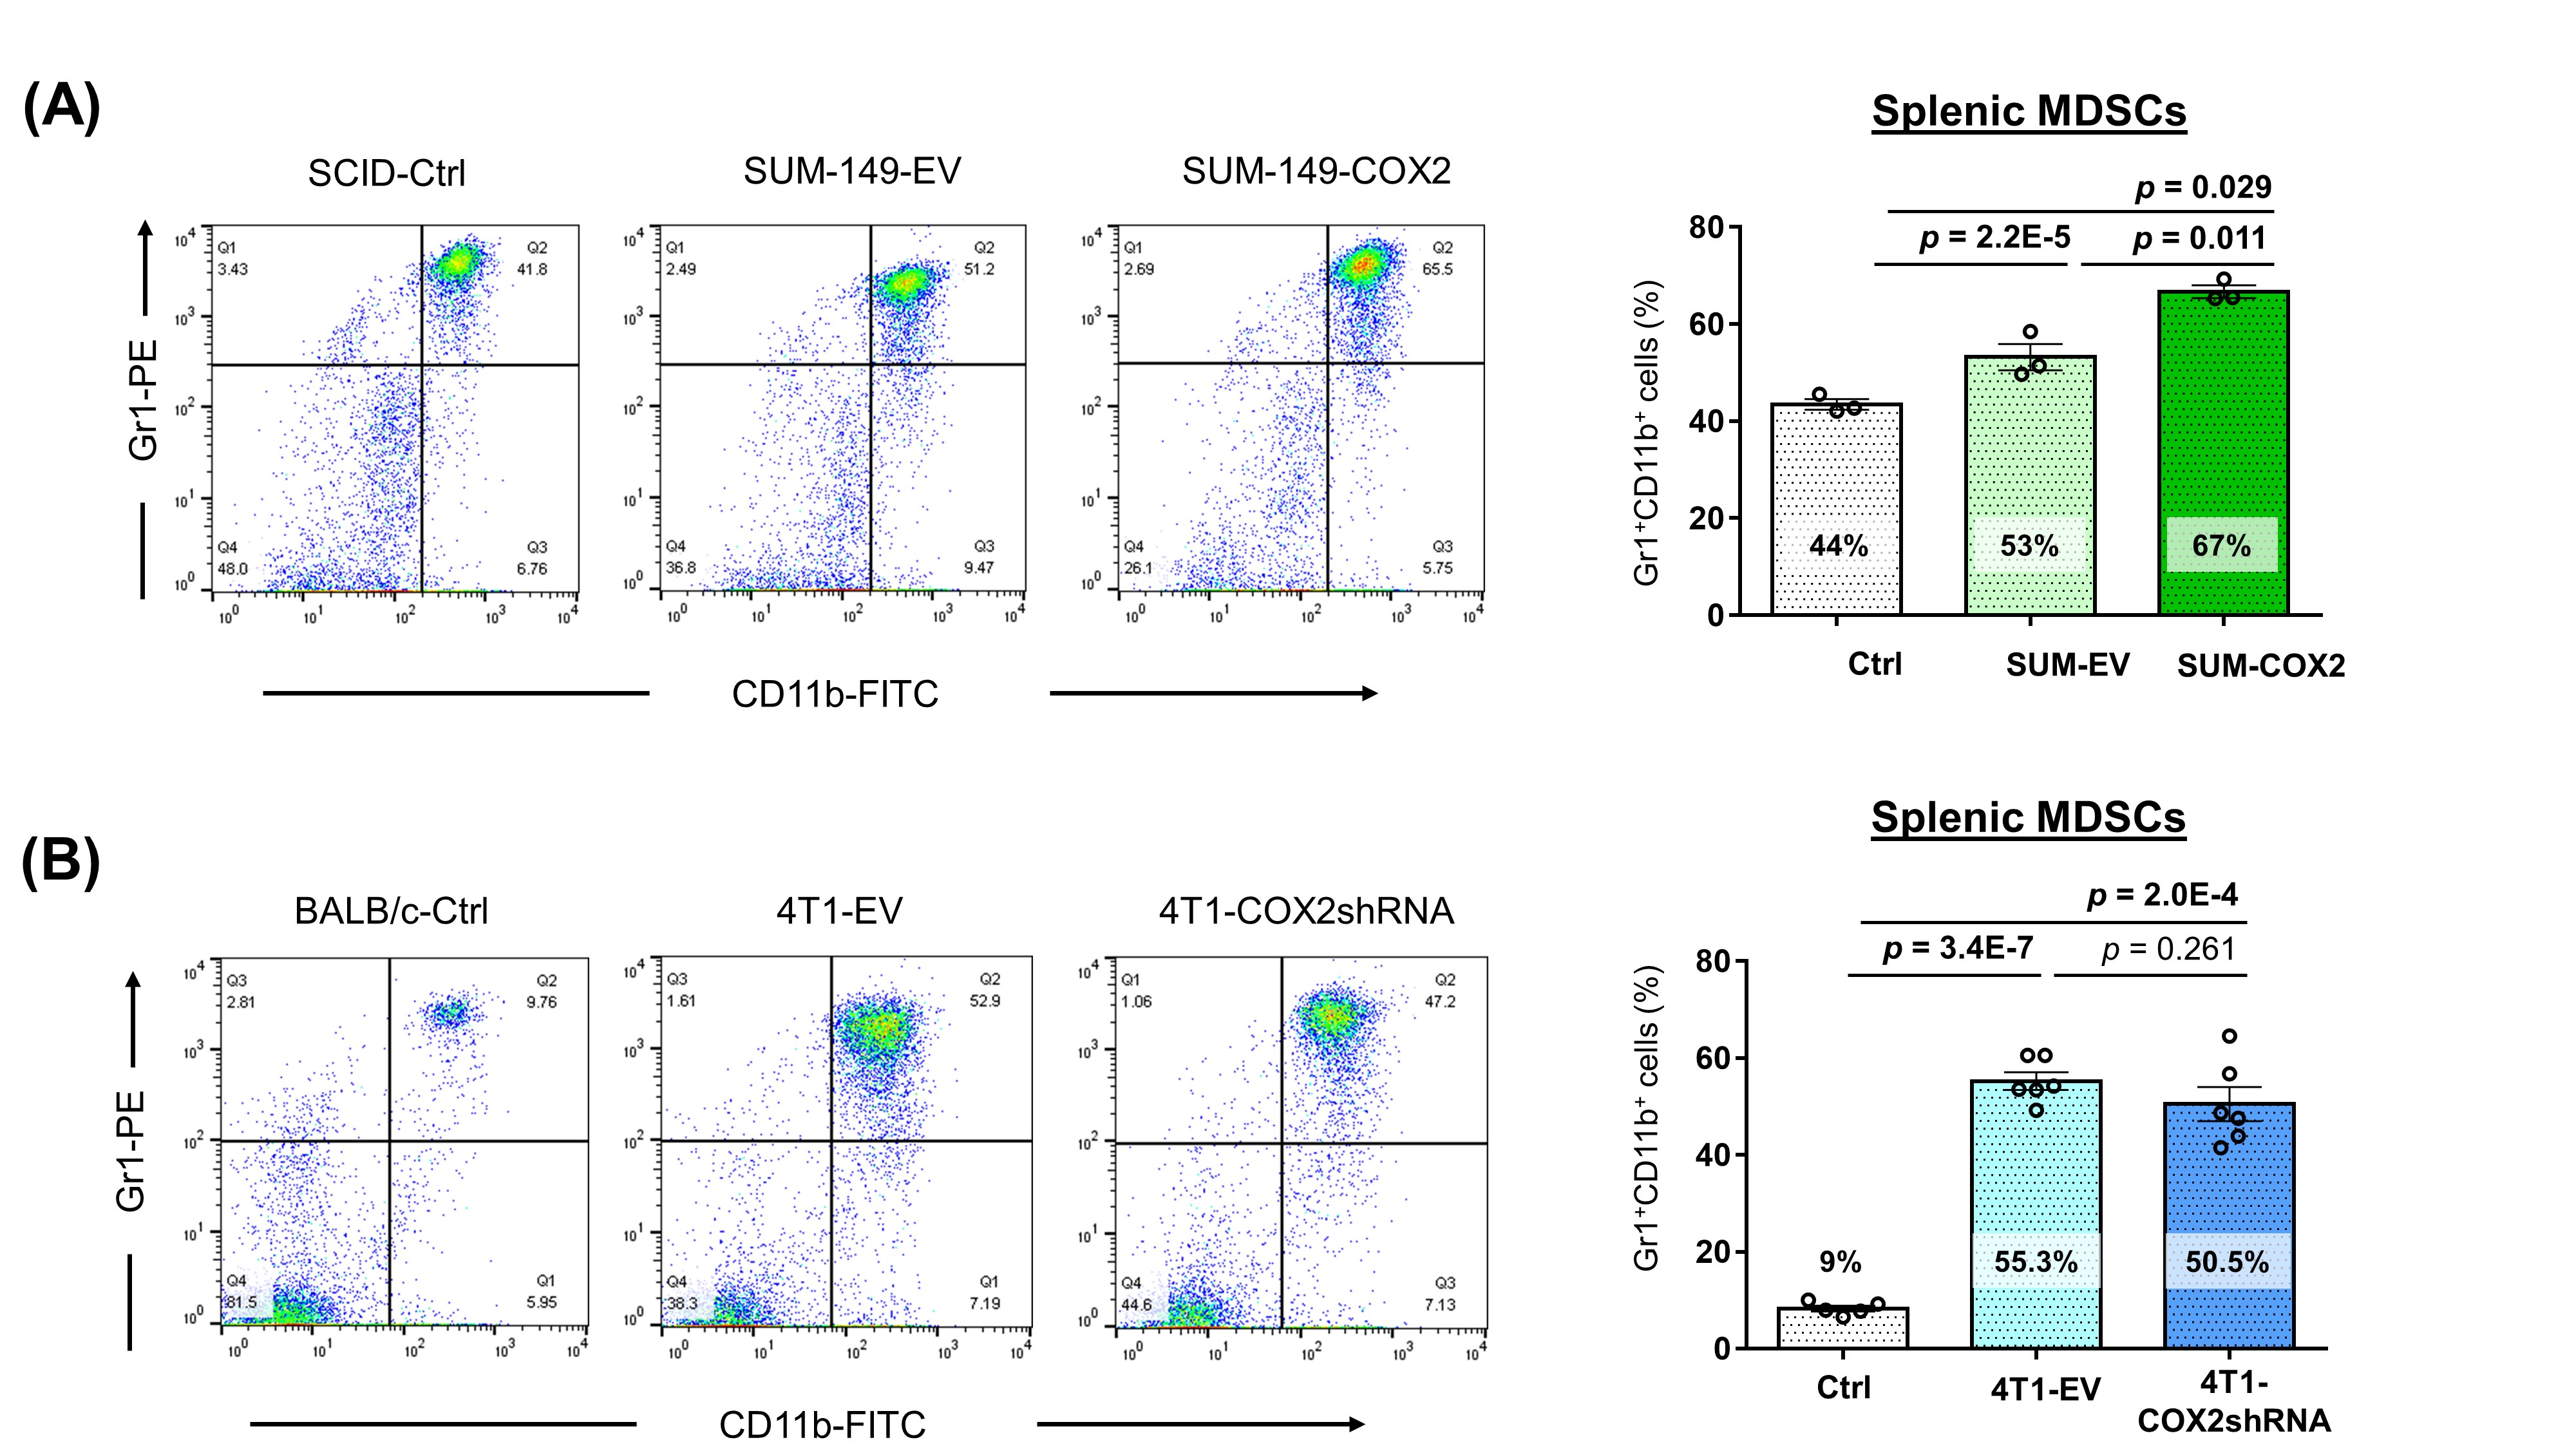
Representative flow cytometric data and corresponding splenic MDSC
frequencies from (A) SCID mice with no tumor (Ctrl, n = 3), SUM-149-EV tumor (n
= 3) and SUM-149-COX2 tumor (n = 3), and BALB/c mice with no tumor (Ctrl, n =
5), 4T1-EV tumor (n = 6) and 4T1-COX2shRNA tumor (n = 6). ). Two-tailed
Student’s t test, statistical significance with p value ≤ 0.05.
DOI: https://doi.org/10.58530/2023/1665