1664
Multi-nuclear 1H and 23Na MRI investigation of fibroadipose tissue sodium in patients with secondary lymphedema1Biomedical Engineering, Vanderbilt University, Nashville, TN, United States, 2Radiology and Radiological Sciences, Vanderbilt University Medical Center, Nashville, TN, United States, 3Neurology, Vanderbilt University Medical Center, Nashville, TN, United States, 4Biostatistics, Vanderbilt University Medical Center, Nashville, TN, United States, 5Obstetrics and Gynecology; Division of Gynecologic Oncology, Vanderbilt University Medical Center, Nashville, TN, United States, 6Physical Medicine and Rehabilitation, Vanderbilt University Medical Center, Nashville, TN, United States, 7Dayani Center for Health and Wellness, Vanderbilt University Medical Center, Nashville, TN, United States, 8Psychiatry and Behavioral Sciences, Vanderbilt University Medical Center, Nashville, TN, United States
Synopsis
Keywords: Cancer, Non-Proton, lymphedema, fibrosis, sodium, inflammation, adipose, lymph
Advanced-stage lymphedema is a disease of chronic fluid accumulation and tissue inflammation that results in fibrosis and subcutaneous fat expansion in affected limbs. Assessment of fat and fibrosis currently relies on biopsies or non-specific bedside measures. Noninvasive MRI could be important for understanding pathophysiology and evaluating emerging therapies. We cross-sectionally evaluated multi-nuclear proton and sodium MRI in patients with lower-extremity secondary lymphedema. Results reveal subcutaneous adipose tissue expansion throughout the affected calf, locoregional fibrosis, and elevated sodium content in fibroadipose tissues particularly in the anterior calf, thereby highlighting the relevance of these technologies for interrogating tissue health in lymphedema.
Introduction
Secondary lymphedema is a debilitating chronic disease whereby lymphatic insufficiency due to lymph node removal causes fluid accumulation and limb swelling, and eventual soft tissue changes1. Prolonged lymph stasis in advanced disease induces a chronic inflammatory state leading to a cyclical progression of fibrosis, adipose expansion, and further lymphatic impairment2,3.Much research on adipose tissue pathology in lymphedema has been performed in animal models or clinical tissue biopsies4. Noninvasive MRI could be an important in vivo tool for probing fibroadipose tissue pathology and potentially to guide therapy development and implementation5. Fibrosis is discernible on T1-weighted MRI, yet such anatomical imaging is largely insensitive to inflammation which may adjust before and after treatments. Sodium imaging (23Na-MRI) has gained recent attention and has sensitivity to many inflammatory disease processes6. Combining 1H/23Na-MRI to study lymphedema could help localize fibrosis and interrogate the inflammatory tissue environment associated with disease progression.
We apply proton and sodium 1H/23Na-MRI in a preliminary cohort of patients with advanced secondary lower extremity lymphedema (LEL) with unilateral disease. We test the hypotheses that (1) subcutaneous adipose tissue (SAT) volume is elevated in affected compared to contralateral legs, forming distinct patterns of fibrosis, and (2) fibroadipose tissue has elevated sodium content compared to surrounding non-fibrosed tissue.
Methods
All participants provided informed consent in accordance with the local Institutional Review Board. Patients with secondary LEL were enrolled from a lymphedema therapy clinic who met inclusion criteria of i) pelvic or inguinal lymph node removal for cancer therapy or hysterectomy procedures, ii) unilateral disease, and iii) no history of kidney disease or conditions affecting sodium handling. The affected limb LEL stage was evaluated by a certified physical therapist according to International Society of Lymphology criteria2.MRI Acquisitions.
Participants were scanned supine at 3T (Philips Healthcare; Best, The Netherlands) using the body coil for radiofrequency transmission/reception in 1H-MRI acquisitions and a single-tuned receive-only quadrature sodium coil (Rapid Biomedical GmbH; Rimpar, Germany) for 23Na-MRI acquisitions. Both legs were scanned independently, with the mid-gastrocnemius calf muscle at the isocenter (Figure 1a).
We utilized a multi-nuclear MRI protocol7,8 in the lower extremities. The two-point Dixon water-fat method (TR=100ms, TE1/TE2=1.19/2.37ms, in-plane resolution=1x1mm2, slice thickness=6mm) provided separate water- and fat-weighted contrasts in the transverse plane (Figure 1b). 23Na-MRI was acquired in the same field-of-view as Dixon MRI, using a 3D gradient-echo sequence with minimal echo time (TR=130ms, TE=0.99ms, in-plane resolution=3x3mm2, slab thickness=30mm, number signal acquisitions=26) (Figure 1c).
Imaging and statistical analyses.
Affected legs with lymphatic impairment were determined to have radiologically-evident fibrosis; contralateral limbs without evidence of fibrosis are considered an internal control.
To evaluate hypothesis 1, SAT was segmented manually from fat-weighted Dixon images of both limbs. Within the SAT, a Gaussian mixture model was used to identify hyperintense regions on water-weighted images corresponding to SAT fibrosis. Cross-sectional slices were partitioned into equiangular quadrants around the centroid of the SAT mask, approximately corresponding to the following anatomical regions: anterior, posterior, lateral, and medial (Figure 1d). SAT volume (mL) in each quadrant was compared between affected and contralateral legs using a Wilcoxon signed-rank test. Fibrosis extent (fibrosis volume/SAT volume, %) was evaluated between quadrants in the affected leg of patients with lymphedema using the Kruskal-Wallis test with Dunn’s post-hoc test.
Tissue sodium content (TSC) maps were calculated by calibrating signal intensity of 23Na-MRI from standard sodium concentrations using linear interpolation7. Mean TSC in each quadrant was compared in the affected vs. contralateral legs using the Kruskal-Wallis test. To evaluate hypothesis 2, TSC in fibroadipose tissue, surrounding non-fibrosed adipose tissue, and contralateral SAT were compared pairwise by Wilcoxon signed-rank tests.
All statistical tests were considered significant at the two-sided P≤0.05 level.
Results
The cohort consisted of seven participants with unilateral secondary leg lymphedema (age=56.4±8.6 years, BMI=28.3±6.1 kg/m2, LEL stage=2 or 3). SAT volume was significantly higher in affected limbs compared to contralateral limbs (Table 1). Fibrosis extent was highest in the anterior calf (Table 2) and significantly elevated in the anterior compared to posterior region (P=0.009).TSC was also significantly higher in the anterior compared to the posterior region of the affected limb (P=0.014, Table 2). Fibroadipose tissue segmentations has elevated TSC (mean ± standard deviation=54.11±13 mmol/L) compared to surrounding non-fibrosed adipose tissue (25.36±11 mmol/L, P=0.016) and contralateral leg SAT (14.21±4 mmol/L, P=0.016, Figure 2).
Fibrosis and sodium deposition patterns prominent in the anterior SAT in the calf are visualized in a representative patient with LEL (Figure 3).
Discussion
This work expanded upon existing MRI studies of secondary lymphedema fat and fibrosis pathology, by utilizing regional analysis and incorporating multi-nuclear 1H/23Na MRI5,9. Together, quantitative imaging revealed remarkably high tissue sodium in specific regions of fibrosis within the lower-extremity SAT expansion in participants with advanced LEL. Locoregional fibrosis formation and sodium deposition, with prominence to the anterior region, appear consistent with anterior lymphatic drainage pathways 3,10. Further multi-modal imaging using MR lymphangiography could help interrogate these lymphatic pathways potentially corresponding to tissue sodium and fibrosis.5,11.Conclusion
Multi-nuclear proton and sodium MRI demonstrated SAT fibrosis and high tissue sodium deposition in advanced stage LEL. Findings are useful for understanding lymphatic disease pathophysiology, but also may provide a much-needed imaging biomarker of lymphedema.Acknowledgements
Funding was provided by the National Institutes of Health (NIH)/NINR 1R01NR015079, the NIH/NHLBI 1R01HL157378, NIH/NHLBI 1R01HL155523. Imaging experiments were performed at the Vanderbilt Human Imaging Core, using research resources supported by the NIH grant 1S10OD021771-01. We are grateful for Philips support from Charles Nockowski and Ryan Robison, and to Human Imaging Core MRI technologists. Recruitment through www.ResearchMatch.org and services at the Clinical Research Center are supported by the National Center for Advancing Translational Sciences (NCATS) Clinical Translational Science Award (CTSA) Program, award number 5UL1TR002243-03. The content is solely the responsibility of the authors and does not necessarily represent the official views of the NIH.References
1. Rockson SG. Lymphedema. Am. J. Med. 2001;110(4):288-295.
2. Executive Committee of the International Society of Lymphology. The diagnosis and treatment of peripheral lymphedema: 2020 Consensus Document of the International Society of Lymphology. Lymphology. 2020;53(1):3-19.
3. Zampell JC, Aschen S, Weitman ES, et al. Regulation of adipogenesis by lymphatic fluid stasis: part I. Adipogenesis, fibrosis, and inflammation. Plast. Reconstr. Surg. 2012;129(4):825-834.
4. Azhar SH, Lim HY, Tan B-K, et al. The Unresolved Pathophysiology of Lymphedema. Front. Physiol. 2020;11.
5. Crescenzi R, Donahue PMC, Garza M, et al. Subcutaneous Adipose Tissue Edema in Lipedema Revealed by Noninvasive 3T MR Lymphangiography. J Magn. Reson. Imaging. 2022.
6. Madelin G & Regatte RR. Biomedical applications of sodium MRI in vivo. J Magn. Reson. Imaging. 2013;38(3):511-529.
7. Crescenzi R, Marton A, Donahue PMC, et al. Tissue Sodium Content is Elevated in the Skin and Subcutaneous Adipose Tissue in Women with Lipedema. Obesity (Silver Spring). 2018;26(2):310-317.
8. Kopp C, Linz P, Dahlmann A, et al. 23Na magnetic resonance imaging-determined tissue sodium in healthy subjects and hypertensive patients. Hypertension. 2013;61(3):635-640.
9. Borri M, Gordon KD, Hughes JC, et al. Magnetic Resonance Imaging-Based Assessment of Breast Cancer-Related Lymphoedema Tissue Composition. Invest. Radiol. 2017;52(9):554-561.
10. Sumai H & Scaglioni MF. Anatomy of the Lymphatic System and the Lymphosome Concept with Reference to Lymphedema. Semin. Plast. Surg. 2018;32(1):5-11.
11. Mills M, van Zanten M, Borri M, et al. Systematic Review of Magnetic Resonance Lymphangiography From a Technical Perspective. J Magn. Reson. Imaging. 2021;53(6):1766-1790.
Figures
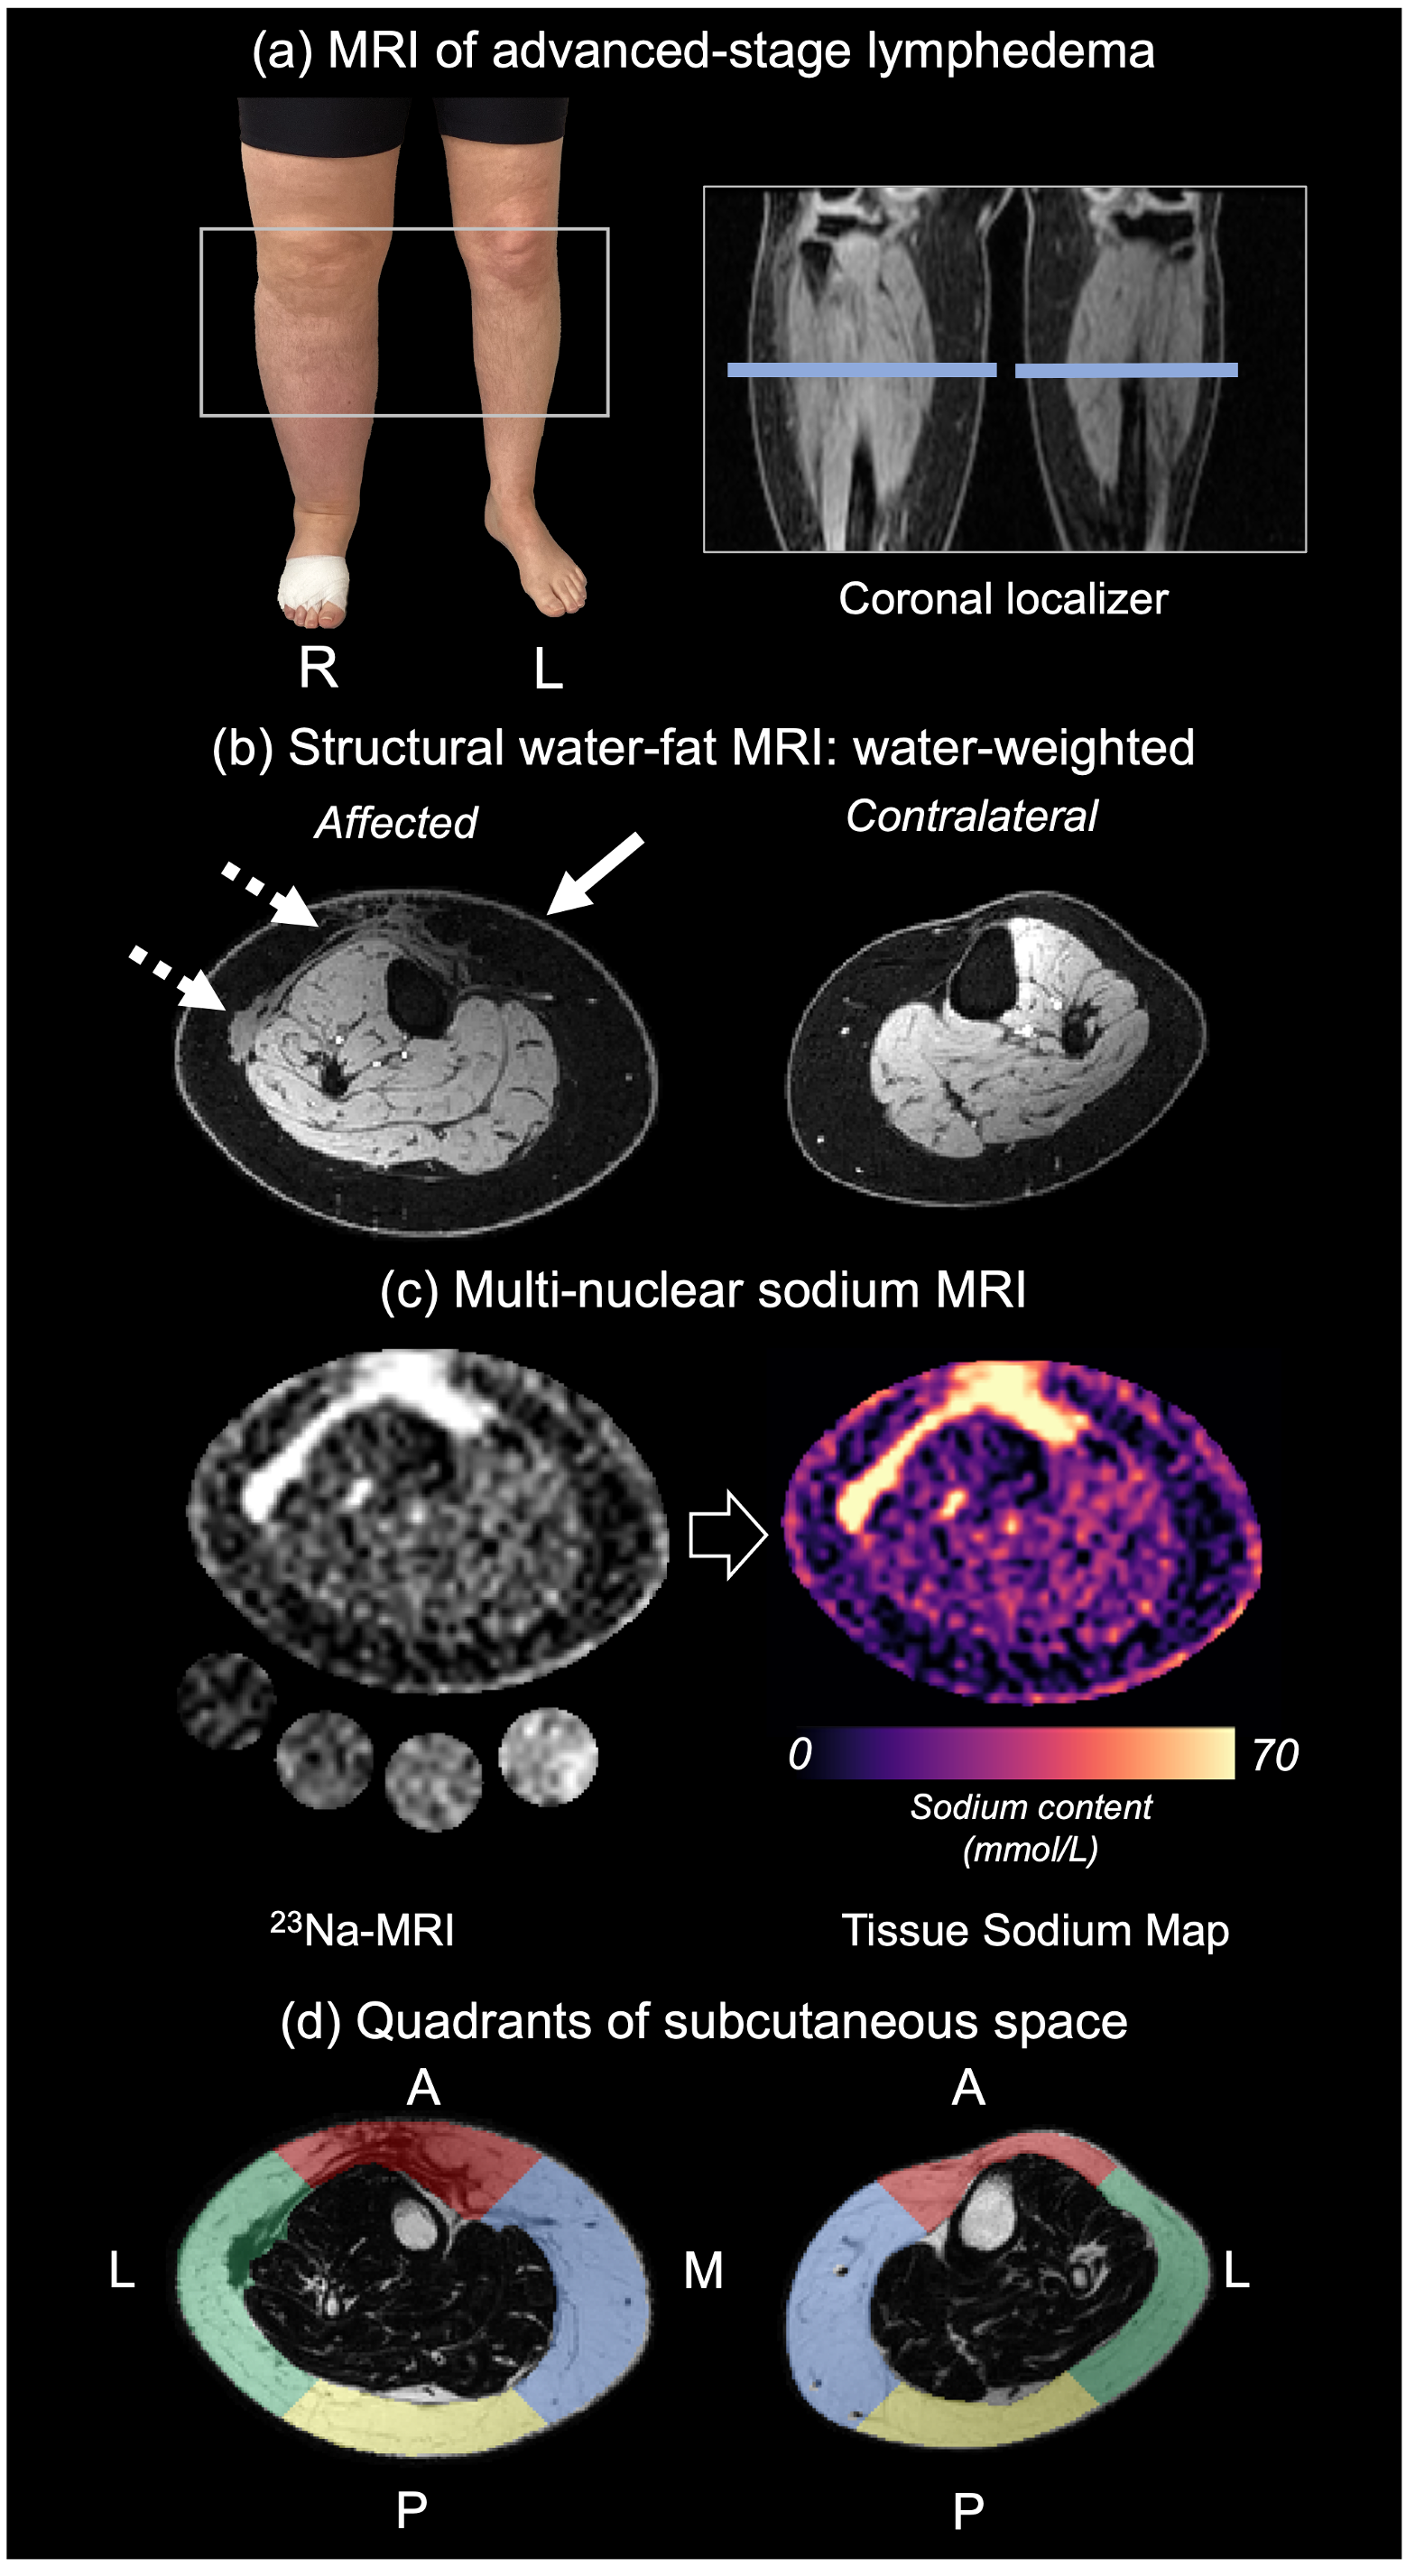
Figure 1. 1H/23Na MRI in lymphedema. (a) Patient with advanced secondary lymphedema of the right leg. The leg affected by lymphedema and the contralateral leg were scanned at the mid-calf. Dixon water-fat MRI (b) and sodium MRI (c) were performed in the same field of view for co-localization of relevant features. Sodium maps were calculated from 23Na-MRI. Subcutaneous adipose tissue masks were split into approximate anatomical quadrants (d): anterior (A), posterior (P), lateral (L), medial (M). Fat expansion (solid arrow) and fibrosis (dashed arrow) are evident in the affected limb.
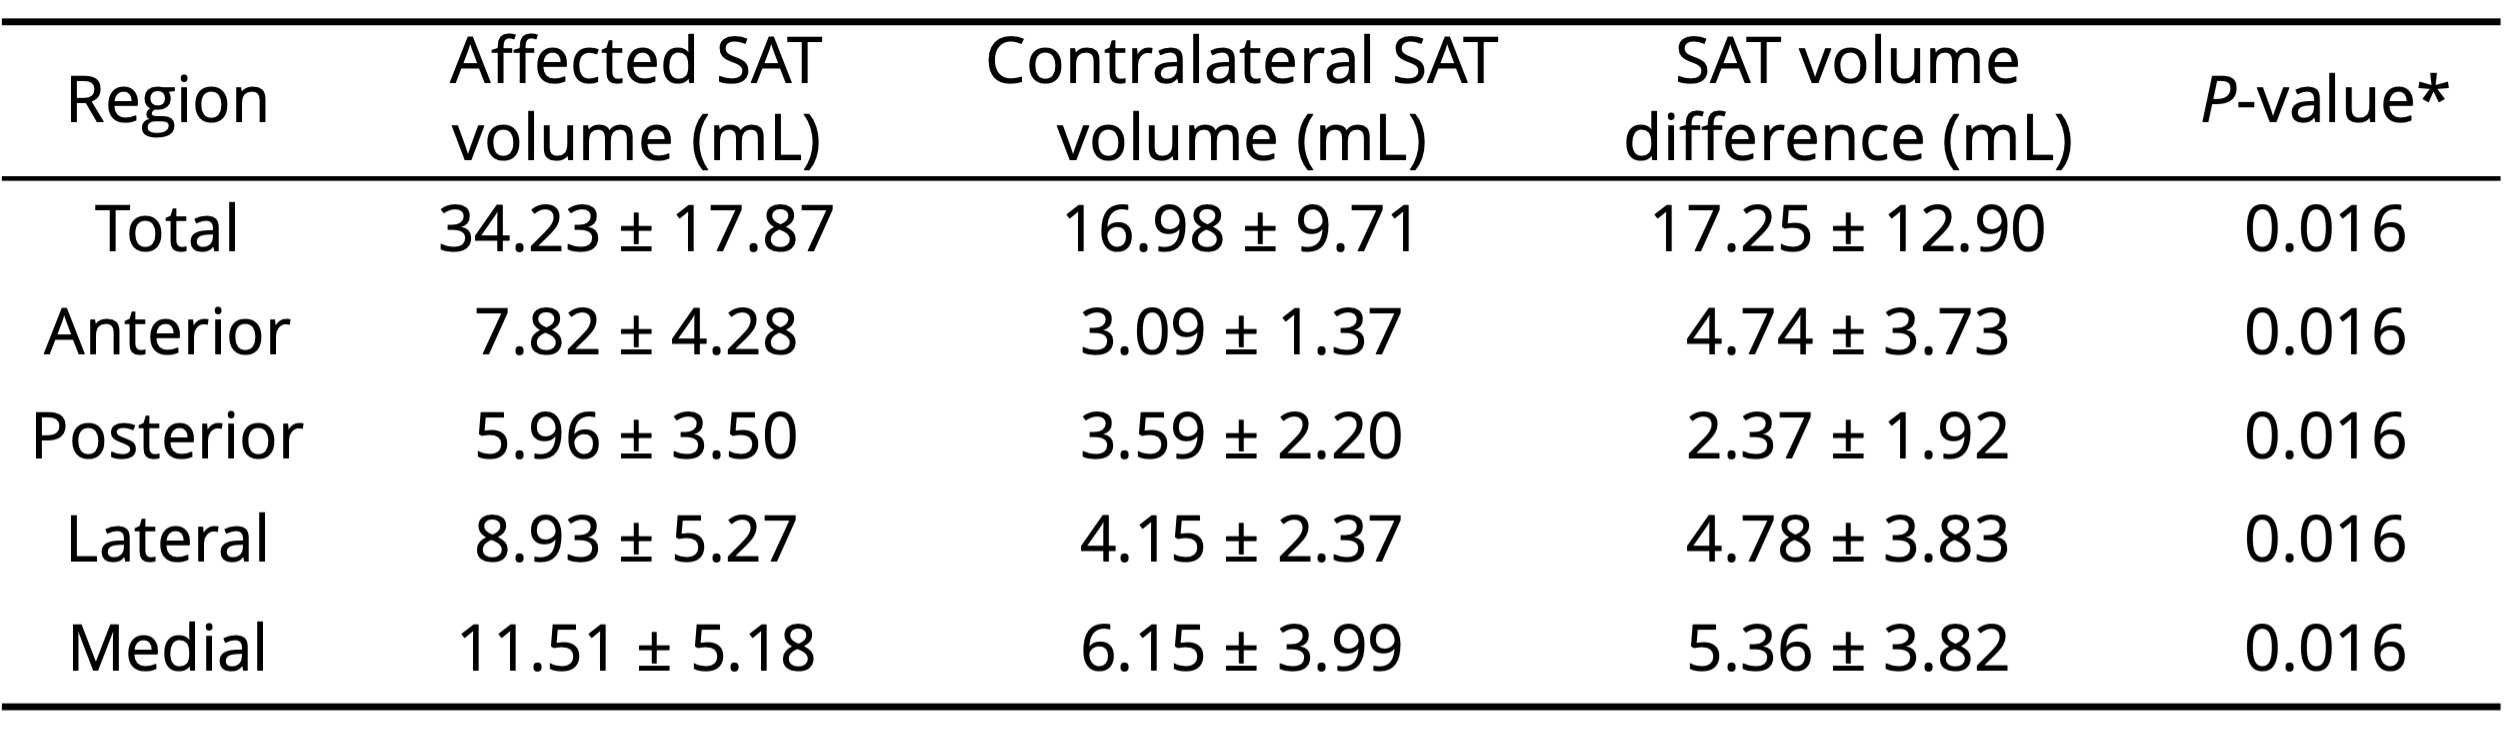
Table 1. Subcutaneous adipose tissue (SAT) volumes by anatomical region. SAT volumes are compared between affected and contralateral legs. Metrics are reported as mean ± standard deviation. *Wilcoxon signed-rank test between affected vs. contralateral SAT volume with two-sided P≤0.05 significance criteria
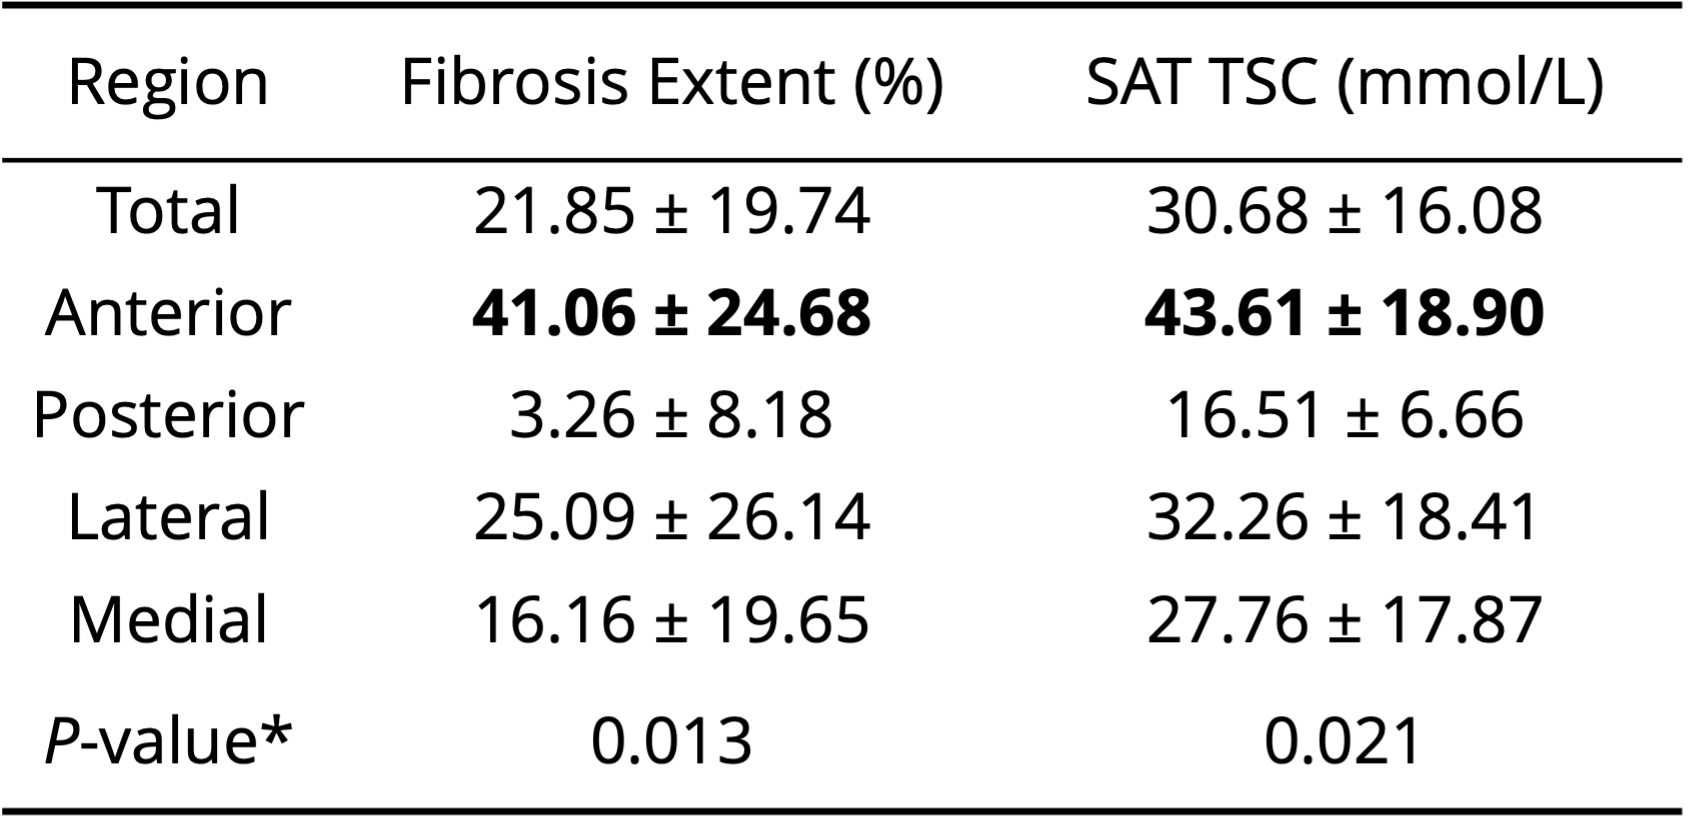
Table 2. Fibrosis extent and tissue sodium content (TSC) in the affected limb compared by anatomical quadrants of subcutaneous adipose tissue (SAT). Metrics are reported as mean ± standard deviation. *Kruskal-Wallis test with two-sided P≤0.05 significance criteria. Bold indicates significantly higher value in the anterior region compared to posterior region on post-hoc tests.
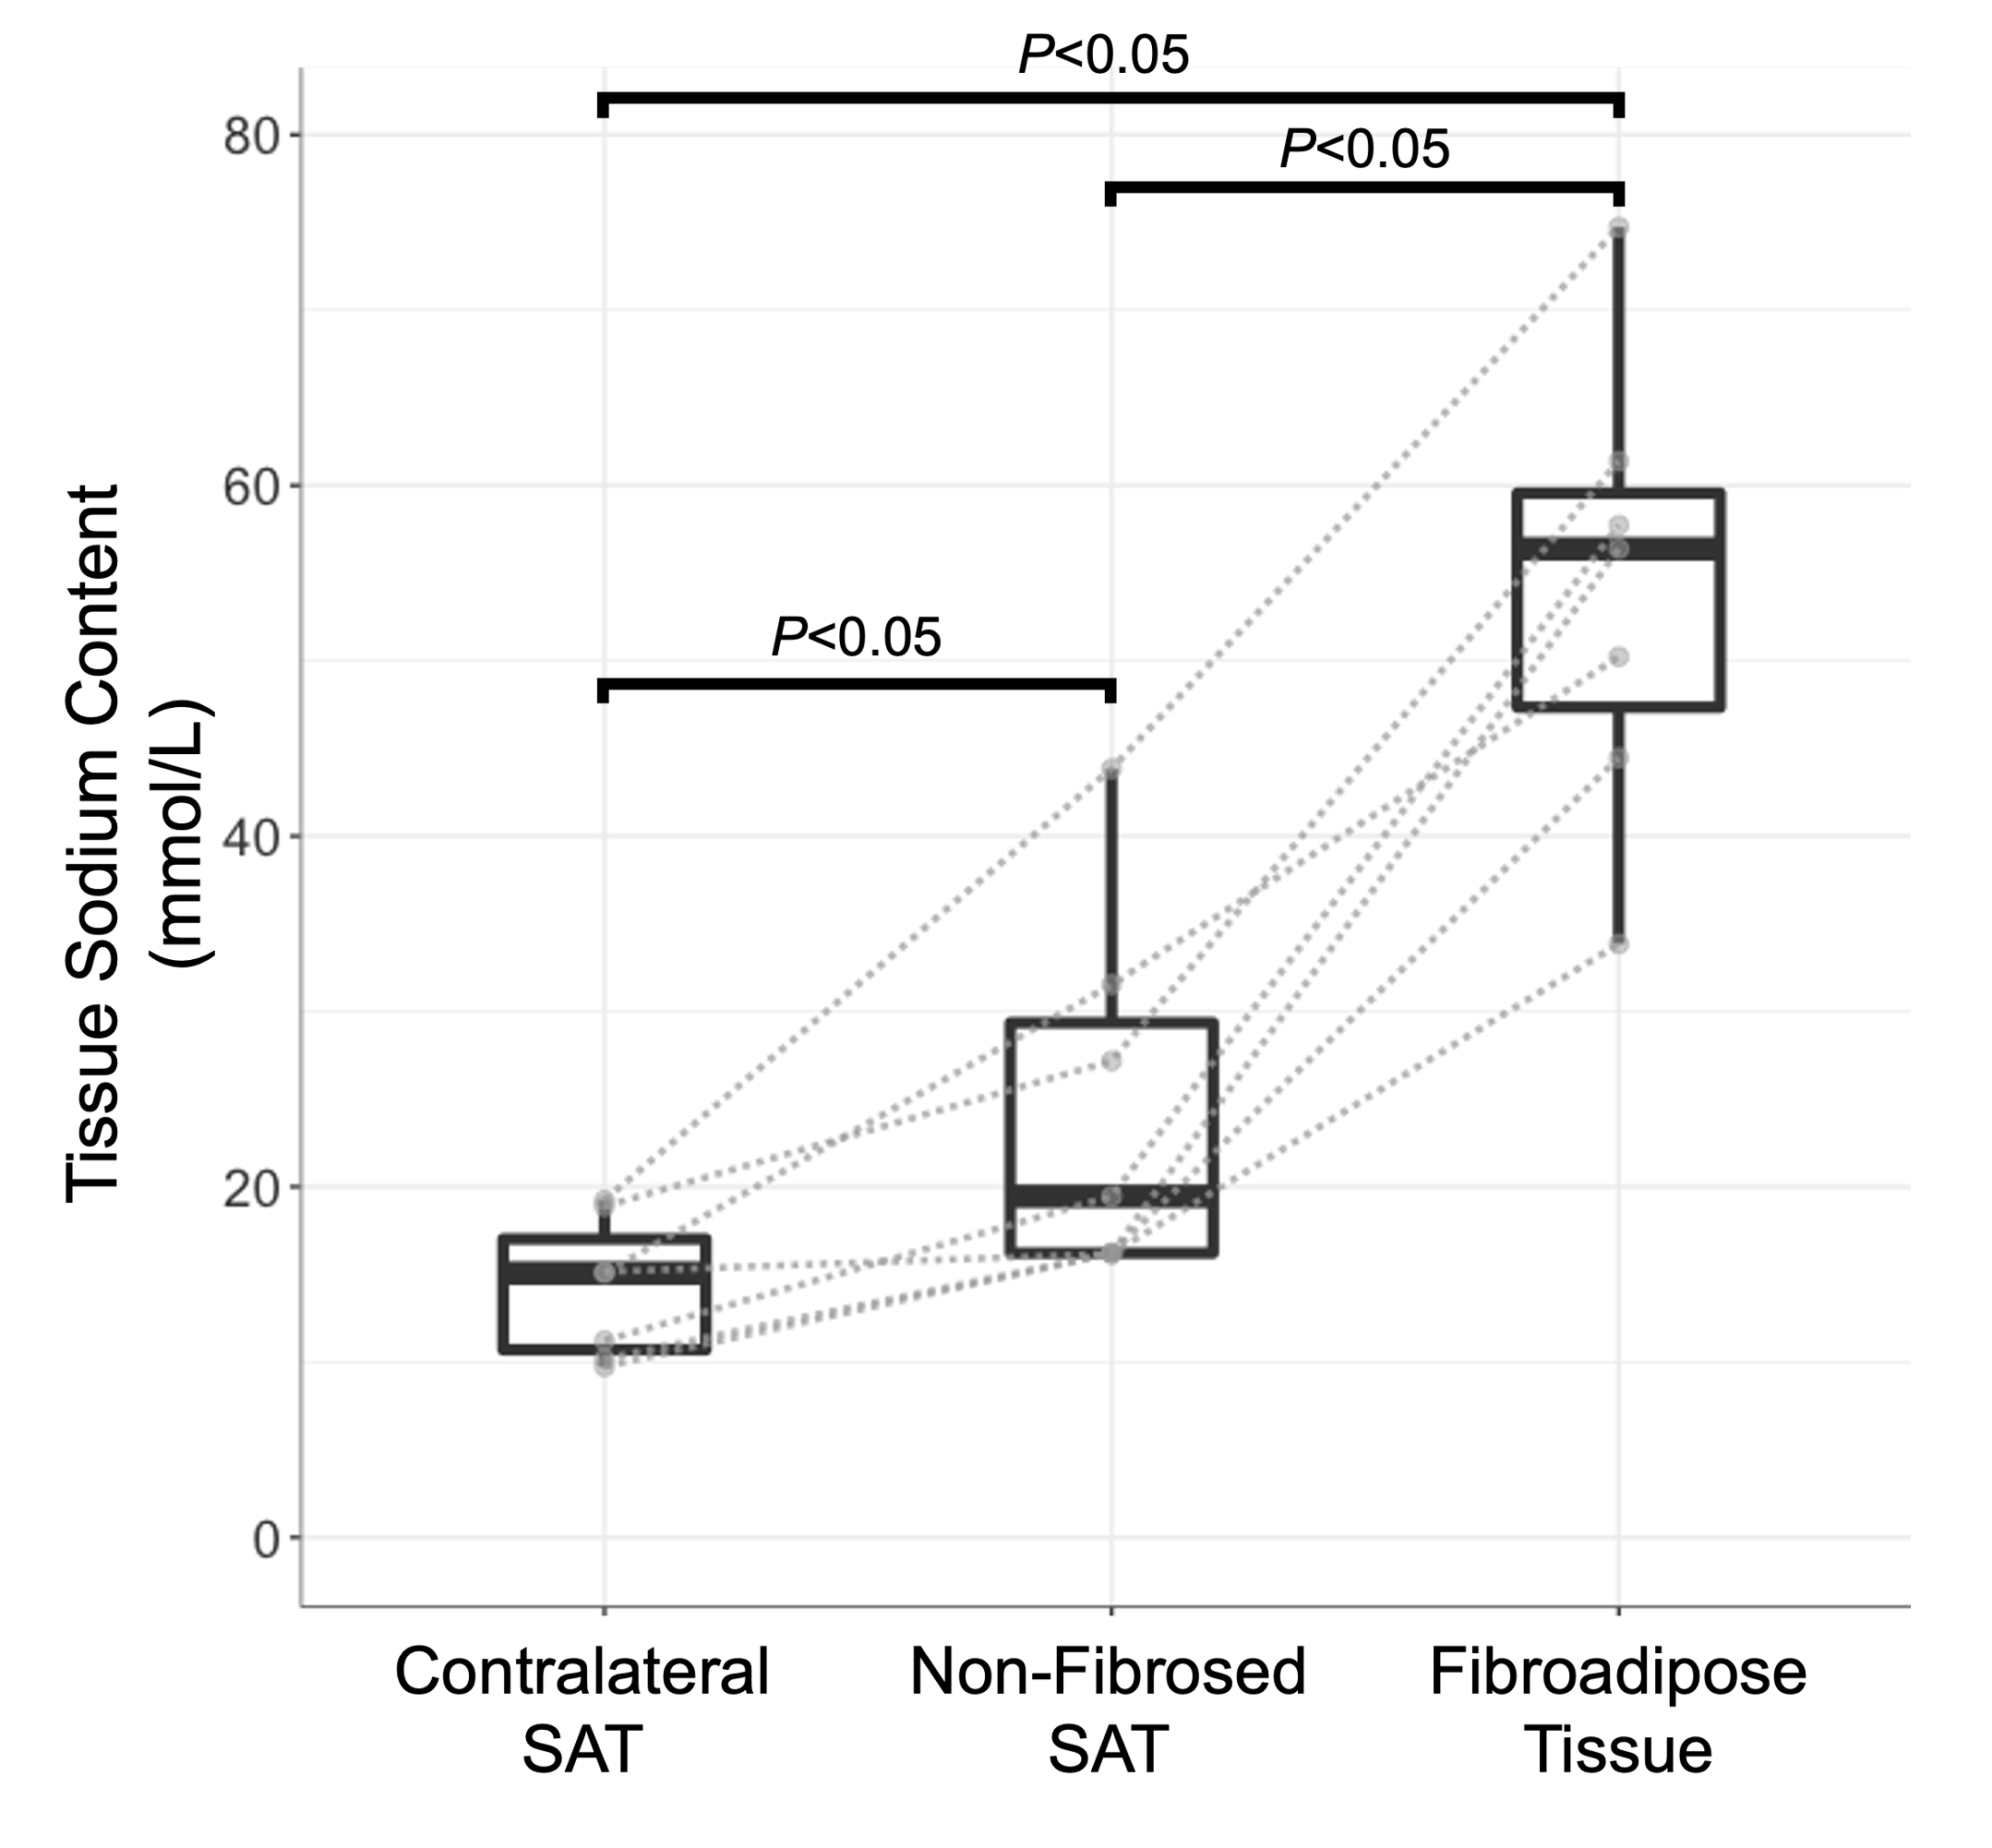
Figure 2. Regional analysis of subcutaneous tissue sodium content in limbs with lymphedema. Mean tissue sodium content was evaluated in affected limb fibroadipose tissue, surrounding non-fibrosed SAT, and contralateral SAT Gray lines indicate paired data from the same participant. Pairwise comparisons by Wilcoxon signed-rank test, two-sided P≤0.05 significance criteria, are reported.
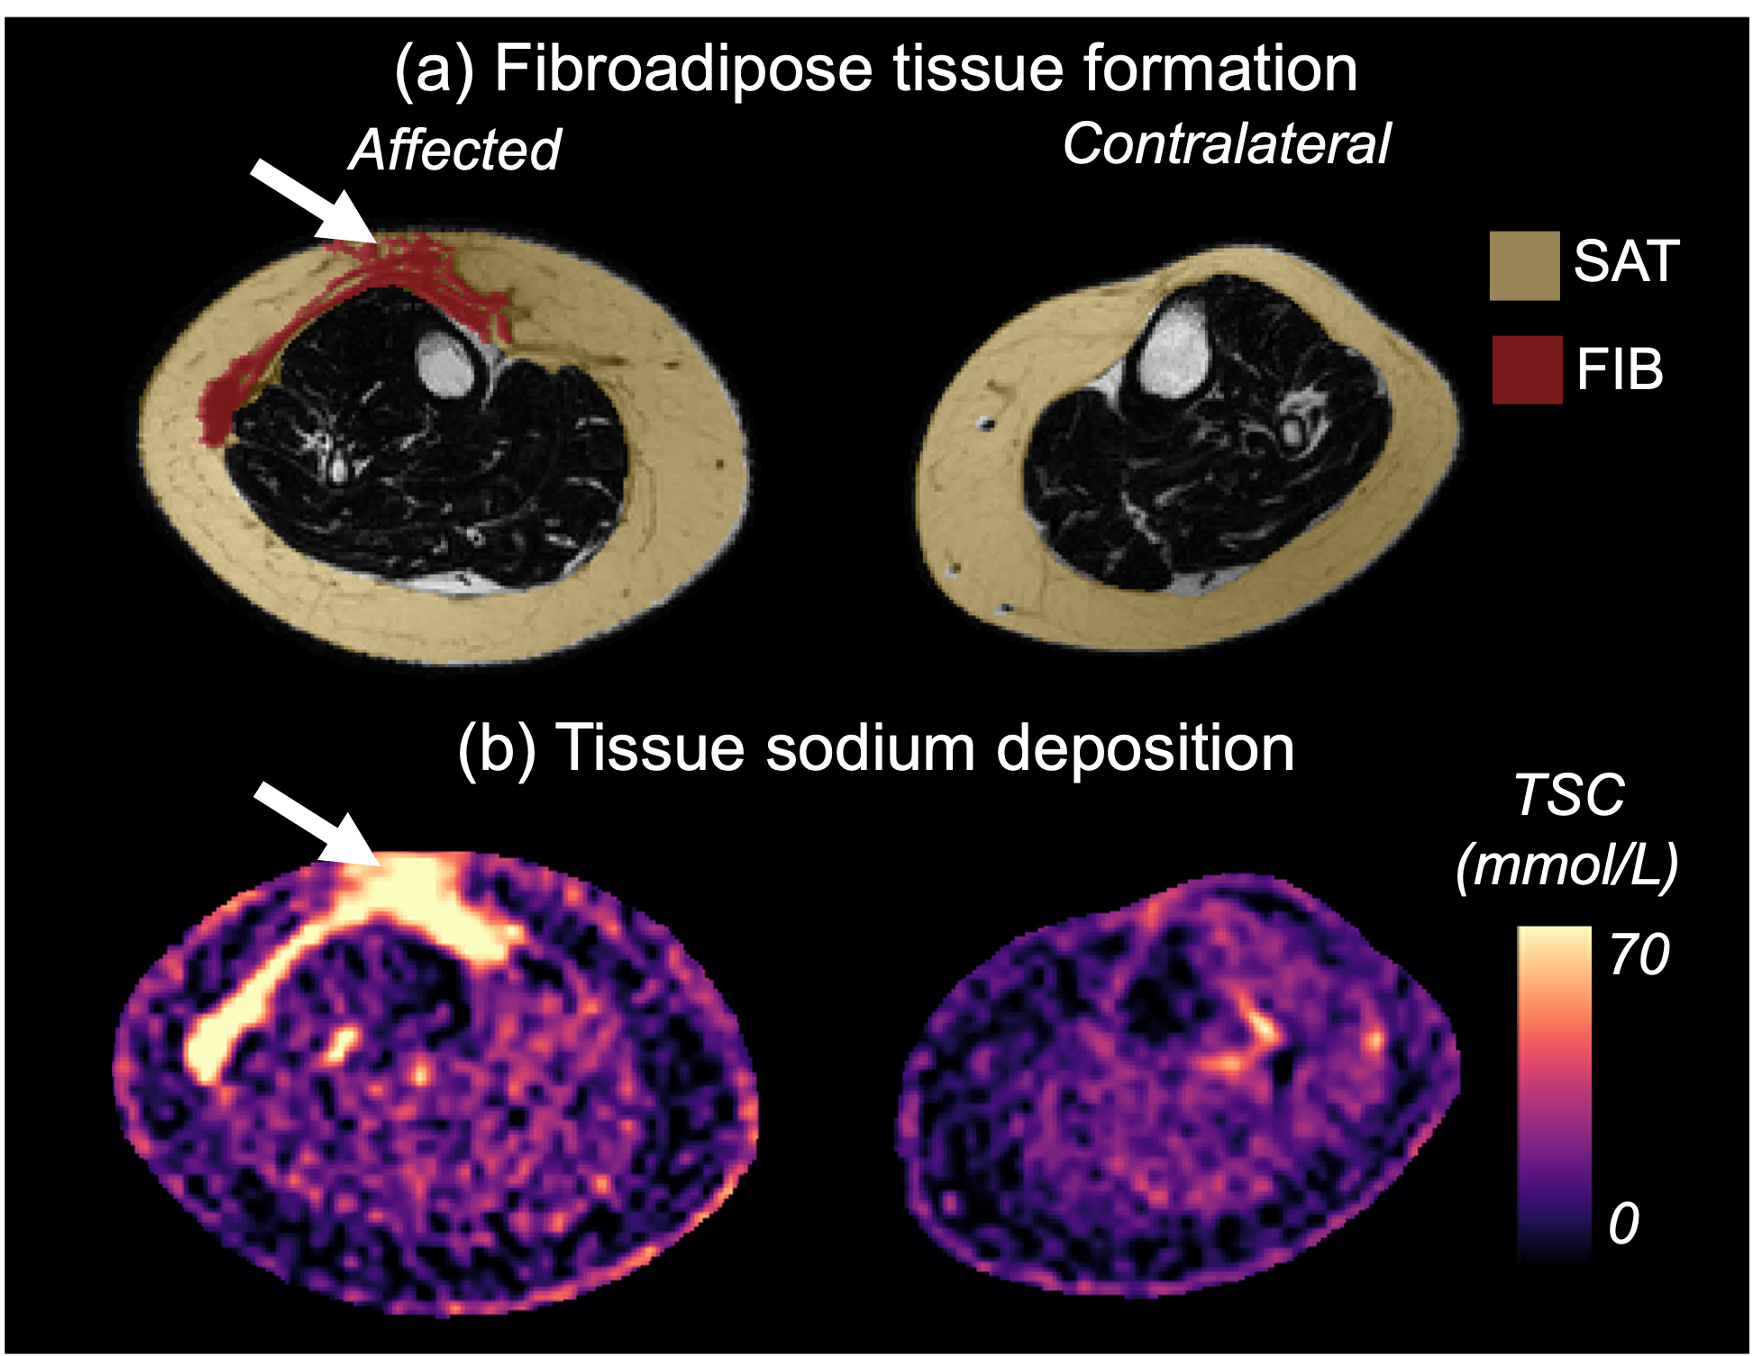
Figure 3. Multi-nuclear MRI demonstrates subcutaneous adipose tissue expansion, fibrosis, and sodium in a participant with unilateral leg lymphedema. (a) Fat-weighted MRI of the affected leg exhibits radiologically evident fibrosis (FIB, white arrow) in the subcutaneous adipose tissue (SAT) which is consistent with symptoms of advanced lymphedema. (b) Sodium deposition appears to co-localize with regions of fibrosis (white arrows), particularly in the anterior calf.