1663
3D MR Elastography-based Prediction of the Histologic VETC Pattern Associated with Aggressive Hepatocellular Carcinoma1The Third Affiliated Hospital of Sun Yat-Sen University, Guangzhou, China, 2Mayo Clinic, Rochester, MN, United States
Synopsis
Keywords: Cancer, Elastography, Hepatocellular carcinoma
A histologic sign known as “vessels encapsulating tumor clusters” (VETC) has been shown to be a powerful predictor of aggressive hepatocellular carcinoma (HCC) and is associated with unfavorable prognosis. It has been previously demonstrated that MR elastography (MRE)-based stiffness and shear strain mapping are promising in prediction of HCC aggressiveness. We investigated the diagnostic performance of MRE for predicting the VETC finding in HCC. Our results showed that 3D MRE-based peritumor OSS-pLSL and tumor stiffness performed well in predicting VETC status preoperatively, and their combination achieved an AUC of 0.92 in predicting VETC with sensitivity (87.9%) and specificity (83.9%).Introduction
The high incidence of hepatocellular carcinoma (HCC) recurrence following curative liver resection remains a major challenge in the clinical management of HCC patients 1, 2. Recently, a novel histologic vascular pattern, “vessels encapsulating tumor clusters” (VETC), in which endothelium-encapsulated tumor clusters are present that can be released into circulation directly, has been reported as a new powerful predictor of aggressive HCC 3, 4. The VETC finding is closely associated with tumor recurrence and poor prognosis among patients with HCC 3, 4. Patients with positive-VETC tumors may benefit from anatomic liver resection and operative adjuvant therapy 5, 6. However, VETC can only be diagnosed via postoperative histopathology. It has been demonstrated that MR elastography (MRE)-based stiffness characterization and shear strain mapping derived from 3D MRE have a promising role in predicting HCC aggressiveness by evaluating the intratumoral mechanical consistency and peritumoral mechanical transition 7, 8. Here, we hypothesized that the mechanical characteristics of tumor and the tumor–liver interface along HCC boundaries detected by 3D MRE will serve as biomarkers to predict histologic VETC noninvasively. This study was thus aimed to test the performance of MRE in predicting the VETC pattern in HCC.Methods
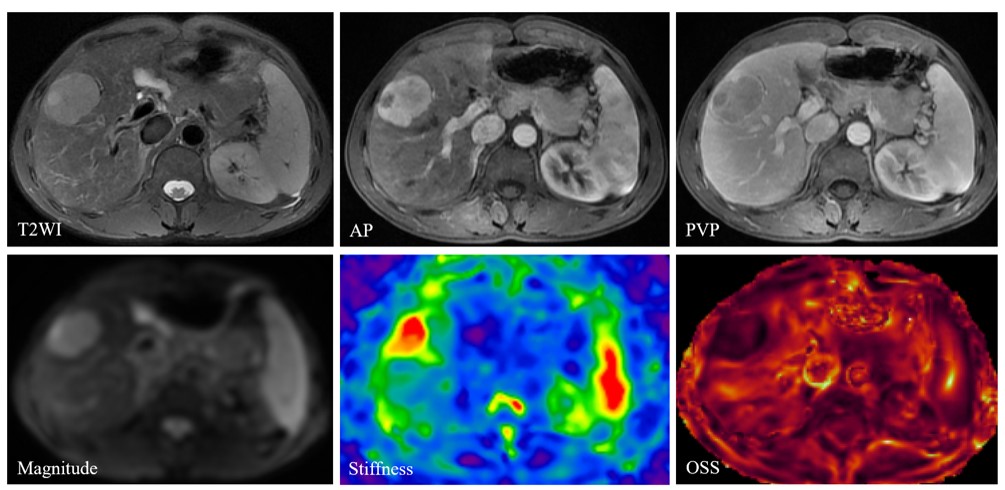
This retrospective study was approved by our IRB, with a waiver of the informed consent requirement. We included all consecutive patients of our hospital who had liver MRI examinations between August 2016 and December 2020. Patients were included if they (a) underwent 3D MRE examination and (b) underwent surgical histopathology-proven HCC within one month of MRE scanning. A total of 85 patients were initially eligible for the study. The exclusion criteria were as follows: (a) failed or inadequate MRE scan (n=4), (b) tumor was too small (≤ 2cm) (n=5) and (c) prior treatments for HCC before surgery (n=12). Ultimately, 64 patients with 60 Hz MRE examination (positive-VETC, n=33; negative-VETC, n=31) were enrolled. Patient basic characteristics were retrospectively collected from the PACS system. The 3D MRE raw data were acquired and processed and maps of octahedral shear strain (OSS) and stiffness were calculated as described in previous publications 7, 9. All slices including a tumor lesion were analyzed with a consensus from two experienced abdominal radiologists, and the corresponding mean percentage of the peritumoral interface length with low shear strain on OSS maps (i.e., low-shear-strain length, pLSL, %) and tumor stiffness (TS) on stiffness maps were calculated for further analysis. VETC pattern is defined as the presence of sinusoid-like vessels that formed web-like networks and encapsulated individual tumor clusters in the whole or part of the tumor at imaging with CD34 immunostaining 5. All specimens were analyzed by a pathologist with 12 years of experience in liver pathology. Differences between positive-VETC and negative-VETC groups were analyzed using the Mann-Whitney test, independent-sample T-test, chi-square test, or Fisher’s exact test when appropriate. The area under the receiver operating characteristic curve (AUC) was used to assess the diagnostic performance of pLSL, TS, and their combination. A p-value less than 0.05 was considered statistically significant.Results
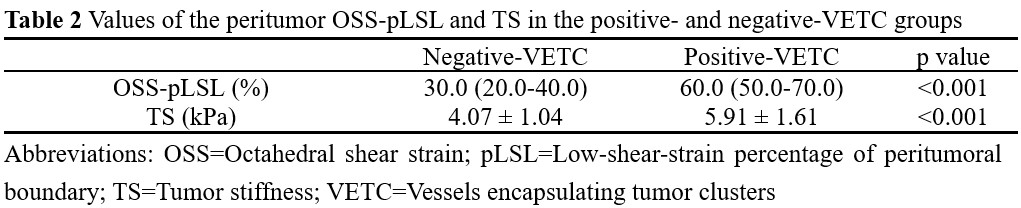
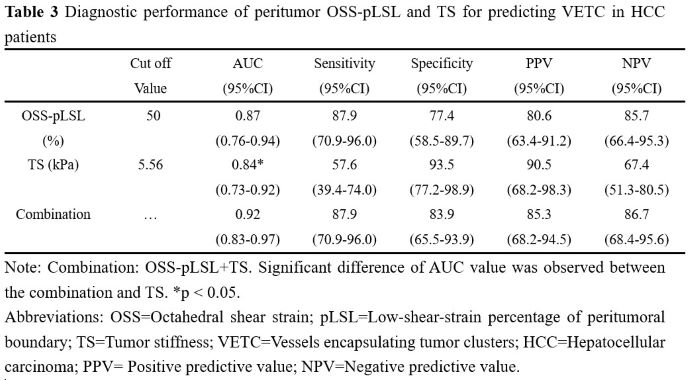
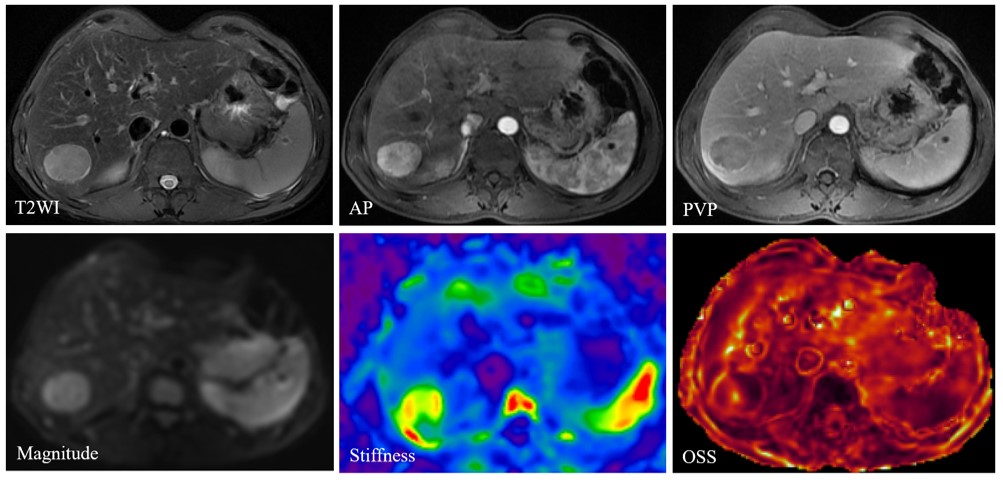
The clinical information about the enrolled patients is summarized in Table 1. There were no differences between the VETC groups for these basic characteristics. The data for peritumor OSS-pLSL and TS values for the positive- and negative-VETC groups are shown in Table 2. The peritumor OSS-pLSL and TS values in the positive-VETC group were significantly higher than in the negative-VETC group (peritumor OSS-pLSL, 60% vs. 30%; TS, 5.91 kPa vs. 4.07 kPa%; all p<0.001). Representative cases are shown in Figures 1 and 2. According to Table 3, the diagnostic performance of peritumor OSS-pLSL for predicting VETC was excellent (cutoff: 50%; AUC: 0.87) with high sensitivity (87.9%). The diagnostic performance of TS for identifying VETC was excellent (cutoff: 5.56kPa; AUC: 0.84) with high specificity (93.5%). Combining peritumor OSS-pLSL and TS provided the highest AUC value (0.92) with good sensitivity (87.9%) and specificity (83.9%) for diagnosing VETC. The AUC of the combined model outperformed that of TS (p=0.026), but no significant differences were observed in AUC between the combined model and peritumor OSS-pLSL, or between TS and peritumor OSS-pLSL (all p>0.05).Discussion
Preoperative characterization of the aggressive VETC pattern would have considerable clinical value because patients with this histologic pattern will benefit from anatomic liver resection and operative adjuvant therapy. Although previous studies have shown that preoperative radiologic features have a certain value in predicting the VETC pattern 10-12, subjective evaluation of nonquantitative features is limited by high interobserver variability. Finding noninvasive and quantitative predictors for diagnosing VETC is desirable. Our results showed that 3D MRE-based peritumor OSS-pLSL and TS were promising biomarkers for evaluating VETC status preoperatively, and the combination of integrating OSS-pLSL and stiffness achieved the best result (AUC: 0.92) in predicting VETC with good sensitivity (87.9%) and specificity (83.9%). Furthermore, 3D MRE can be performed with a short scan (64 s) and it is easy to integrate into conventional MRI exams, which may contribute to improving the detection of VETC preoperatively.Conclusions
MRE-based shear strain mapping and stiffness characterization are promising techniques for noninvasively predicting the VETC status in patients with HCC, which should be further validated in a prospective study with a large sample.Acknowledgements
National Natural Science Foundation of China grant 91959118 (JW) and 82271973(JW), Key Research and Development Program of Guangdong Province 2019B020235002 (JW), Guangdong Basic and Applied Basic Research Foundation, 2021A1515010582 (JW), SKY Radiology Department International Medical Research Foundation of China Z-2014-07-2101 (JW), Clinical Research Foundation of the 3rd Affiliated Hospital of Sun Yat-sen University YHJH201901 (JW), NIH R61 AT01218(ZY Y) and R01 NS113760(ZY Y).References
1. Bruix J, Gores GJ, Mazzaferro V. Hepatocellular carcinoma: clinical frontiers and perspectives. Gut. 2014;63(5):844-855.
2. Heimbach JK, Kulik LM, Finn RS, et al. AASLD guidelines for the treatment of hepatocellular carcinoma. Hepatology. 2018;67(1):358-380.
3. Fang JH, Zhou HC, Zhang C, et al. A novel vascular pattern promotes metastasis of hepatocellular carcinoma in an epithelial-mesenchymal transition-independent manner. Hepatology. 2015;62(2):452-465.
4. Renne SL, Woo HY, Allegra S, et al. Vessels Encapsulating Tumor Clusters (VETC) Is a Powerful Predictor of Aggressive Hepatocellular Carcinoma. Hepatology. 2020;71(1):183-195.
5. Fang JH, Xu L, Shang LR, et al. Vessels That Encapsulate Tumor Clusters (VETC) Pattern Is a Predictor of Sorafenib Benefit in Patients with Hepatocellular Carcinoma. Hepatology. 2019;70(3):824-839.
6. Guan R, Lin W, Zou J, et al. Development and Validation of a Novel Nomogram for Predicting Vessels that Encapsulate Tumor Cluster in Hepatocellular Carcinoma. Cancer Control. 2022;29:1389446428.
7. Li M, Yin Z, Hu B, et al. MR Elastography-Based Shear Strain Mapping for Assessment of Microvascular Invasion in Hepatocellular Carcinoma. Eur Radiol. 2022;32(7):5024-5032.
8. Liu W, Rong D, Zhu J, et al. Diagnostic accuracy of 3D magnetic resonance elastography for assessing histologic grade of hepatocellular carcinoma: comparison of three methods for positioning region of interest. Abdom Radiol (NY). 2021;46(10):4601-4609.
9. Zhang L, Chen J, Jiang H, et al. MR elastography as a biomarker for prediction of early and late recurrence in HBV-related hepatocellular carcinoma patients before hepatectomy. Eur J Radiol. 2022;152:110340.
10. Feng Z, Li H, Zhao H, et al. Preoperative CT for Characterization of Aggressive Macrotrabecular-Massive Subtype and Vessels That Encapsulate Tumor Clusters Pattern in Hepatocellular Carcinoma. Radiology. 2021;300(1):219-229.
11. Fan Y, Yu Y, Hu M, et al. Imaging features based on Gd-EOB-DTPA-enhanced MRI for predicting vessels encapsulating tumor clusters (VETC) in patients with hepatocellular carcinoma. Br J Radiol. 2021;94(1119):20200950.
12. Chen FM, Du M, Qi X, et al. Nomogram Estimating Vessels Encapsulating Tumor Clusters in Hepatocellular Carcinoma From Preoperative Gadoxetate Disodium-Enhanced MRI. J Magn Reson Imaging. 2022. doi:10.1002/jmri.28488
Figures