1662
An 18F-FDG PET/3D-UTE MRI-based radiomics model facilitates the preoperative assessment of lymph node status in non-small cell lung cancer1Department of Medical Imaging, Zhengzhou University People’s Hospital & Henan Provincial People’s Hospital, Zhengzhou, China, 2Department of Medical Imaging, Henan University People’s Hospital & Henan Provincial People’s Hospital, Zhengzhou, China, 3Department of Medical Imaging, Xinxiang Medical University Henan Provincial People’s Hospital, Zhengzhou, China, 4Central Research Institute, UIH Group, Shanghai, China, 5Beijing United Imaging Research Institute of Intelligent Imaging, UIH Group, Beijing, China, 6Zhengzhou University People’s Hospital & Henan Provincial People’s Hospital, Zhengzhou, China
Synopsis
Keywords: Cancer, PET/MR
18F-FDG PET/MRI is one of the most advanced means for the noninvasive diagnosis and evaluation of tumors. Three-dimensional ultrashort echo time (3D-UTE) is a novel MRI technique, which not only does not have ionizing radiation but also yields similar diagnostic results as conventional pulmonary CT. Our results showed that the 18F-FDG PET/MRI model based on clinical factors, 3D-UTE, and PET radiomics features could noninvasively assess the lymph node status in non-small cell lung cancer(NSCLC). Compared with the PET/CT model, it has similar diagnostic efficiency but less radiation, which is expected to provide new ideas for related research.Introduction
The presence of metastasis in lymph nodes (LN) is closely related to the prognosis of patients with non-small cell carcinoma (NSCLC)[1]. 18F-Fluorodeoxyglucose positron emission tomography/magnetic resonance imaging (18F-FDG PET/MRI) is one of the most advanced means for the diagnosis and evaluation of tumors[2]. Three-dimensional ultrashort echo time (3D-UTE) is a novel MRI technique, which not only does not have ionizing radiation but also yields similar diagnostic results as conventional pulmonary computed tomography (CT)[3]. To our knowledge, there is no relevant study involving 18F-FDG PET/3D-UTE-MRI radiomics models in the field of lung lesion evaluation that has been reported thus far. Hence, the purpose of this study was to use machine learning methods to develop an 18F-FDG PET/MRI model combining clinical factors, 3D-UTE, and PET radiomics features to predict the LN status of NSCLC, with the aim of providing a new idea with less radiation burden for related research.Material and Methods
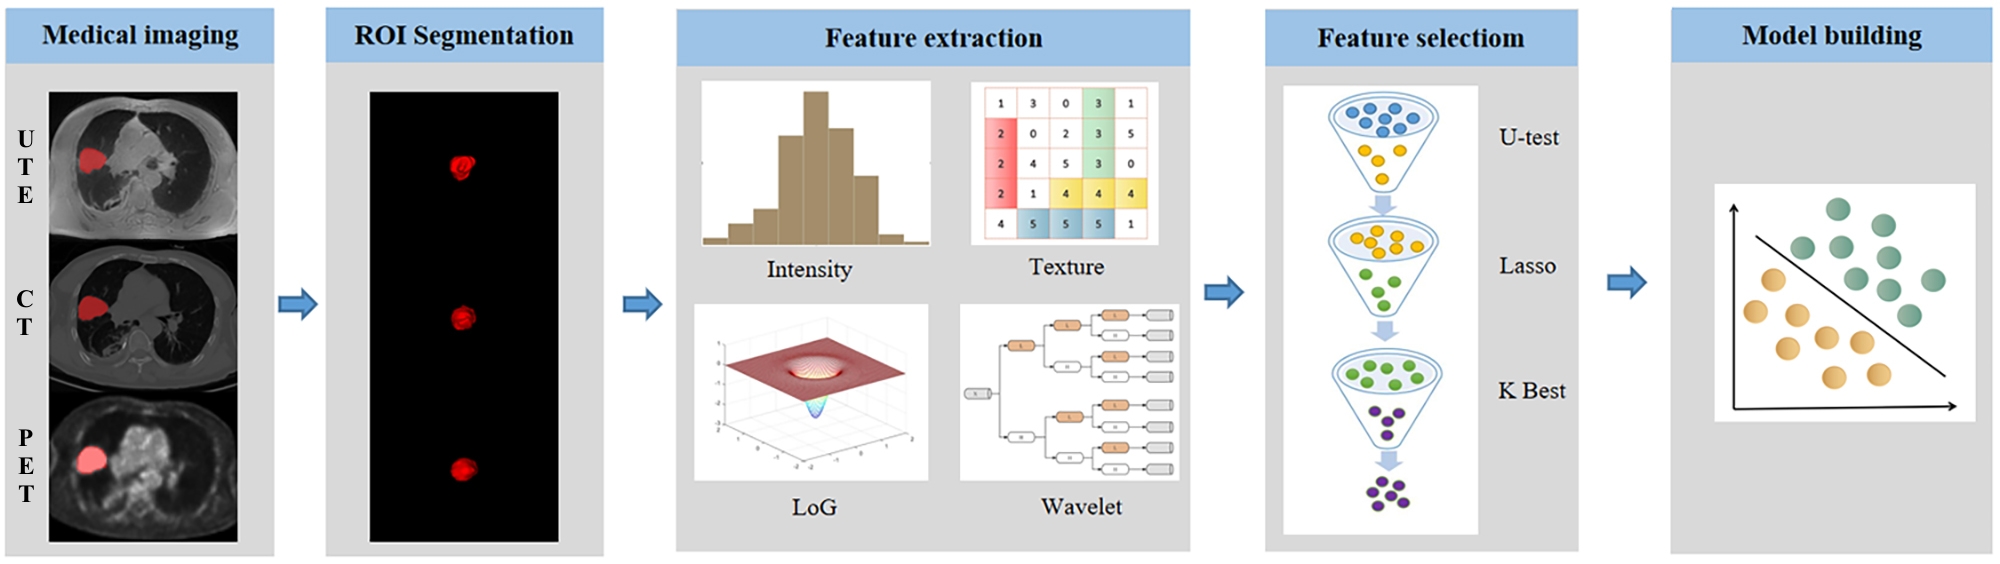
A total of 144 NSCLC patients (training, 101 cases; test, 44 cases) were enrolled in this study. A hybrid 3.0 T PET/MR system (uPMR 790, UIH, Shanghai, China) with a 12-channel phased-array body coil was performed. The PET scan was initiated 60 minutes after injection of 18F-FDG (0.11 mCi/kg). A respiratory-gated axial 3D-UTE pulse sequence was obtained according to the following parameters: TR = 2.6 ms, TE = 0.16 ms, flip angle = 3°, slice thickness = 2 mm, matrix = 456 × 456, voxel size = 0.767 × 0.767 × 2 mm3, acquisition time = 5 min 26 s. The diagnostic CT (tube current 10 mA, voltage 120 kV, rotation time 0.8 s, pitch 0.6125, collimation 40 mm) was performed last. The uAI software (United Imaging Intelligence, Shanghai, China) was used for volume of interest region (VOI) segmentation and radiomics feature extraction. The Mann‒Whitney U test, LASSO logistic regression, and SelectKBest were performed to select the most relevant features. Random forest (RF), partial least squares discriminant analysis (PLS-DA), and support vector machine (SVM) were applied in model establishment [4, 5] (Figure.1).Statistical analyses were performed with Python (Version 3.10; Python Software Foundation) software. The Mann-Whitney U test and chi-square test were used to analyse the differences of continuous variables and the differences of categoric variables, respectively. The ROC was employed to quantify the diagnostic efficacy, and the differences were assessed using DeLong analysis. The calibration degree of the model was evaluated by the Hosmer-Lemeshow (H-L) test and presented by calibration curve. The decision curve analyses (DCA) was applied to calculate the clinical net benefit.
Results
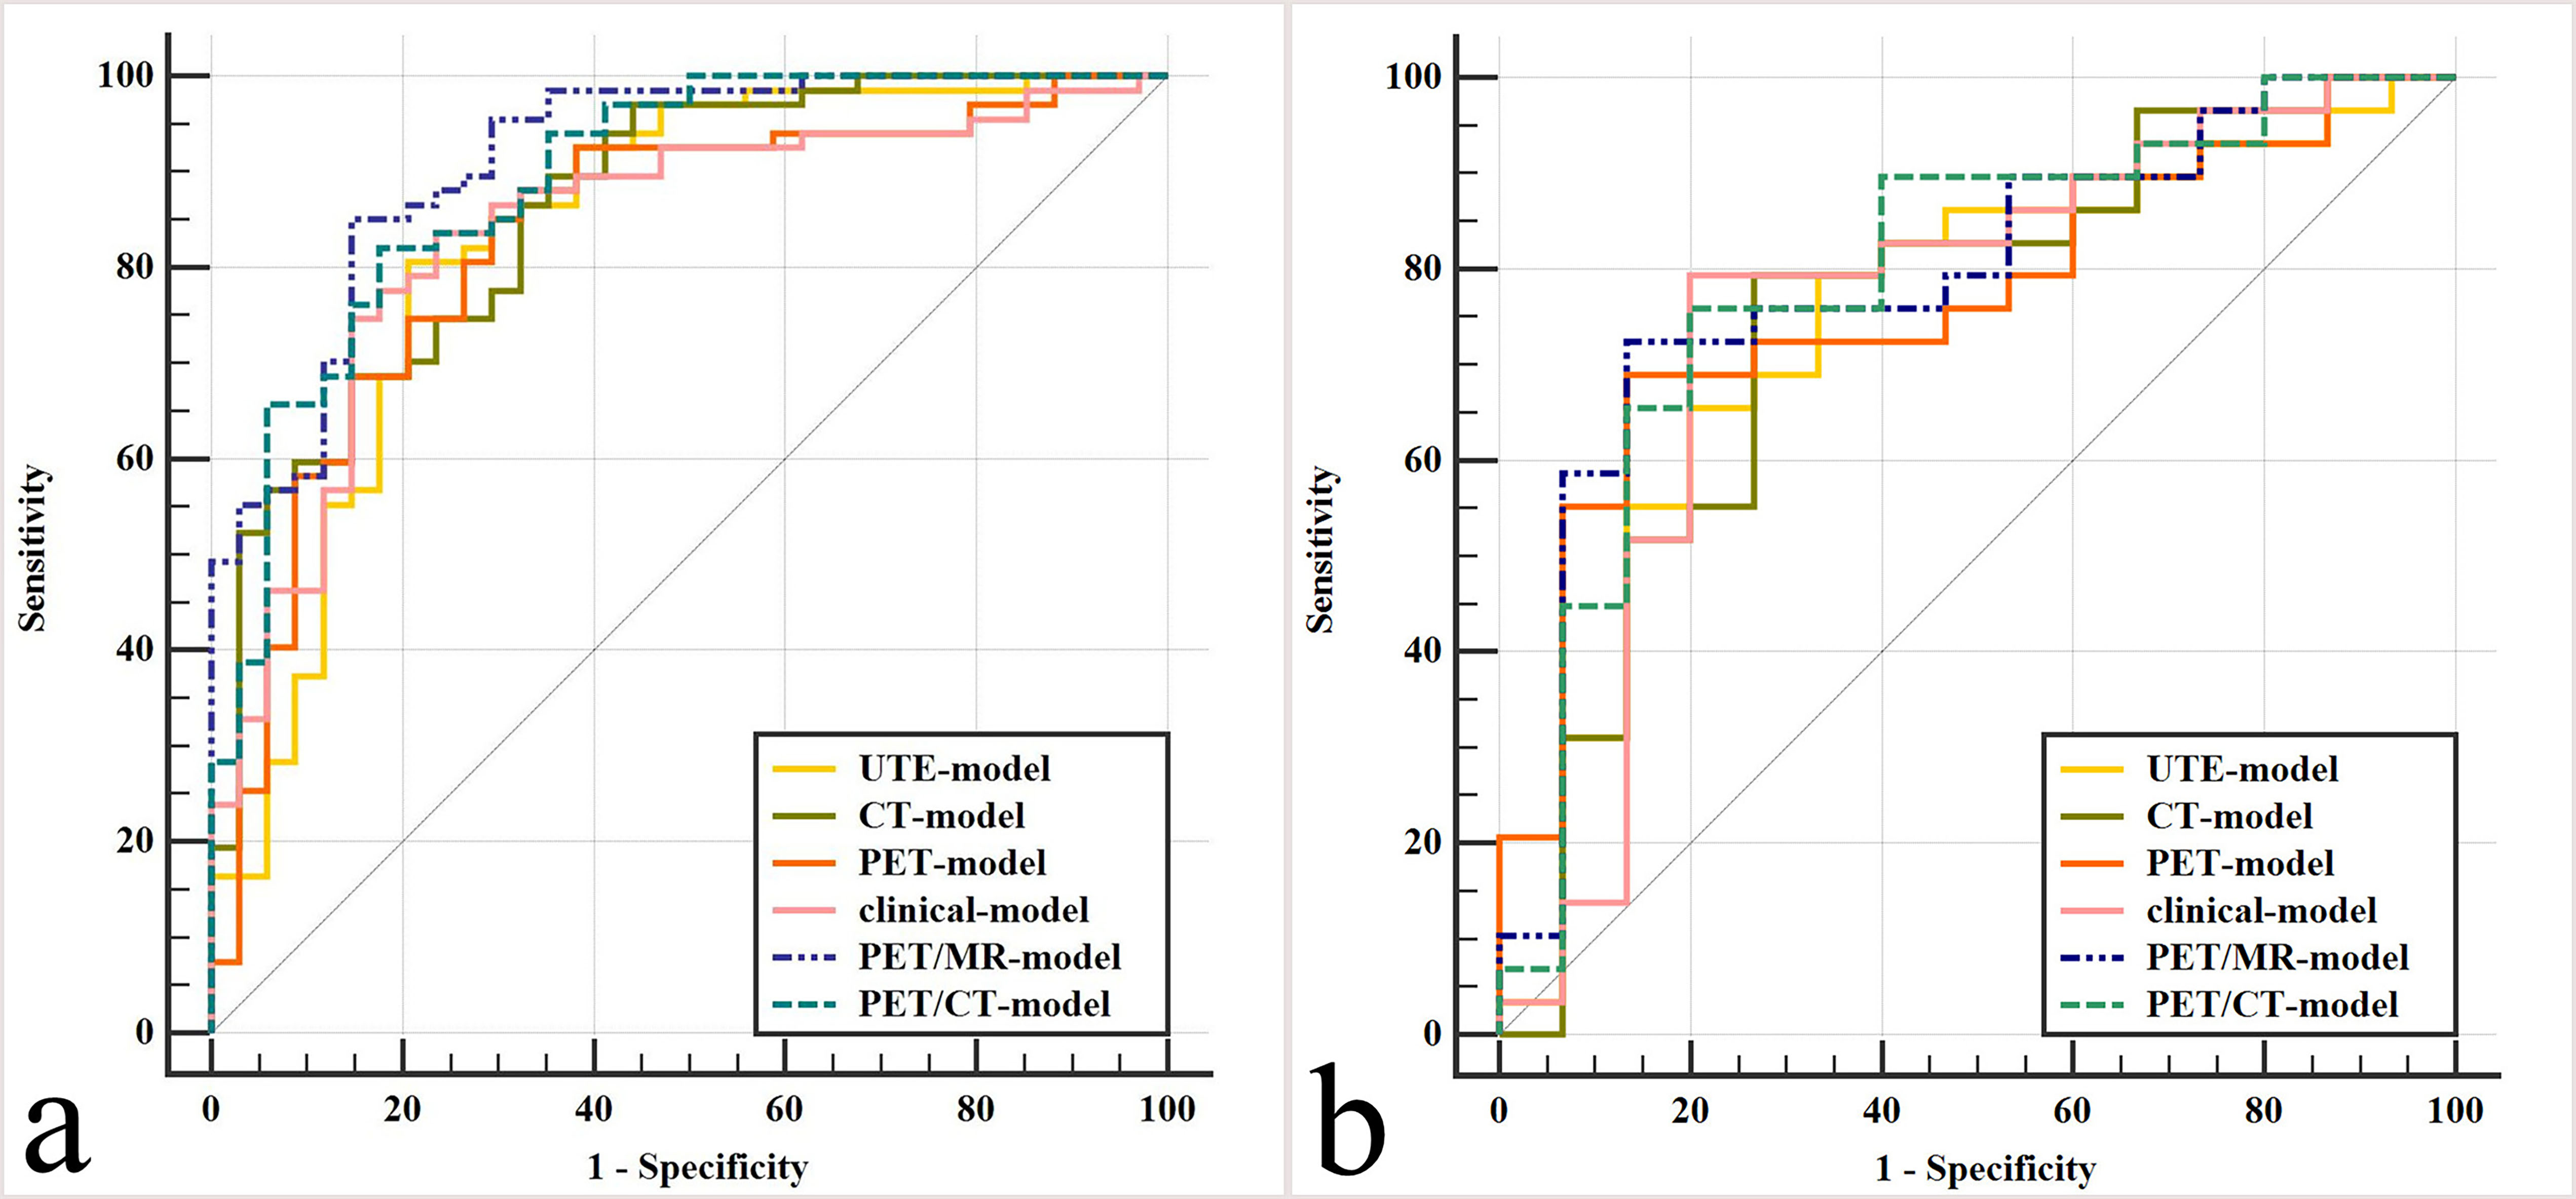
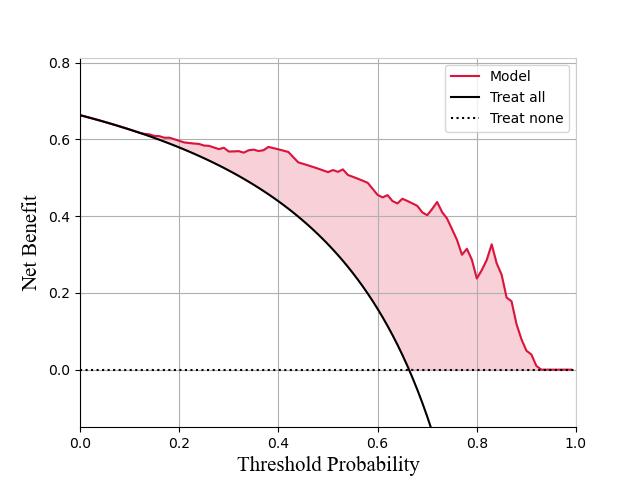
A prediction model based on RF, consisting of four clinical factors, six 3D-UTE and six PET radiomics features, was used as the final model for PET/MRI. The AUCs of this model were 0.912 and 0.791 in the training and test sets, respectively, which not only showed different degrees of improvement over individual models such as clinical, 3D-UTE, and PET (AUC-training = 0.838, 0.834, and 0.828, AUC-test = 0.756, 0.745, and 0.768, respectively), but also achieved the similar diagnostic efficacy as the optimal PET/CT model consisting of four clinical factors, six CT and six PET radiomics features (AUC-training = 0.890, AUC-test = 0.793) (Figure.2). The calibration curves and DCA indicated good consistency (C-index, 0.912) and clinical utility of this model, respectively (Figure.3).Discussion
This study developed a PET/MRI model and compared it with clinical, 3D-UTE, PET, and PET/CT models. The results showed that the diagnostic efficacy of the PET/MRI model not only was improved to different degrees compared with the clinical, 3D-UTE, and PET models, but also achieved the similar diagnostic efficacy as the PET/CT model, which can provide a new idea with less radiation burden for relevant clinical diagnosis and treatment. Classification method options are decisive in affecting the performance of machine learning classification, and different classification methods have their own strengths and weaknesses [6]. Therefore, applying as many classification methods as possible to filter out the most appropriate prediction models when conditions permit may still be the most effective machine learning modeling approach at present.Conclusion
The 18F-FDG PET/MRI model based on clinical factors, 3D-UTE and PET radiomics features using machine learning methods could noninvasively assess the LN status of NSCLC. Compared with the PET/CT model, it has similar diagnostic efficiency but less radiation, which is expected to provide new ideas for related research.Acknowledgements
The National Key R&D Program of China (2017YFE0103600), the National Natural Science Foundation of China (81720108021 and 31470047), the Zhongyuan Thousand Talents Plan Project - Basic Research Leader Talent (ZYQR201810117), the Zhengzhou Collaborative Innovation Major Project (20XTZX05015), the Key Project of Henan Province Medical Science and Technology Project (LHGJ20190602), and the Henan provincial science and technology research projects (212102310689).References
1. Ettinger DS, Wood DE, Aisner DL et al. NCCN Guidelines Insights: Non-Small Cell Lung Cancer, Version 2.2021. J Natl Compr Canc Netw. 2021; 19:254-266.
2. Ehman EC, Johnson GB, Villanueva-Meyer JE et al. PET/MRI: Where might it replace PET/CT. J Magn Reson Imaging. 2017; 46:1247-1262.
3. Ohno Y, Koyama H, Yoshikawa T et al. Pulmonary high-resolution ultrashort TE MR imaging: Comparison with thin-section standard- and low-dose computed tomography for the assessment of pulmonary parenchyma diseases. J Magn Reson Imaging. 2016; 43:512-532.4.
Bashir U, Azad G, Siddique MM et al. The effects of segmentation algorithms on the measurement of 18F-FDG PET texture parameters in non-small cell lung cancer. EJNMMI Res.2017; 7:60.
5. Brereton R G , Lloyd G R. Partial least squares discriminant analysis: taking the magic away. Journal of Chemometrics.2014; 28:213-225.
6. Qian Z, Li Y, Wang Y et al. Differentiation of glioblastoma from solitary brain metastases using radiomic machine-learning classifiers. Cancer Lett.2019; 451:128-135.
Figures