1661
Constructing different models to predict the degree of uterine prolapse based on high-resolution MRI radiomics
Qian Wang1, Qiu Bi2, Yijun Zheng1, Yaoxing Wang1, Yuhui Chen2, Chenrong Li1, Xianhong Wang1, Yunzhu Wu3, and Guoli Bi2
1Medical school, Kunming University of Science and Technology, Kunming, China, 2Department of MRI, the First People’s Hospital of Yunnan Province, Kunming, China, 3MR Scientific Marketing, Siemens Healthineers Ltd, Shanghai, China
1Medical school, Kunming University of Science and Technology, Kunming, China, 2Department of MRI, the First People’s Hospital of Yunnan Province, Kunming, China, 3MR Scientific Marketing, Siemens Healthineers Ltd, Shanghai, China
Synopsis
Keywords: Uterus, Radiomics, High-resolution MRI
Uterine prolapse has become one of the most common chronic diseases affecting women's health and quality of life. Early detection and intervention would be important factors to delay the progress of uterine prolapse. In this study, high-resolution magnetic resonance imaging(HR-MRI) of pelvic floor combined with radiomics was used to investigate the degree of uterine prolapse. It was found that the HR-MRI radiomics can be used as an effective evaluation method, and the nomogram has the best diagnostic efficacy for predicting the degree of uterine prolapse.Purpose
Clinical management and the prognosis of uterine prolapse are closely related to the degree of prolapse on account of different treatment options. This study aimed to assess the potential utility of diverse models constructed by radiomics features combined with clinical and conventional MRI parameters for predicting the degree of uterine prolapse, thereby providing support for the selection of clinical treatment methods of uterine prolapse.Methods
A total of 129 patients with uterine prolapse were prospectively enrolled and divided into a training group (n=96) and a validation group (n=33). Pelvic floor MRI in all patients was performed on a 1.5T MRI scanner (MAGNETOM Aera, Siemens Healthineers, Erlangen, Germany) equipped with an 8-channel phased array coil. The radiomics features were extracted using the open-source software 3D Slicer 4.11.0 (https://www.slicer.org/) from the high-resolution T2-weighted imaging (T2WI) of puborectalis muscle (shown in Figure 1) with the following scanning parameters: repetition time = 700ms, echo time = 81ms, slice thickness = 1mm, slice gap = 0mm, flip angle = 170°, FOV = 240 mm x 240 mm, matrix size = 256 x 256. The following nine classifiers were used to establish the radiomics model after feature reduction: logistic regression (LR), support vector machine (SVM), stochastic gradient descent (SGD), K nearest neighbour (KNN), decision tree (DT), random forest (RF), extremely randomized trees (ET), eXtreme Gradient Boosting (XGBoost), and Light Gradient Boosting Machine (LightGBM). An optimal radiomics model was selected and the radiomics score was calculated simultaneously. The valuable clinical and conventional MRI parameters were screened and an MRI model and a clinical-MRI model were established through the following parameters: clinical parameters including age, body mass index, parity, number of deliveries, number of abortions, menopause, mode of delivery, occupation; conventional MRI parameters(Figure 2) including the distance from the farthest end of the anterior cervical lip to the pubococcygeal line (PCL), M line, PCL, H angle,and G angle in the maximum straining state; M line, PCL, H angle, G angle, anteroposterior diameter of levator hiatus, lateral diameter of levator hiatus, levator hiatus area, anteroposterior diameter of the pelvic inlet, interspinous diameter, and intertuberous diameter in the resting state. Integrating with the effective clinical and conventional MRI parameters and radiomics score, the nomogram was established. The receiver operator characteristic (ROC) curves, the area under the curve (AUC) and the calibration curve were used to evaluate the diagnostic efficiency and stability of each model. The clinical decision curve (CDC), the net reclassification index (NRI), and the integrated discrimination improvement (IDI) were used to evaluate the net clinical benefit of each model. Statistical analysis was performed using the IBM SPSS 26.0 (IBM, New York, USA) and R software (v4.0.3, Foundation for Statistical Computing, Vienna, Austria). Univariate analysis and multivariate analysis were performed to screen valuable clinical and conventional MRI parameters. R software was used for feature reduction and selection, classifier modelling and model evaluation. P < 0.05 was considered as statistical discrepancy.Results
The menopause, the distance from the farthest anterior cervical lip to the PCL in the maximum straining state, and the interspinous diameter in the resting state were independent predictors of the degree of uterine prolapse (Table 1). The LightGBM classifier was the best radiomics model. In the training group, the diagnostic performance of the radiomics model(AUC = 0.967) and nomogram(AUC = 0.965) were similar and both better than those of the MRI model(AUC = 0.872) and clinical-MRI model (AUC = 0.894). In the validation group, the diagnostic performance of the clinical-MRI model(AUC = 0.931) and nomogram(AUC = 0.933) were similar and better than those of the MRI model(AUC = 0.882) and radiomics model (AUC = 0.845), but the sensitivity of the nomogram was higher than that of the clinical-MRI model (sensitivity = 0.833 and 0.778, respectively) (Figure 3, Table 2). Each model achieved a good net clinical benefit per CDC, NRI, and IDI (Figure 3, Table 2).Conclusion
The different models constructed based on MRI radiomics combined with clinical and conventional MRI parameters all have the distinguish ability between mild and severe uterine prolapse. Among them, the radiomics enables early detection of disease heterogeneity, which has the potential to be used as an effective evaluation method to predict the degree of uterine prolapse; the nomogram has higher accuracy and reliability, which represents a very promising method that is helpful in realizing noninvasive early identification of uterine prolapse and in selecting precise individualized treatment strategies to improve patient prognosis.Acknowledgements
We sincerely thank the participants in this study.References
No reference found.Figures
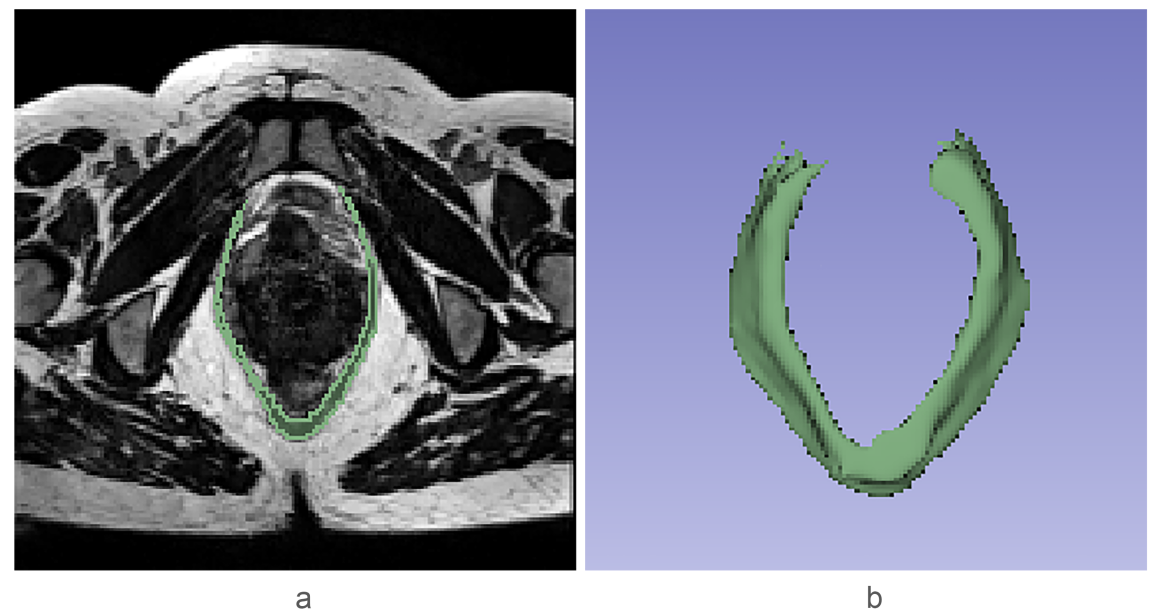
Figure 1 (a-b)The puborectalis muscle segmented on high-resolution T2-weighted imaging (T2WI).
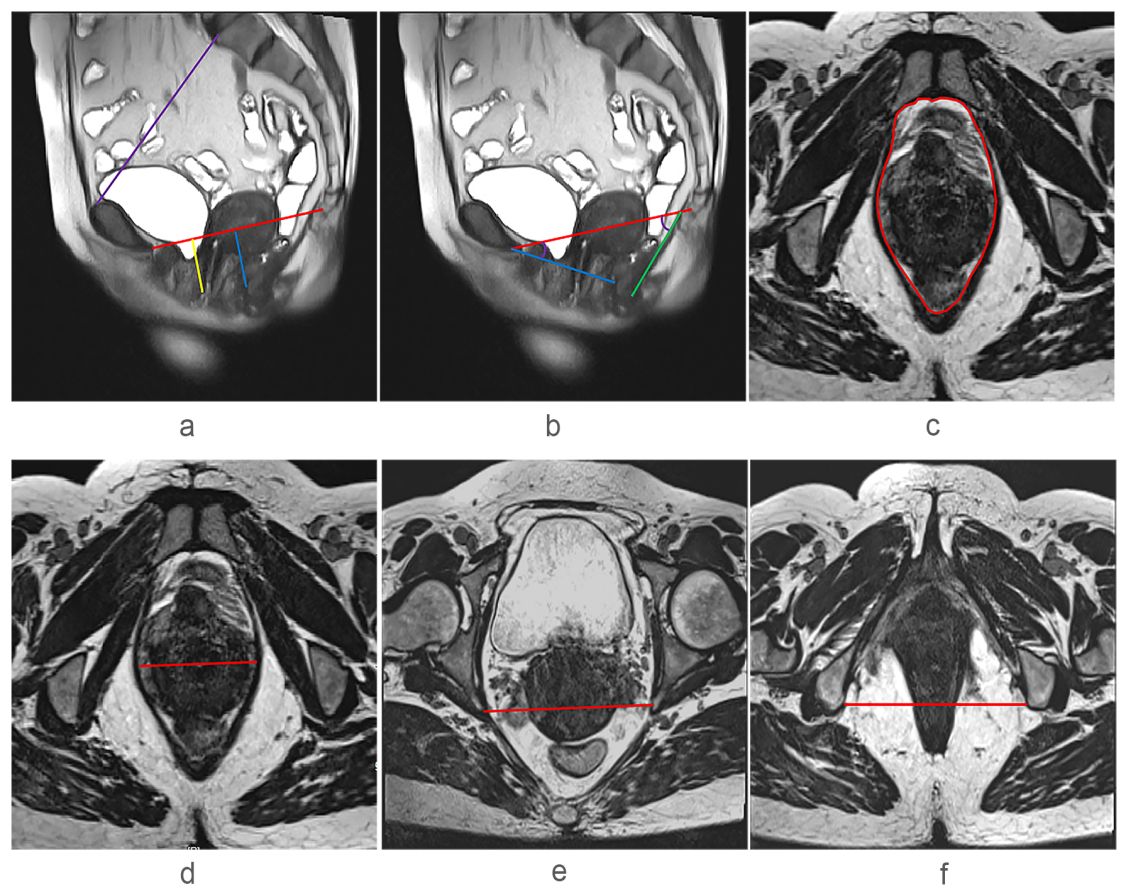
Figure 2 Placement of the reference lines of conventional MRI parameters. (a) The pubococcygeal line (PCL) (red), the M line (blue), the distance from the farthest end of the anterior cervical lip to the PCL (yellow), the anteroposterior diameter of the pelvic inlet (purple). (b) The levator ani hiatus anteroposterior diameter (AP) (blue), the H angle: between AP (blue) and PCL (red), the G angle: between the levator plate (green) and PCL (red). (c-d) The levator ani hiatus area (HA) and lateral diameter (LR). (e) The interspinous diameter. (f) The intertuberous diameter.
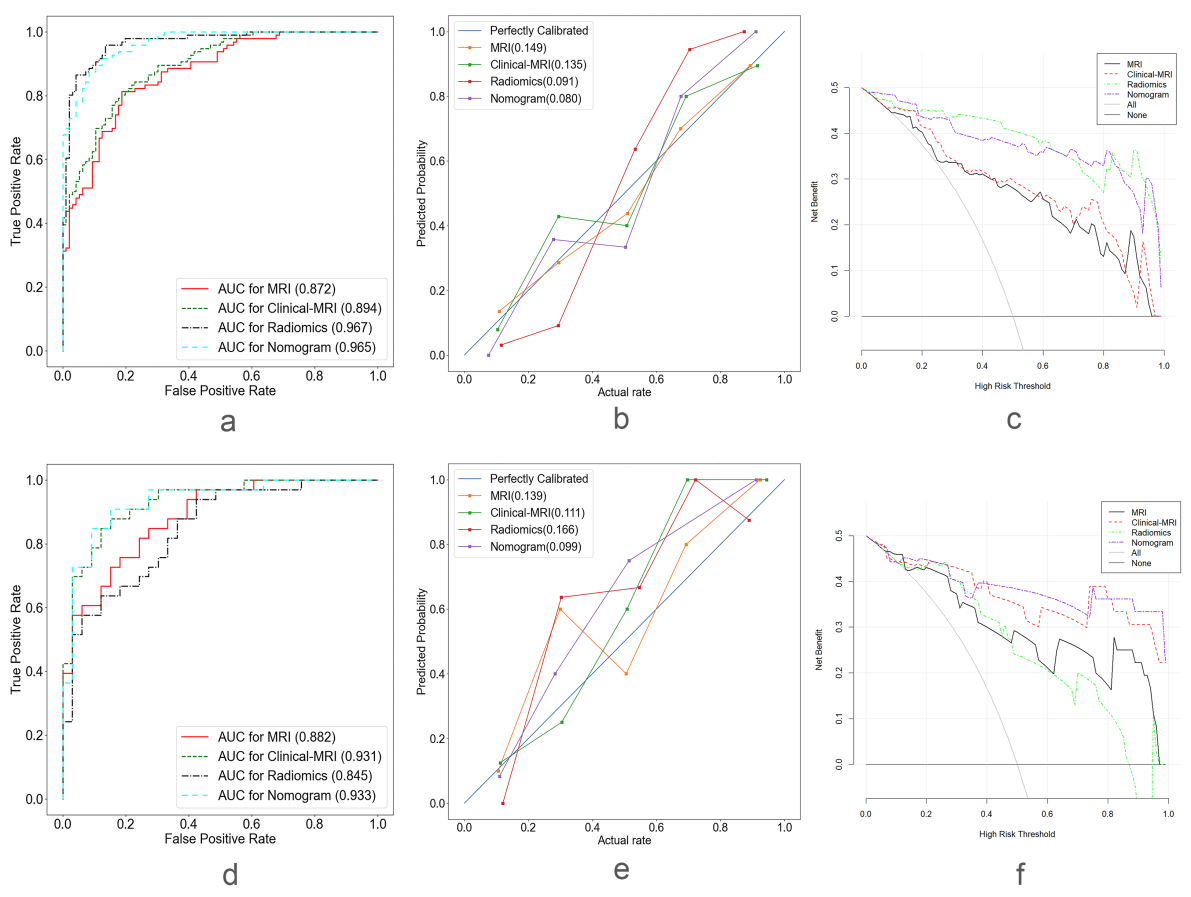
Figure 3 (a-c) The Receiver operator characteristic (ROC) curves, calibration curves and clinical decision curves (CDCs) of different models in the training group. (d-f) The Receiver operator characteristic (ROC) curves, calibration curves and clinical decision curves (CDCs) of different models in the validation group.

Table 1. Univariate and multivariate logistic regression analyses results of clinical and conventional MRI parameters

Table 2. Diagnostic efficiency and clinical benefit of different models in training group and validation group
DOI: https://doi.org/10.58530/2023/1661