1657
The importance of multi-reader assessment for external validation of prostate lesion classification models using quantitative mpMRI.1Centre for Medical Imaging, University College London, London, United Kingdom, 2Mathematics Research Center, Academy of Athens, Athen, Greece, 3Centre for Medical Imaging, Univeristy College London, London, United Kingdom, 4Radiology, Univeristy College London Hospital, London, United Kingdom, 5Department of Targeted Intervention, Univeristy College London, London, United Kingdom, 6National Pathology Imaging Co-operative, Leeds, United Kingdom
Synopsis
Keywords: Prostate, Machine Learning/Artificial Intelligence
Machine learning for classifying prostate mpMRI lesions may help reduce unnecessary biopsies. However, external validation with multiple scanners and readers is required before the clinical adoption of such models can be considered. Two readers validated a previously published and well-performing logistic regression model on an external cohort. The model performance was not generalisable and offered no advantage to using PSAd cut-offs, and there was marked variation in model score related to contour differences from different readers. This potential variability should be investigated in future models which use quantitative MRI.Introduction
1 in 2 men with a suspicious lesion on prostate mpMRI will undergo biopsy that turns out to be negative for clinically significant cancer. Machine learning methods may be applied to reduce the number of unnecessary biopsies but have so far not been clinically accepted due to a lack of external validation, including multi-scanner datasets and multi-reader assessment1. A previously published logistic regression (LR) model using mpMRI metrics has shown good performance for classifying peripheral zone lesions achieving a sensitivity/specificity of 90%/51% for clinically significant disease, however, this population was not representative of clinical practice and the impact of contour variation was not assessed2.Methods
An external validation cohort composed of a prospective cohort of consecutive patients suspected of prostate cancer who underwent prostate mpMRI and subsequent MR-targeted biopsy3. Patients were excluded if they had only transition zone lesions or significant artefacts that hampered the lesion's localisation. Two readers, blinded to histological outcome, manually contoured the same index lesions independently: a board-certified radiologist and a clinical fellow with seven and three years of experience in prostate mpMRI, respectively. Contours were drawn around the lesion where the reader deemed it most conspicuous on a single slice of the T2WI, ADC map and a single frame from the early DCE images. Readers also drew contours within the obturator internus muscle on the T2WI and early DCE imaging. Quantitative metrics were extracted using MIM version 7.1.4 (MIM Software inc.). Normalised mean T2WI signal intensity (T2-nSI), mean ADC value, and normalised mean early DCE signal intensity (DCE-nSI) were derived, as previously described, and predictive probability scores were calculated per patient using the LR model equation4. The previously reported threshold (≥0.14) was applied within the validation cohort to calculate the sensitivity and specificity for each reader to classify clinically significant disease (Gleason grade ≥3+4 or ≥4mm maximum cancer core length) and compared to two PSAd cut-off strategies (Likert ≥4 or PSAd ≥0.12/0.15). Model performance was assessed further with ROC-AUC and calibration plots. Inter-reader variability of the overall model score and individual model predictors were assessed with Bland-Altman plots.Results
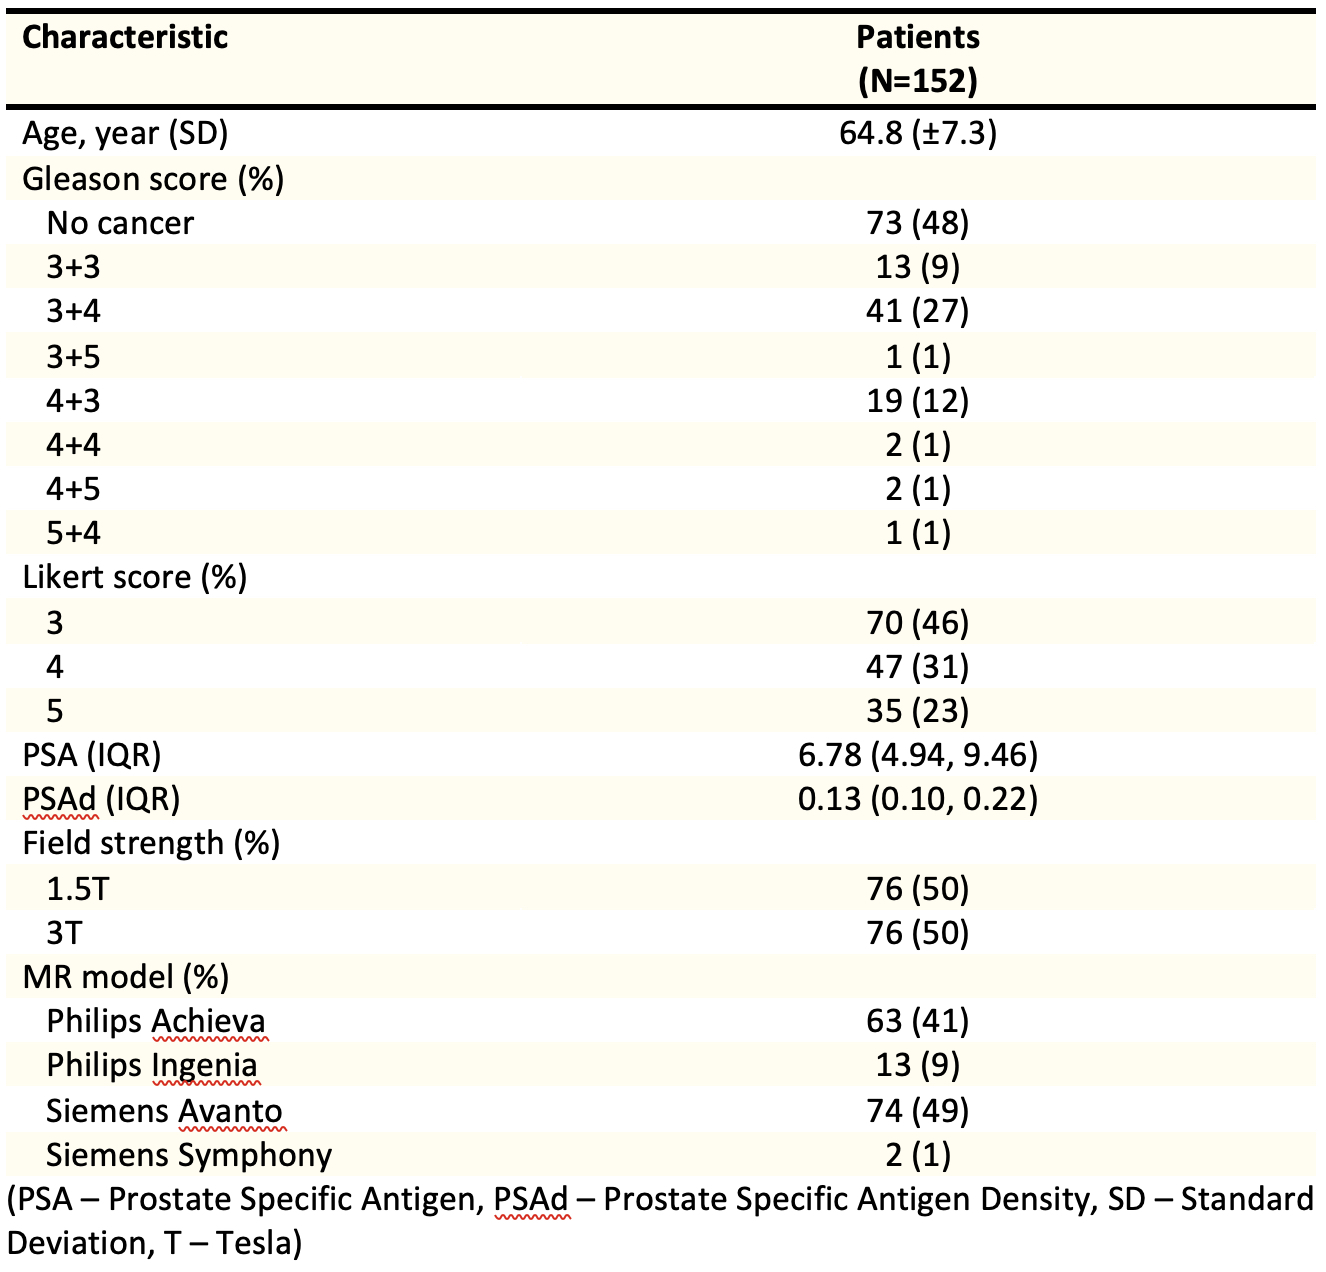
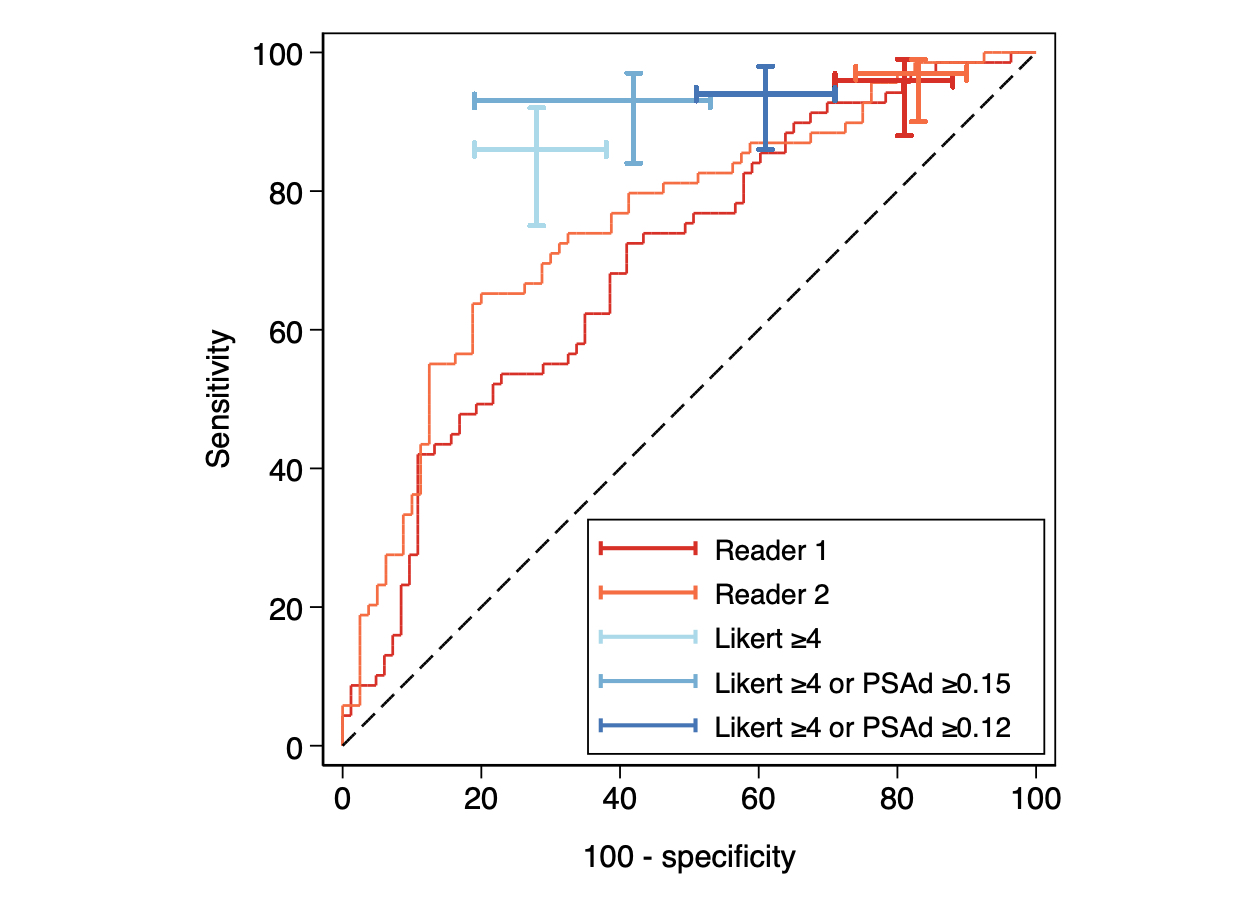
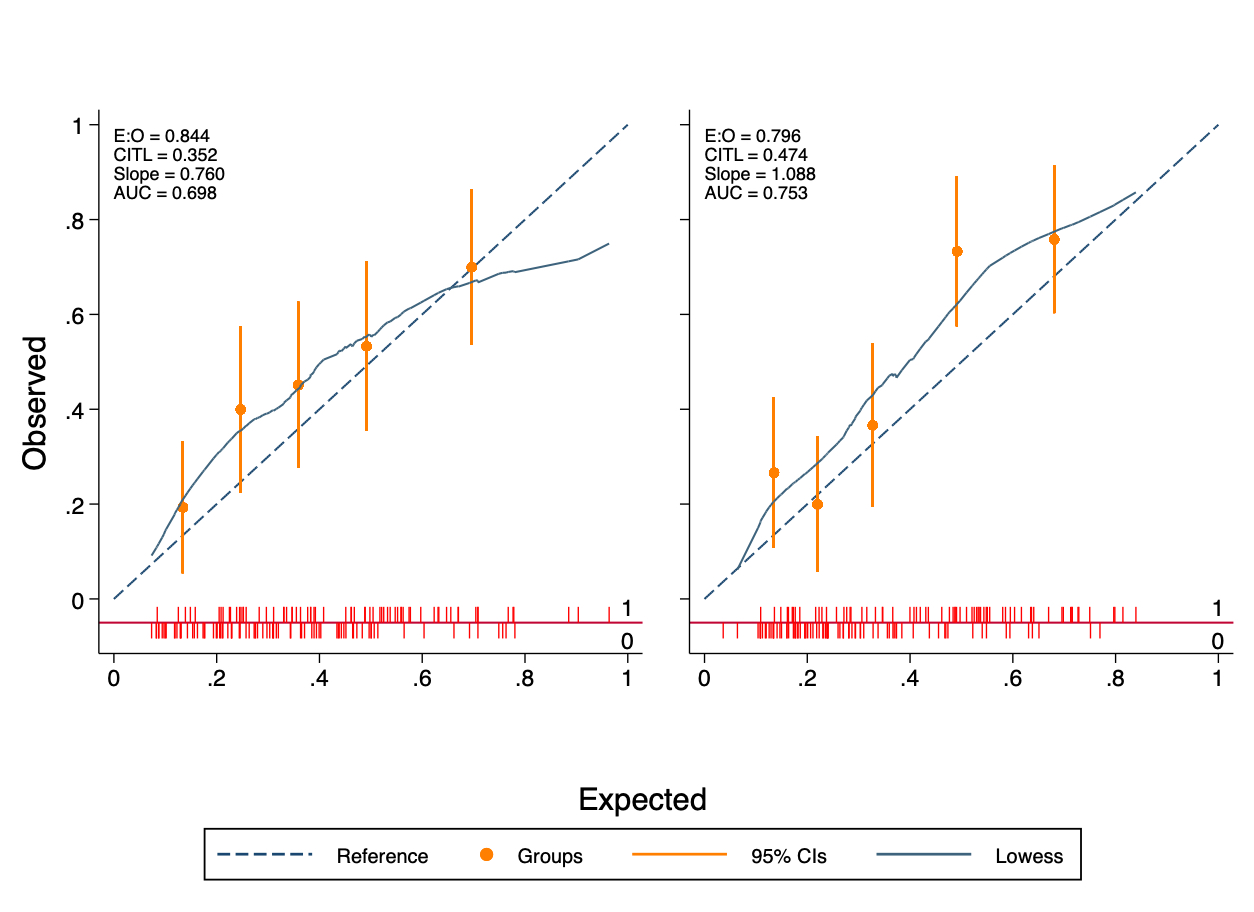
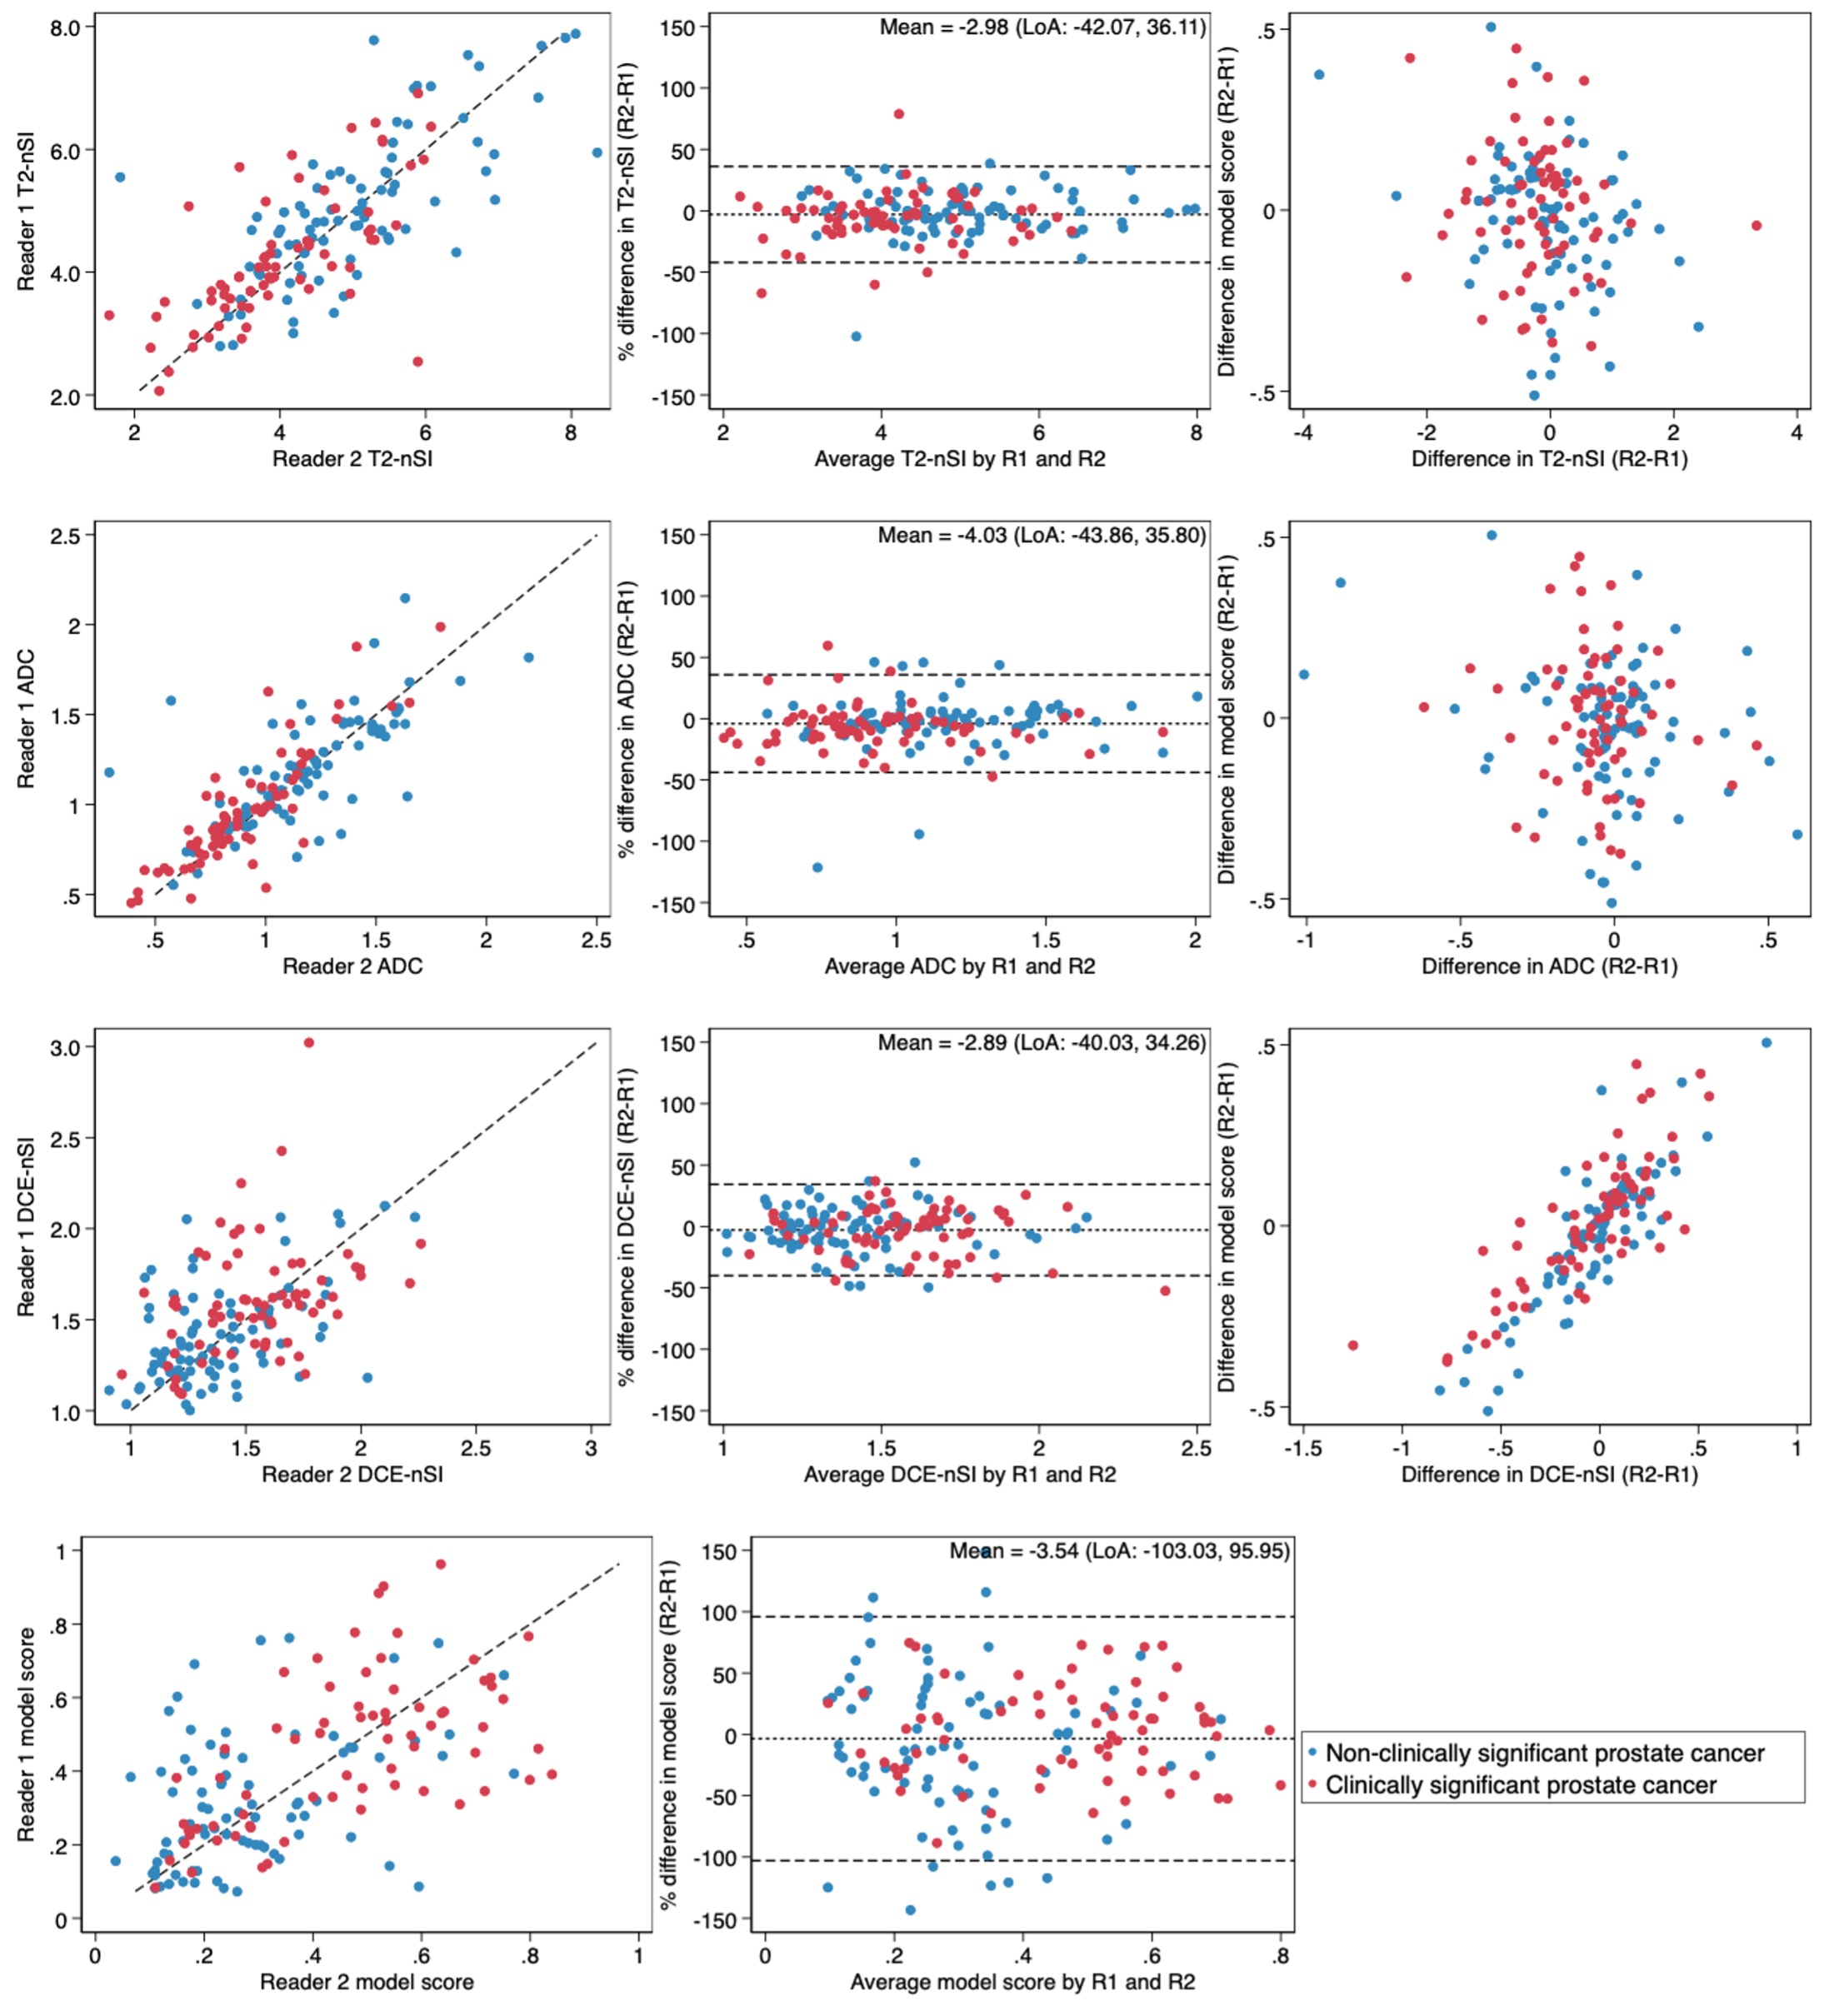
The final validation cohort consisted of 152 patients, with 69 (45.4%) testing positive for clinically significant cancer on biopsy. Demographics of the cohort are presented in Table 1. The sensitivity, specificity and AUC of the LR model using contours from each reader were 96%/19%/0.70 and 97%/17%/0.75, respectively (Figure 1). Using the PSAd cut-off strategies resulted in a sensitivity/specificity of 94%/39% and 93%/58% for PSAd≥0.12 and 0.15, respectively. For either reader, sensitivity was not significantly different to either PSAd strategy (p≥0.45), but specificity was significantly lower (p≤0.01). Calibration of the LR model scores was poor for both readers and tended to underestimate the risk of cancer (Figure 2). All three model predictors varied between readers with wide limits of agreement, with no apparent systematic bias between disease status or the mean predictor values. The resulting model score also suffered from clinically significant variation, with limits of agreement between -103.0. and 95.95% (Figure 3).Discussion
We conducted a multi-reader external validation of a previously published logistic regression model for classifying suspicious peripheral zone prostate lesions on mpMRI. Although the model maintained a high sensitivity for both readers, the specificity was poorer than previously reported and did not offer an advantage over PSAd cut-offs, as recommended5. Poor calibration meant that the predictive probability scores could not be confidently used to quantify the risk of significant cancer and tended to underestimate actual risk. This lack of generalisability and adequate calibration could be attributed to the change in cohort characteristics, notably the MR scanners and clinical setting. In addition, there was considerable variation in the value of individual predictors between readers, significantly affecting the overall model score. DCE-nSI differences between readers seemed to have the most substantial effect on the final model score (Figure 3). Inter-reader variability for prostate MRI lesion contouring is well known, and the compounded effect of using multiple-sequence contours has likely caused the variation in model score between readers6. As well as differences in the outline of contours, readers make additional subjective choices, including the selection of slice and time-point for DCE images. An example of reader contours in a discordant case is shown in figure 4. Future models may mitigate this by reducing required contours, using volumes rather than a single slice, or automated methods for lesion segmentation. Careful thought into the clinical application of models is required to reduce the impact of subjective factors influencing the model. Regardless of contouring methods, testing the reproducibility of radiomic markers from MRI is recommended at the model-building stage, both between readers and scanners, to improve the chances of generalisability7.Conclusion
We could not demonstrate good generalisable performance of a logistic regression model in a multi-scanner population, and it did not offer an advantage over clinically available PSAd cut-off strategies for reducing biopsies. There was marked variation between readers in the model predictors and overall score, highlighting the importance of external validation and testing the robustness of radiomic markers used in quantitative MRI with multi-reader studies, where subjective decisions such as contouring are required.Acknowledgements
No acknowledgement found.References
1. Syer T, Mehta P, Antonelli M, Mallett S, Atkinson D, Ourselin S, Punwani S. Artificial Intelligence Compared to Radiologists for the Initial Diagnosis of Prostate Cancer on Magnetic Resonance Imaging: A Systematic Review and Recommendations for Future Studies. Cancers. 2021; 13(13):3318. https://doi.org/10.3390/cancers13133318
2. Dikaios, N., Giganti, F., Sidhu, H.S. et al. Multi-parametric MRI zone-specific diagnostic model performance compared with experienced radiologists for detection of prostate cancer. Eur Radiol 29, 4150–4159 (2019). https://doi.org/10.1007/s00330-018-5799-y
3. Johnston E, Pye H, Bonet-Carne E, Panagiotaki E, Patel D, Galazi M, Heavey S, Carmona L, Freeman A, Trevisan G, Allen C, Kirkham A, Burling K, Stevens N, Hawkes D, Emberton M, Moore C, Ahmed HU, Atkinson D, Rodriguez-Justo M, Ng T, Alexander D, Whitaker H, Punwani S. INNOVATE: A prospective cohort study combining serum and urinary biomarkers with novel diffusion-weighted magnetic resonance imaging for the prediction and characterization of prostate cancer. BMC Cancer. 2016 Oct 21;16(1):816. doi: 10.1186/s12885-016-2856-2. PMID: 27769214; PMCID: PMC5073433.
4. Dikaios, N., Alkalbani, J., Abd-Alazeez, M. et al. Zone-specific logistic regression models improve classification of prostate cancer on multi-parametric MRI. Eur Radiol25, 2727–2737 (2015). https://doi.org/10.1007/s00330-015-3636-0
5. Penzkofer, T., Padhani, A.R., Turkbey, B. et al. Assessing the clinical performance of artificial intelligence software for prostate cancer detection on MRI. Eur Radiol 32, 2221–2223 (2022). https://doi.org/10.1007/s00330-022-08609-6
6. Schelb, P.,Tavakoli, AA., Tubtawee, T., et al. Comparison of Prostate MRI Lesion Segmentation Agreement Between Multiple Radiologists and a Fully Automatic Deep Learning System. Fortschr Röntgenstr 2021; 193: 559–573
7. Metrology Standards for Quantitative Imaging Biomarkers Daniel C. Sullivan, Nancy A. Obuchowski, Larry G. Kessler, David L. Raunig, Constantine Gatsonis, Erich P. Huang, Marina Kondratovich, Lisa M. McShane, Anthony P. Reeves, Daniel P. Barboriak, Alexander R. Guimaraes, Richard L. Wahl, and For the RSNA-QIBA Metrology Working Group Radiology 2015 277:3, 813-825
Figures