1656
Quantitative 3D tumor enhancement on contrast-enhanced MR imaging in patients with HCC after TACE: a consistency evaluation
Xu Hua Gong1, Lei Lv2, and Li Jun Qian1
1Radiology, Renji Hospital, Shanghai Jiao Tong University, School of Medicine, Shanghai, China, 2ShuKun (BeiJing) Technology Co., Ltd., Beijing, China
1Radiology, Renji Hospital, Shanghai Jiao Tong University, School of Medicine, Shanghai, China, 2ShuKun (BeiJing) Technology Co., Ltd., Beijing, China
Synopsis
Keywords: Liver, Cancer
Quantitative European Association for the Study of the Liver (qEASL) can better evaluate the therapeutic efficacy of hepatocellular carcinoma (HCC) after transcatheter arterial chemoembolization (TACE). Conventional qEASL is often achieved semi-automatically, which is tedious, labor-intensive, and time-consuming. In this study, we provide and assess an automatic qEASL approach based on a VoxelMorph and Faster R-CNN framework named Shukun PortalDoc. We compared the consistency of the proposed method with the widely accepted semi-automatic software (MultiModality Tumor Tracking, Philips IntelliSpace Portal, Philips healthcare) in assessing qEASL of hepatocellular carcinoma after TACE.Introduction
For patients with hepatocellular carcinoma (HCC) that are not suitable for surgery, transcatheter arterial chemoembolization (TACE) is an effective method to control tumor progression[1-2]. In recent years, qEASL has been proposed to accurately evaluate the curative effect of TACE on hepatocellular carcinoma [3]. The qEASL can be measured semi-automatically by commercial software and the specific method is: 1). Choose pre-contrast and late arterial phase images, and the software will automatically register the images. 2). Manually optimize the 3D volume-of-interest (VOI) of the tumor. 3). Select the normal liver background region-of-interest (ROI). 4). The software will automatically subtract the image, and the part of the tumor VOI with a higher enhancement degree than the background is considered the "active" tumor area. [4]. However, manual annotation of ROI made the semi-automatic method tedious and time-consuming. During the automated qEASL evaluation, the manual sketching step in the second step can be fully automatic, which makes the whole process faster and more efficient. In this study, a digital liver AI software was developed by Shukun (Beijing) Technology Co., Ltd and one of the functions of the software is automatic evaluation of qEASL. The consistency of evaluation results between semi-automatic and automatic evaluation of qEASL was analyzed.Methods
This study was approved by the institutional review board with informed consent waived. We searched the PACS for cases who underwent TACE for hepatocellular carcinoma at our institution between January 2018 and December 2021 and had contrast-enhanced MR imaging within 90 days of treatment. Tumors of LR-M and LR-TIV categories, cases with more than 3 tumors in the liver, and cases with a history of prior liver surgery were excluded, which resulted in 75 cases (101 tumors) being enrolled. Liver MR imaging is performed using a variety of 3.0T scanners (Signa HDXt, GE Healthcare; Ingenia, Philips Healthcare; MAGNETOM Skyra, and Prisma, Siemens Healthcare; and uMR 780, United imaging) using similar protocol settings, with a typical value of 2-3mm slice thickness.The semi-automatic analysis of the viable tumor was performed on commercially available software (MultiModality Tumor Tracking, Philips IntelliSpace Portal, Philips Healthcare) by a radiologist with 10 years of experience. Pre-contrast and arterial phase images were selected, and the software performed automatic registration of the 2 sets of images, based on which the 3D ROI tool was used to outline the tumor. ROI in the ipsilateral background “healthy” liver was marked as reference point to generate 3D qEASL measurements of the tumor. For automatic qEASL analysis performed in Shukun PortalDoc, all the MRI images of the patient are registered to the enhanced images by a VoxelMorph based model firstly. Then a Faster R-CNN based model was introduced for the detection of the tumor region. Detected tumor region and grey level information of different MRI phase images were finally merged and qEASL was obtained. Dice coefficient, IOU, and Hausdorff distance (HD) between the tumor region derived from two methods were analyzed. The processing time of the two methods was also recorded.
Results
Figure 1 shows the workflow of this study. For semi-automatic and automatic methods, the Dice coefficient, IoU, HD are 0.54, 0.44, and 6mm, respectively (Table 1). The representative results of the two methods are presented in Figure 2. The average processing time for semi-automatic qEASL evaluation was 3.2 ± 0.5 mins. When it comes to automatic qEASL evaluation, the processing time was 20 ± 0.19 seconds for each data set on a personal computer with 16GB of system memory and a graphics processing unit with 8 GB of video memory (Quadro M2000MNVIDIA, Santa Clara, CA, USA).Discussion
qEASL can accurately identify the viable component of hepatocellular carcinoma after TACE, according to a previous study on radiology-pathology correlation. It was also found that qEASL can more accurately differentiate tumor responders from non-responders compared to other 1D or 2D tumor assessment methods. [5-6]. The major finding of this study is that we present an automated and efficient method for qEASL evaluation of patients with HCC after TACE. The performance of this automatic software (Shukun PortalDoc) in qEASL evaluation was compared with a semi-automatic software (Philips IntelliSpace Portal). Dice coefficient, IOU, HD demonstrates that the two software have high consistency. The computation time of Shukun PortalDoc based qEASL evaluation was much shorter than the Philips IntelliSpace Portal. This results indicate that the Shukun PortalDoc based qEASL evaluation has the potential to assist routine radiologists' diagnosis, especially helping to improve the concordance of ROI segmentation which might affect the subsequent evaluation of qEASL.Conclusion
Our study provides an automatic software-based qEASL evaluation for patients with HCC after TACE, based on which the processing time can be greatly saved.Acknowledgements
No acknowledgement found.References
- Zhu K, Huang J, Lai L, et al. Medium or large hepatocellular carcinoma: sorafenib combined with transarterial chemoembolization and radiofrequency ablation. Radiology. (2018) 288:300–307.
- Fako V, Wang XW. The status of transarterial chemoembolization treatment in the era of precision oncology. Hepat Oncol. (2017) 4:55–63.
- Lei Z, Li J, Wu D. et al. Nomogram for preoperative estimation of microvascular invasion risk in hepatitis B virus-related hepatocellular carcinoma within the Milan criteria. JAMA Surg. (2016) 151:356–363.
- Lin MingDe, Olivier Pellerin, Nikhil Bhagat, et al. Quantitative and Volumetric European Association for the Study of the Liver and Response Evaluation Criteria in Solid Tumors Measurements: Feasibility of a Semiautomated Software Method to Assess Tumor Response after Transcatheter Arterial Chemoembolization. Journal of Vascular and Interventional Radiology. (2012) 23 (12): 1629–37.
- Chapiro J, Wood LD, Lin M, et al. Radiologic-pathologic analysis of contrast-enhanced and diffusion-weighted MR imaging in patients with HCC after TACE: diagnostic accuracy of 3D quantitative image analysis. Radiology. (2014) 273:746–758.
- Arun Chockalingam, Rafael Duran, Jae Ho Sohn, et al. Radiologic-pathologic analysis of quantitative 3D tumour enhancement on contrast-enhanced MR imaging: a study of ROI placement. Eur Radiol. (2016) 26(1): 103–113.
Figures
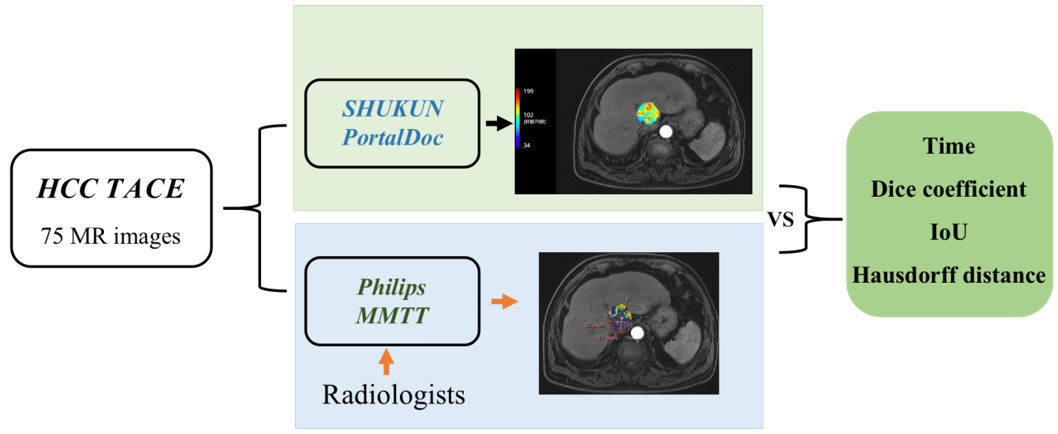
Figure
1. Workflow of this study.
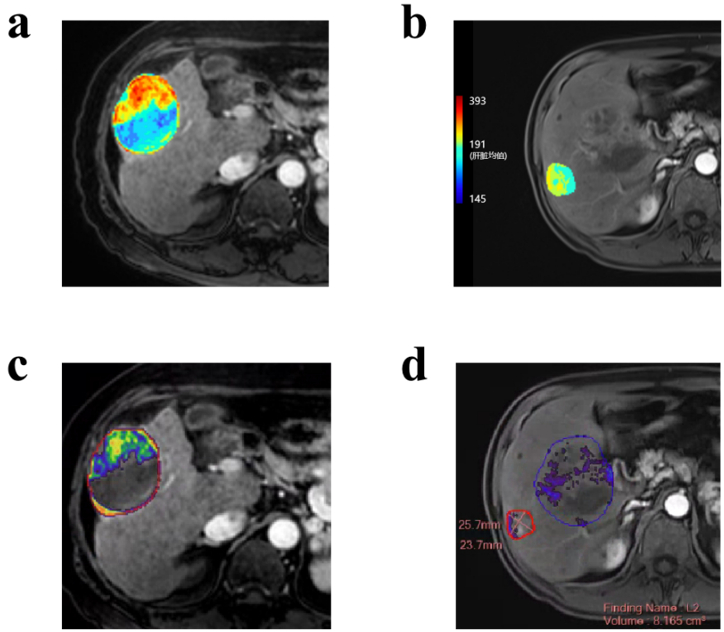
Figure 2. Representative results of semi-automatic and automatic
methods. (a) and (c) were the same MR images
based ROIs segmentation through automatic and semi-automatic methods, respectively.
(b)
and (d) were the same MR images based ROIs segmentation
through automatic
and semi-automatic methods, respectively.
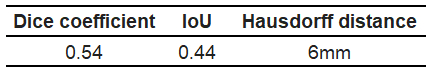
Table 1. The Dice coefficient, IoU, and HD of semi-automatic and automatic
methods.
DOI: https://doi.org/10.58530/2023/1656