1651
A Fully Automatic Data Processing Method for MRI T2* Relaxometry of Iron Loaded Liver1School of Biomedical Engineering, Southern Medical University, Guangzhou, China
Synopsis
Keywords: Relaxometry, Liver, T2*, liver iron content
MRI T2* relaxometry is a reliable method for assessing liver iron overload. To develop a fully automatic T2* relaxometry data processing method for assessing liver iron overload, we promoted a semi-automatic parenchyma extraction to an automatic approach by introducing a modified TransUNet on R2* map for the segmentation of whole liver. The proposed method showed excellent liver segmentation performance on the internal and external test sets and yielded T2* measurements highly consistent with those by the semi-automatic method. This fully automatic approach will enable an efficient and reliable measurement of liver T2* for assessing hepatic iron content in clinical practice.Introduction
Secondary hemochromatosis is an iron overload disorder that can cause damage to multiple organs1. In particular, excess iron is initially and predominantly deposited in the liver2,3. Hence, an accurate and reliable assessment of hepatic iron concentration (HIC) is critical for the monitoring of iron chelation therapy in transfusion-dependent patients4. Magnetic resonance imaging T2* relaxometry is a widely-used method for assessing liver iron overload5-12. Several computer-aided methods have been proposed to efficiently measure the T2* value from liver T2* multiecho images13-18. Feng et al.19 proposed a semi-automatic liver parenchyma extraction (SAPE) method, but it still required a manual segmentation of the whole liver from images before parenchyma extraction. This study aims to promote the SAPE method to a fully automatic one by replacing the manual liver segmentation with a deep learning-based method. We validated the proposed approach on three clinical datasets from transfusion-dependent patients with a wide range of HIC.Method
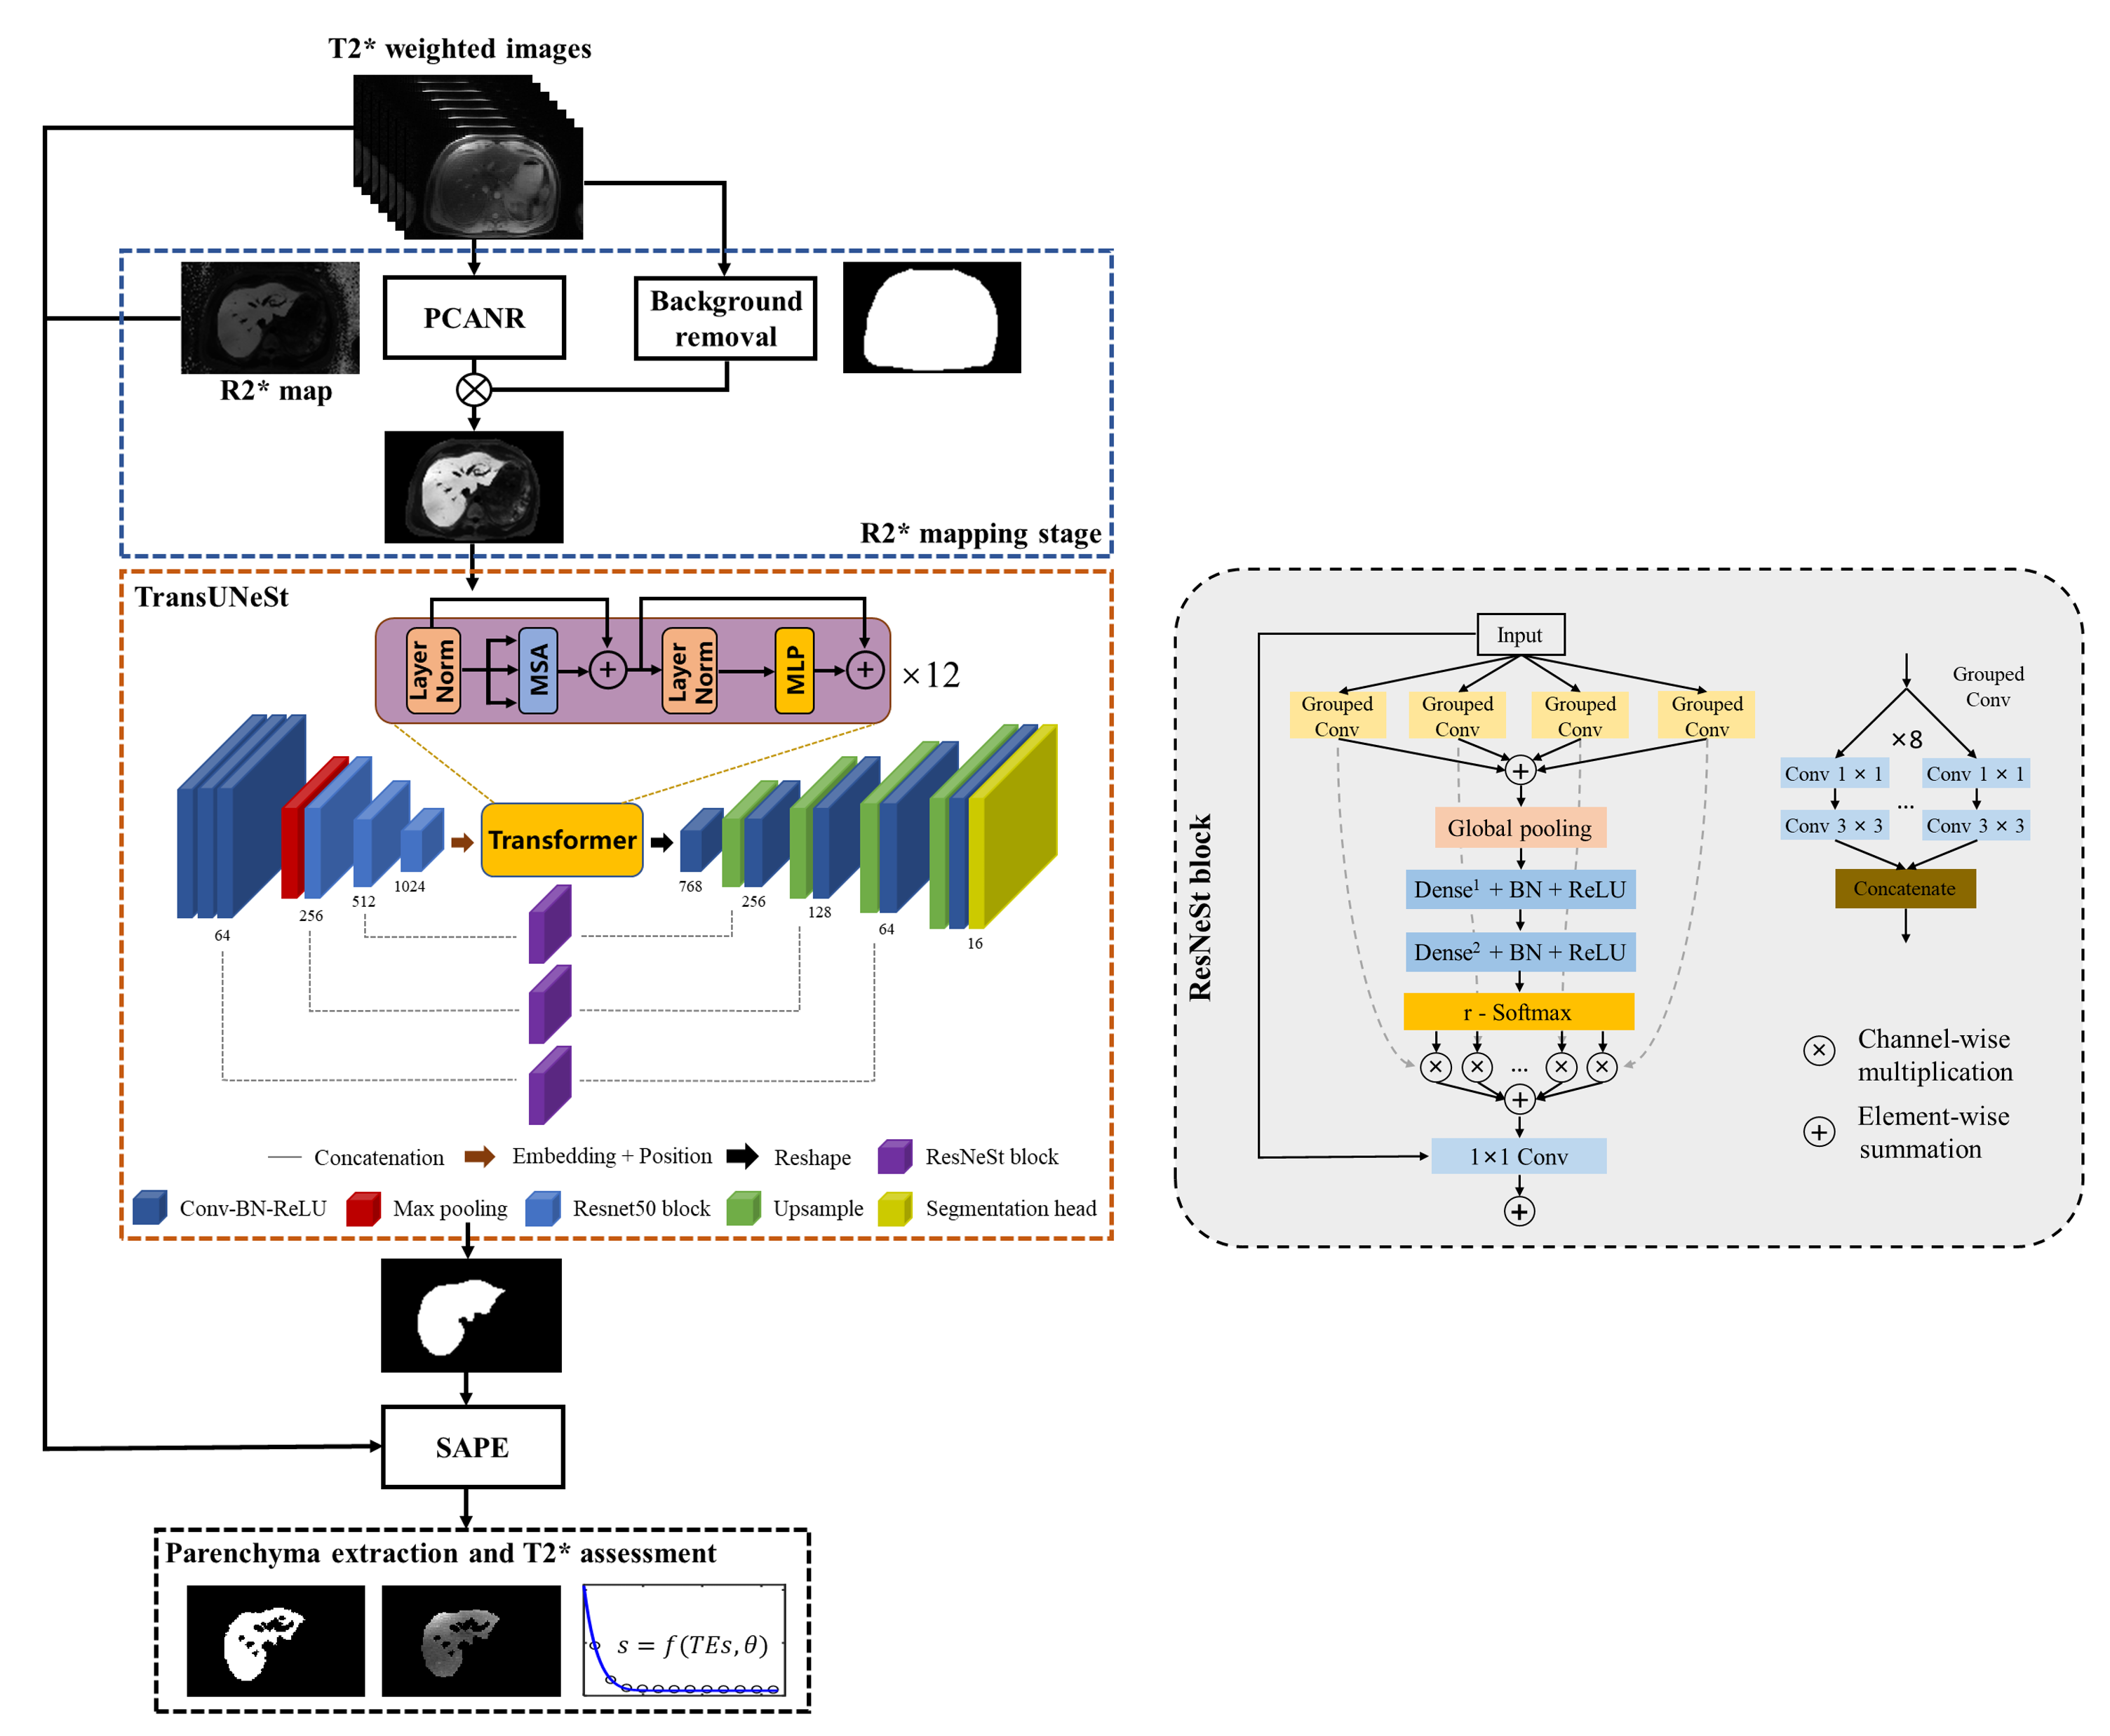
The overall architecture of the proposed fully automatic parenchyma extraction (FAPE) framework was illustrated in Figure 1. This framework mainly consisted of three main stages: R2* mapping, whole liver segmentation, and parenchyma extraction. In the first stage, the R2* map was calculated from the multiecho images using the PCANR algorithm20. At the same time, a network with a popular 2D U-Net architecture21 was trained and used to remove background from the R2* map. In the second stage, a modified TransUNet22 was developed for automatic whole liver segmentation. In the parenchyma extraction stage, the liver parenchyma and T2* value were obtained by using method as in the SAPE method19. The framework was fully automatic without manual intervention. We proposed a modified TransUNet by introducing split attention mechanism, named TransUNeSt, for the whole liver segmentation. The network architecture was presented in the orange dashed box in Figure 1, which was mainly consisted of a CNN-Transformer hybrid encoder and a cascaded upsampler. Inspired by the channel attention mechanism, we added ResNeSt blocks23 before the skip connections. The ResNeSt block was mainly composed of feature map grouping and segmentation attention operations to selectively emphasize informative features and suppress less useful ones, and its detailed structure was shown in the right of Figure 1.Result
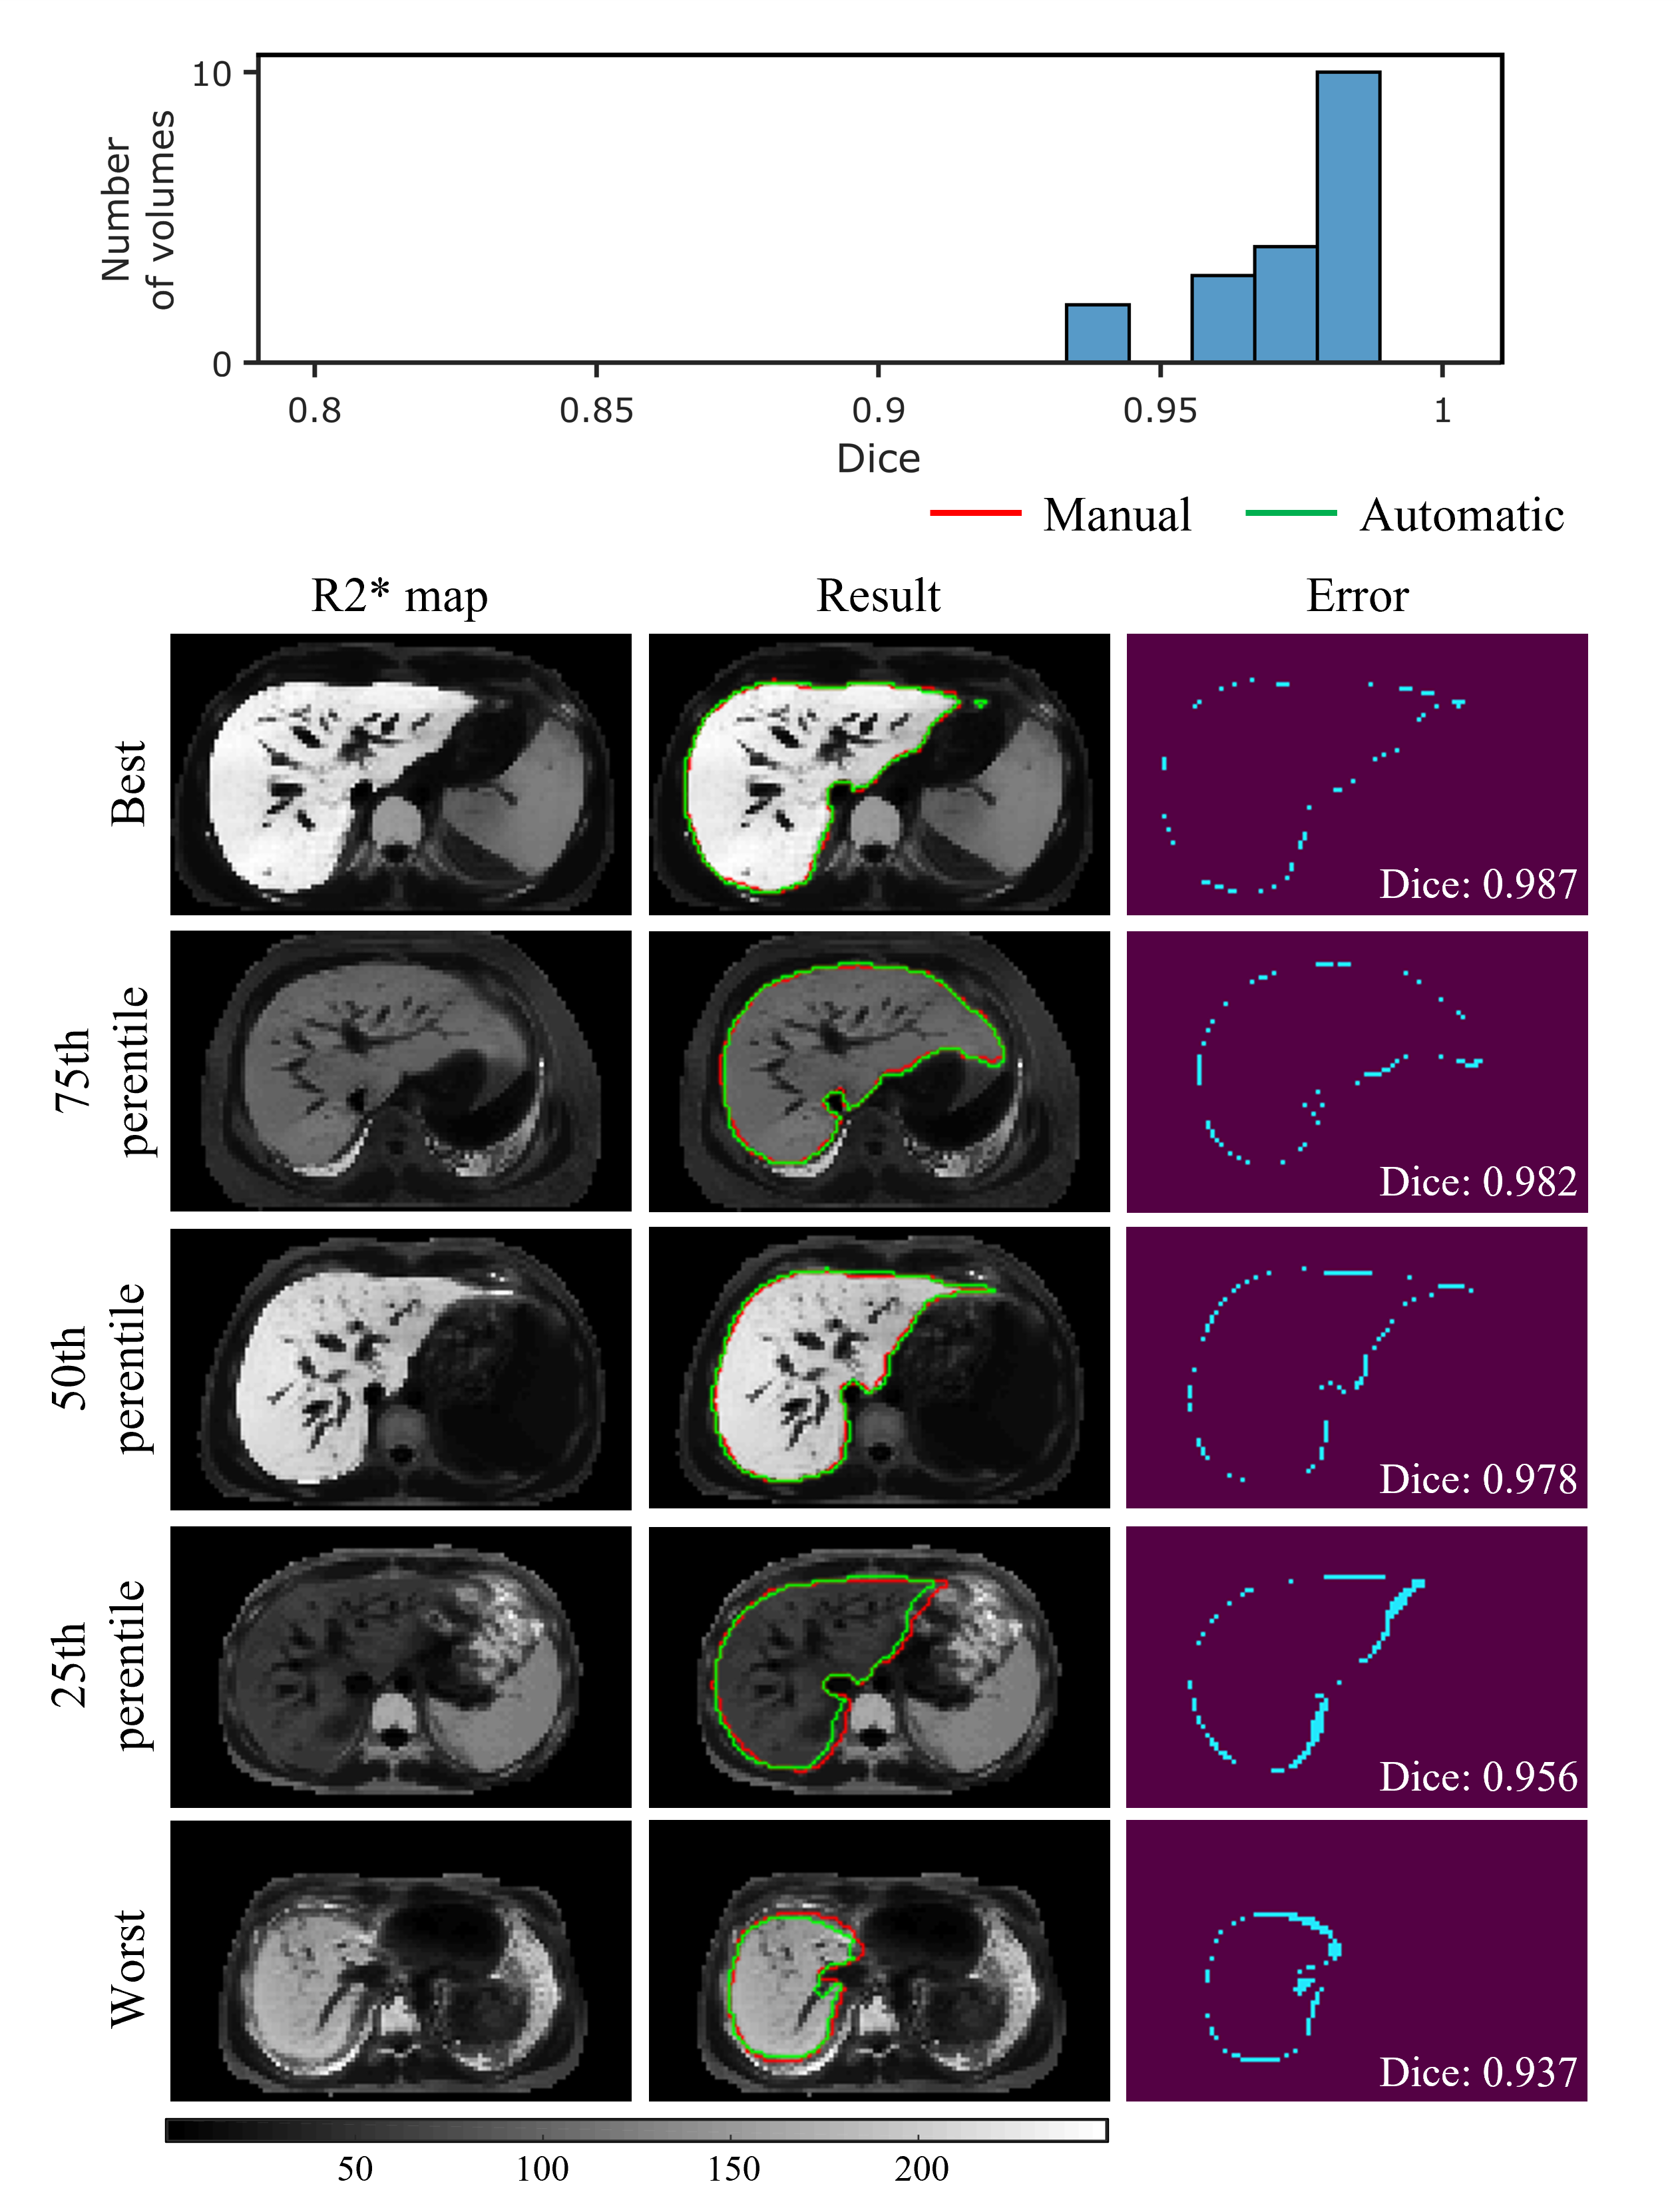
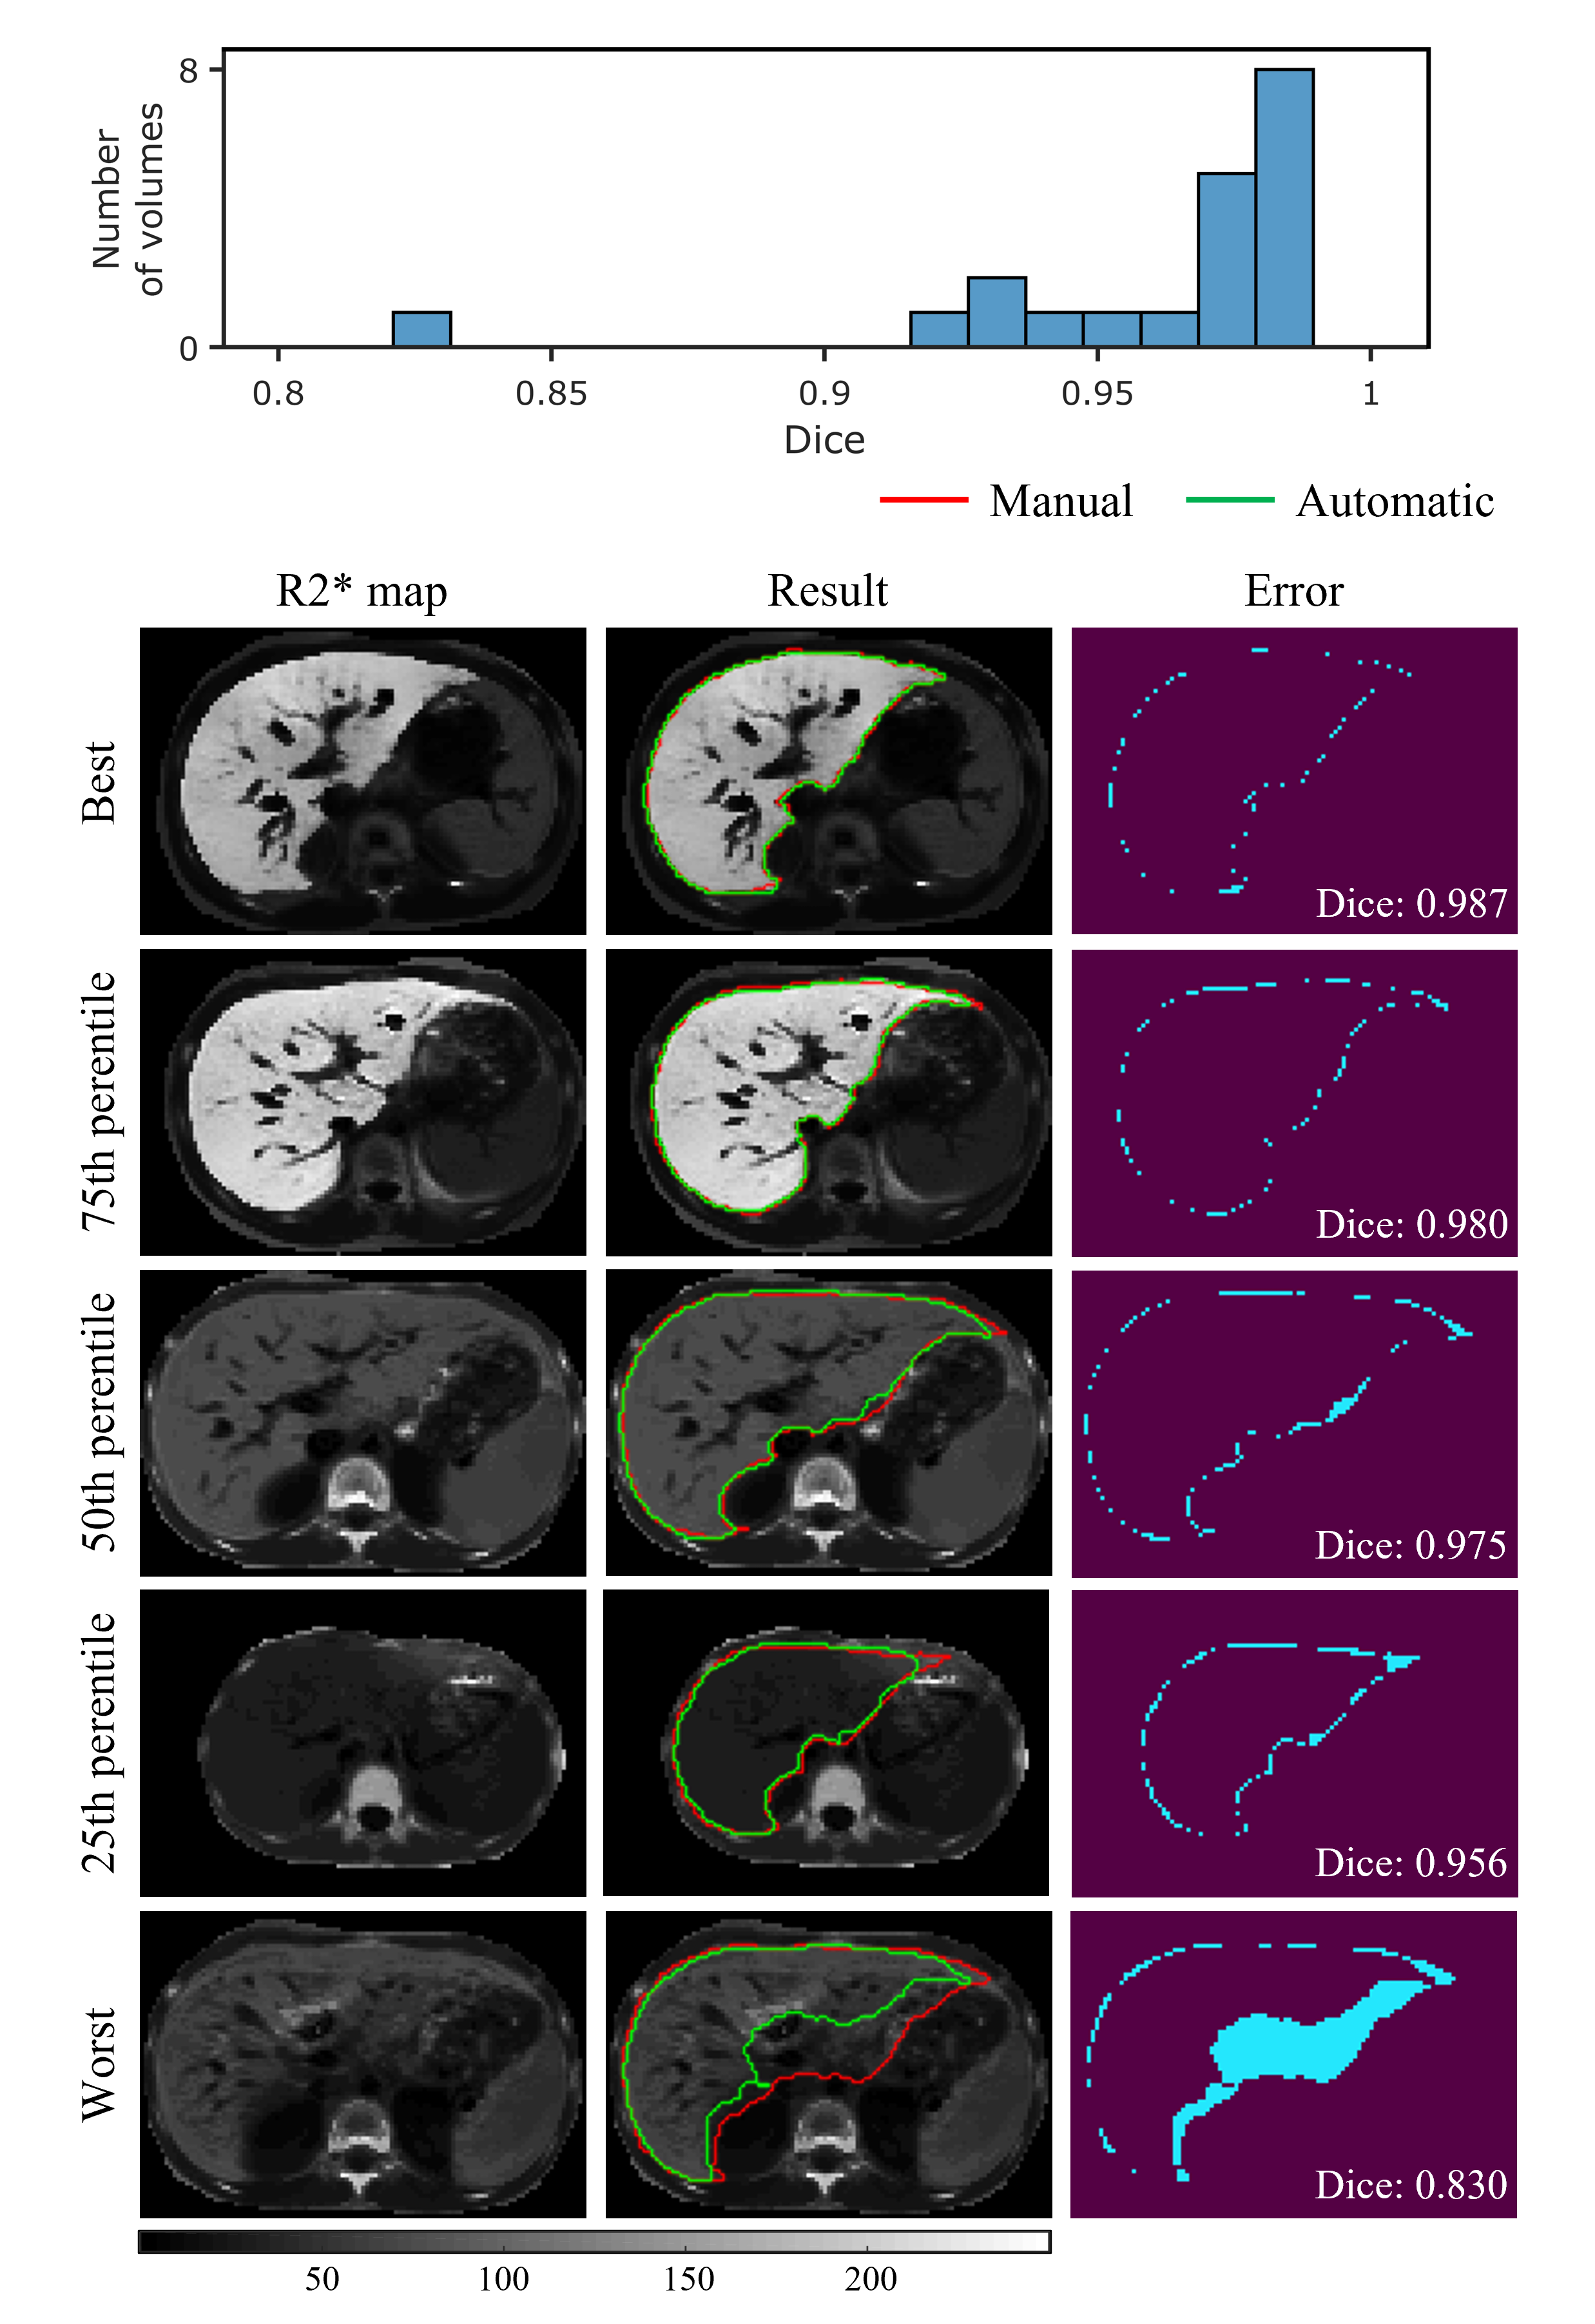
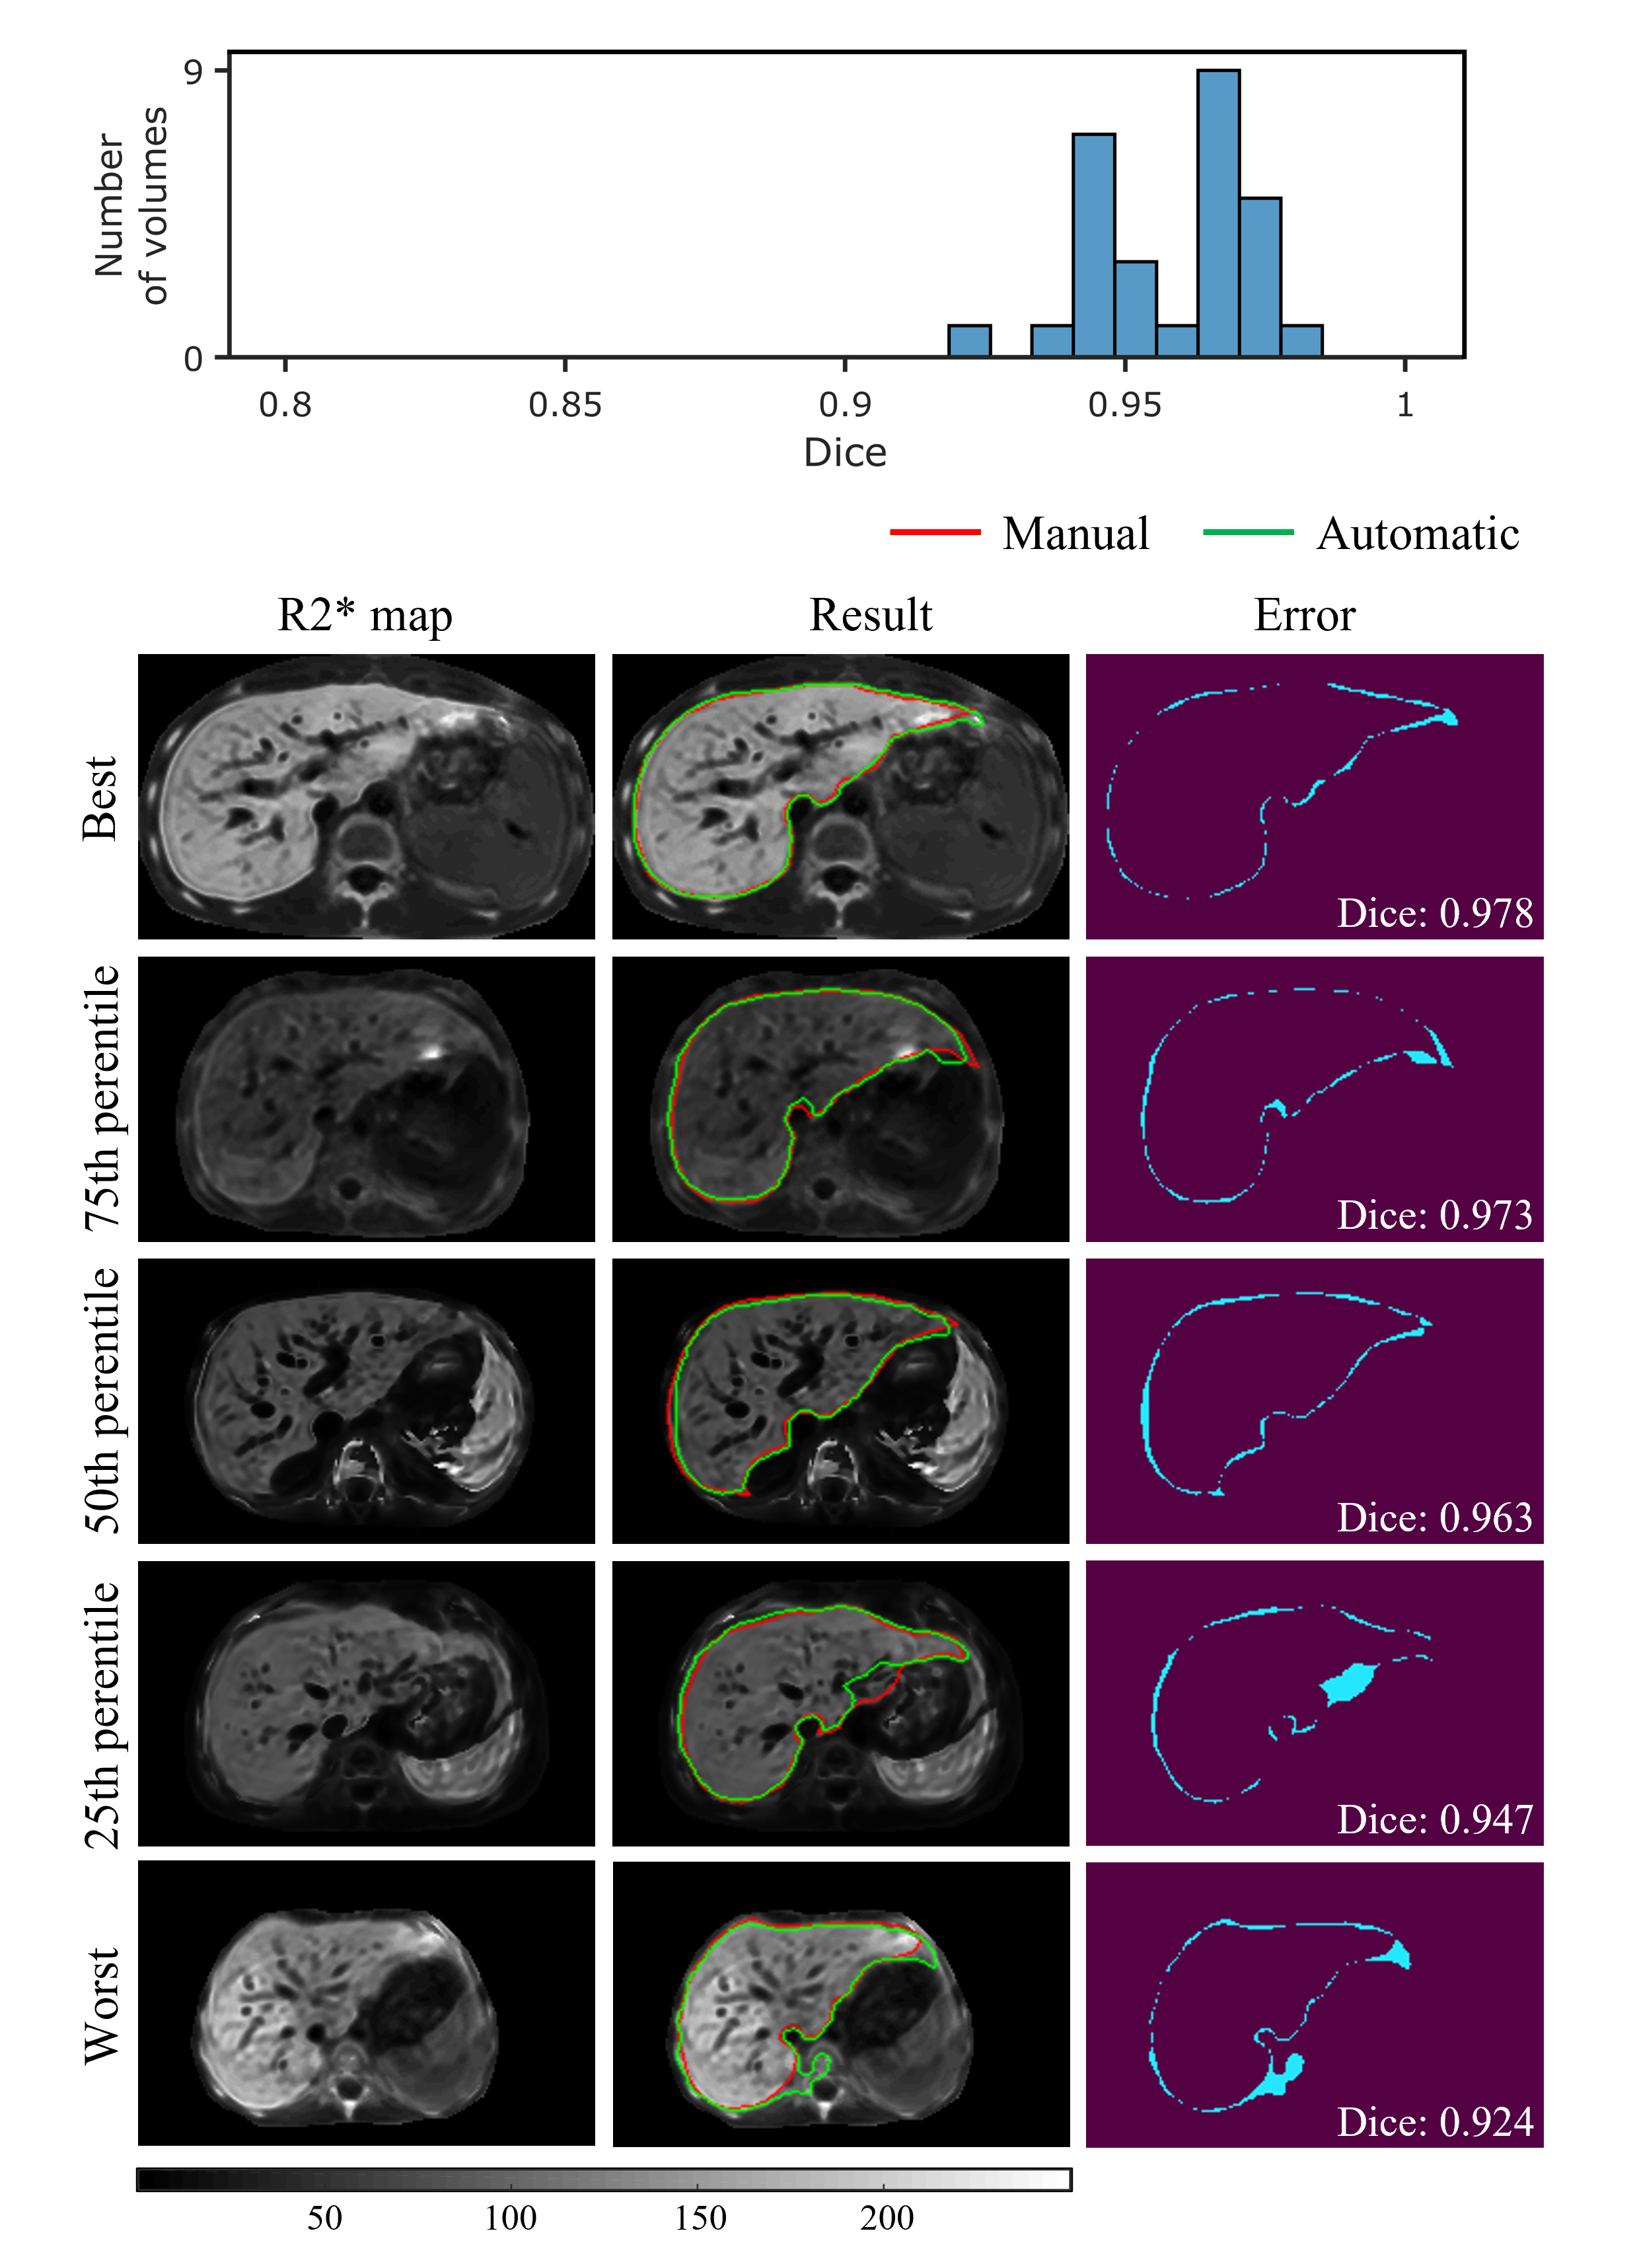
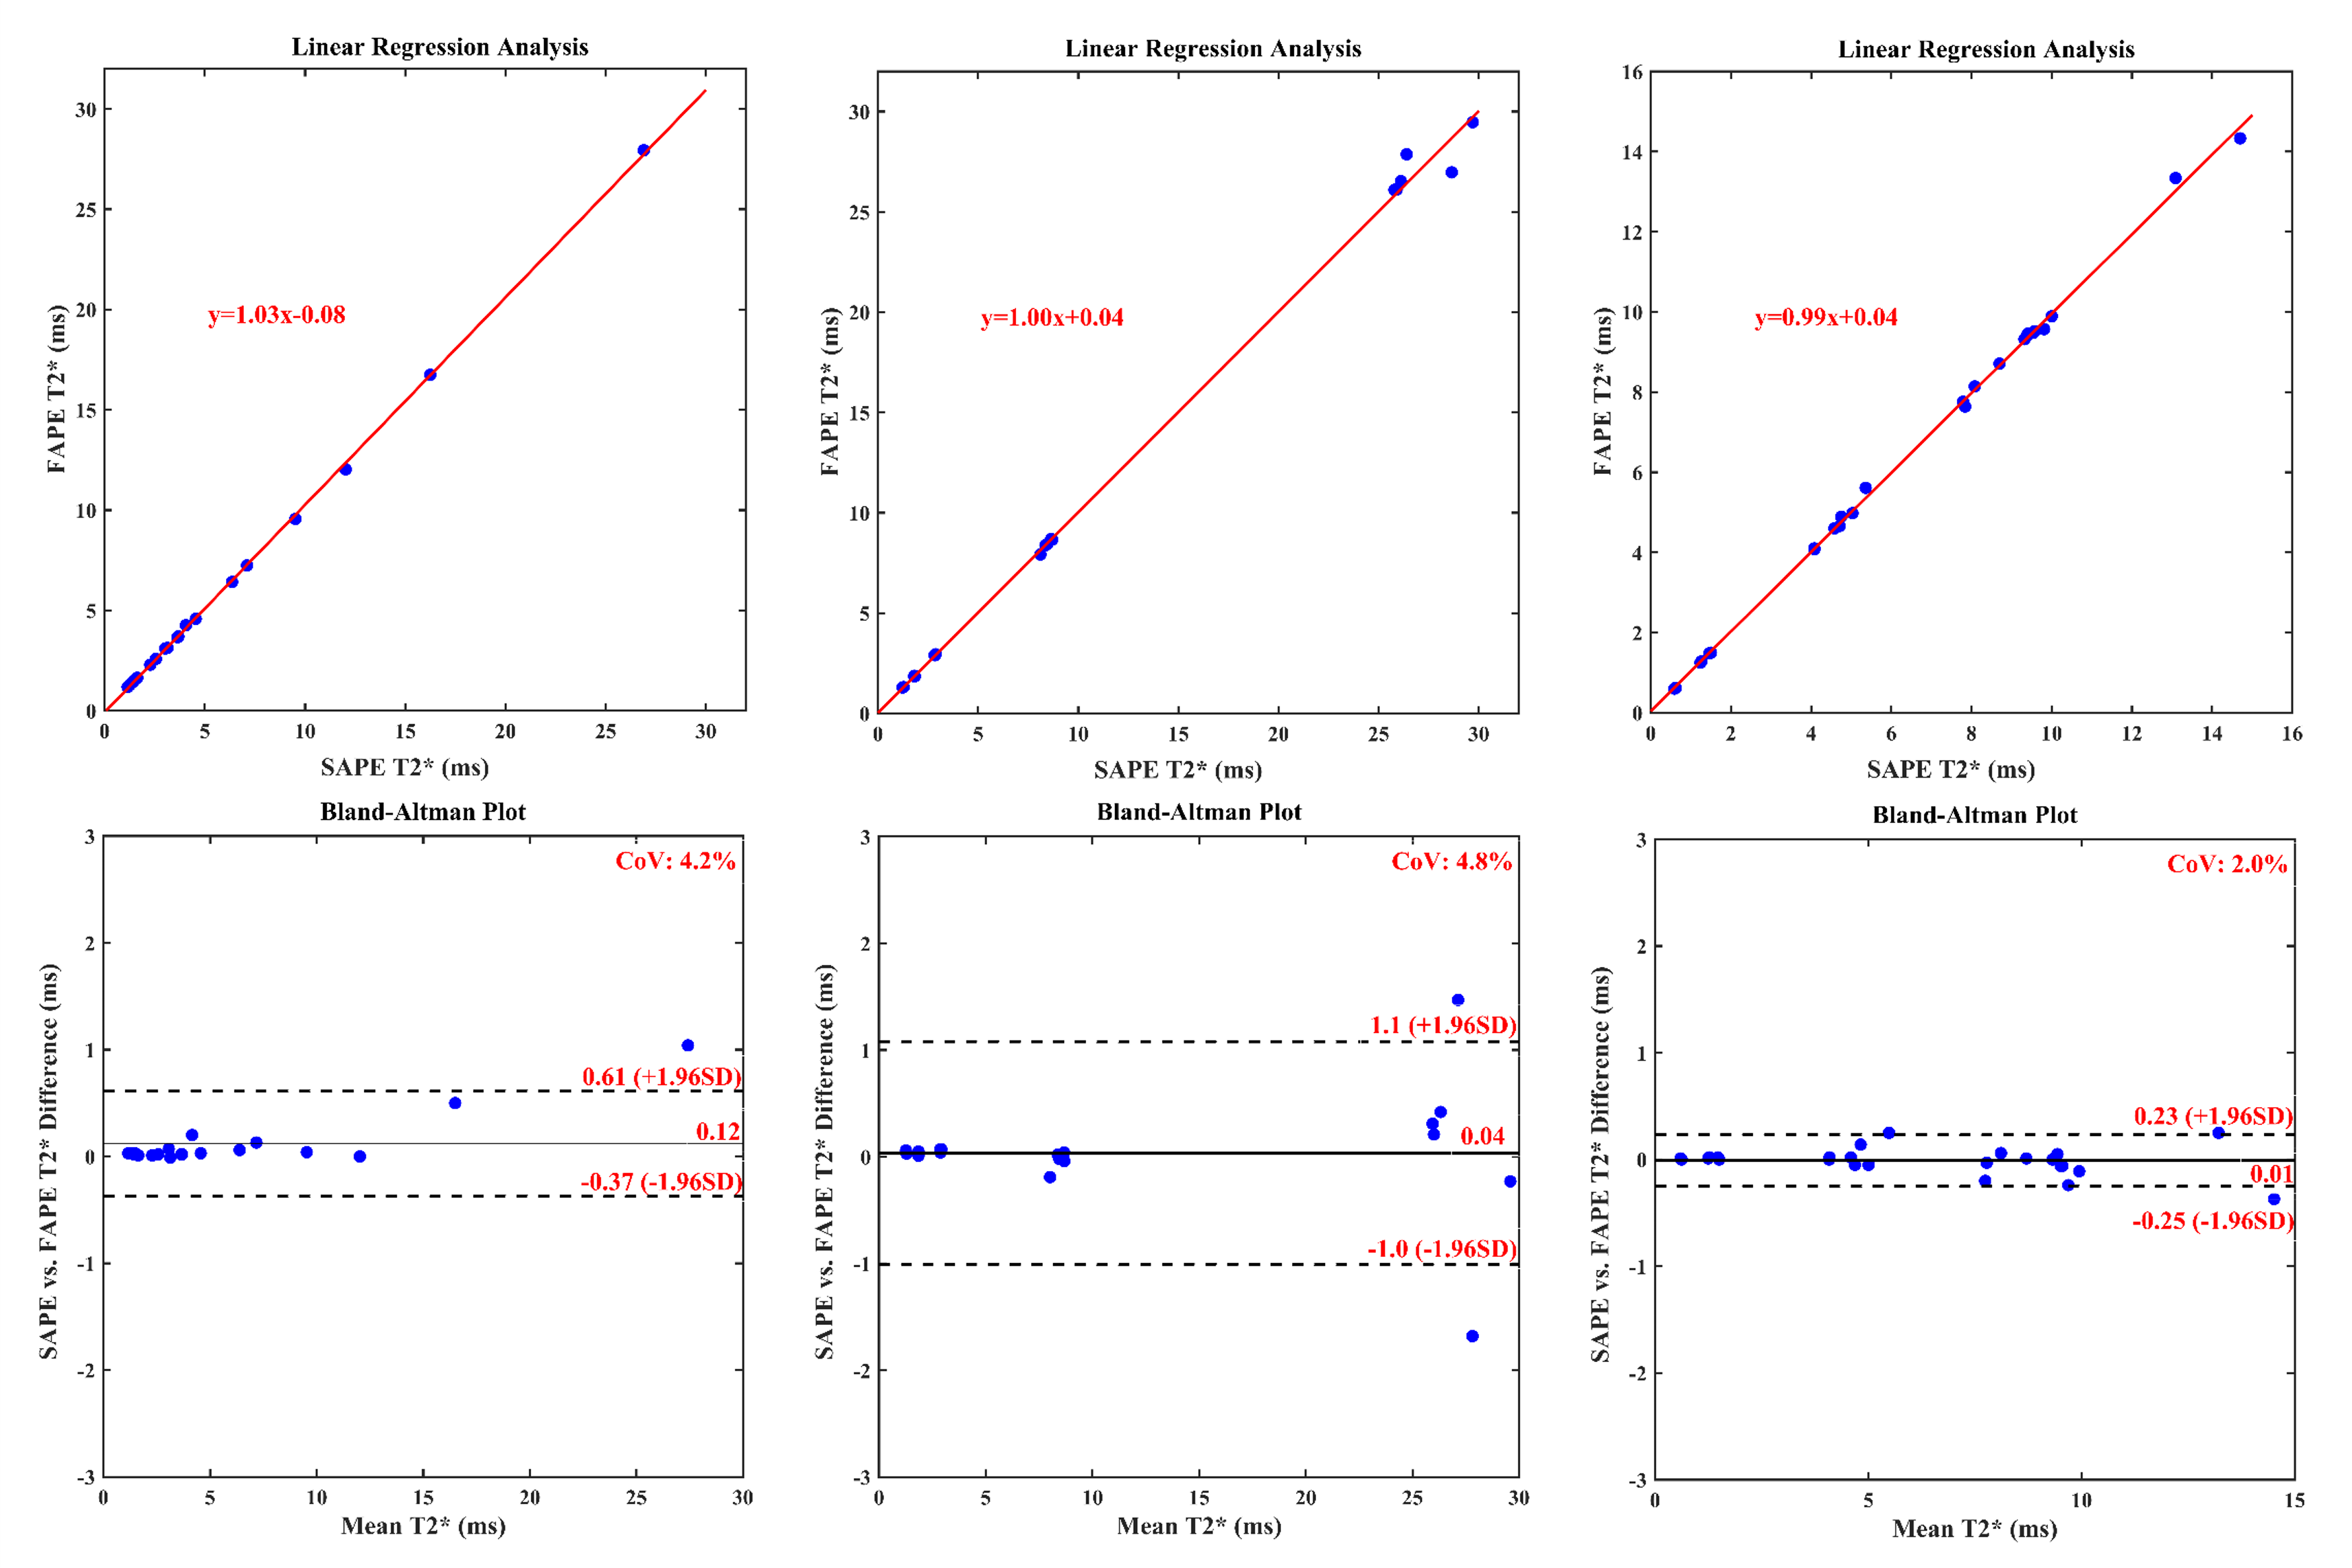
The results of automatic whole liver segmentation using the proposed TransUNeSt were compared with those of manual segmentation. The mean Dice was 0.970 ± 0.019 for the internal test set, 0.960 ± 0.035 for the external 1.5T dataset, and 0.958 ± 0.014 for the external 3T dataset. Figures 2-4 provide the distribution of Dice values and representative liver segmentation results on the internal and external test sets. Linear regression and Bland-Altman plots comparing T2* values measured by the FAPE and SAPE methods on three test sets are shown in Figure 5. There was a good correlation (internal test set: r = 0.9998, P < 0.001; 1.5T test set: r = 0.9988, P < 0.001; 3T test set: r = 0.9996, P < 0.001) between the liver T2* values measured by the two methods on the three test sets. The measured T2* values had a mean difference bias of 0.12 (95% CI: -0.37, 0.61) ms for the internal test set, 0.04 (95% CI: -1.0, 1.1) ms for the 1.5T test set, and 0.01 (95% CI: -0.25, 0.23) ms for the 3T test set. The CoV between the two methods were 4.2%, 4.8% and 2.0% on the internal and external test sets, respectively.Discussion
The proposed TransUNeSt network showed an excellent performance in the liver segmentation on not only internal test sets but also external test sets acquired using scanners with different field strength. This high generalization ability can be primarily attributed to the fact that we constructed the network on quantitative R2* maps, which are more reproducible between studies, scanners, and centers, compared with weighted MR images. Although R2* values vary with field strength, the R2* values on 3T are approximately twice of those on 1.5T for the same subject24. Thus, the generalization ability to scanners with varying field strength can be enhanced by using the data augmentation method that multiplies the input R2*map by different factors. Another advantage of R2* map-based network construction is that it is not affected by the nonuniform intensity bias field in MR images and varying TE samplings. The low CoV in T2* measurements between the proposed FAPE and SAPE methods indicates an excellent agreement between the two methods. The high agreement can be first attributed to the high performance in the liver segmentation as demonstrated by the Dice values. Note that the T2* values obtained by the two methods were also close even at the lowest Dice. The potential reason lies that the automatically segmented liver region was smaller than the manual segmentation, and this means only a reduced number of liver parenchyma pixels in the signal average for the final T2* measurement, without significant interference from non-parenchyma tissues.Conclusion
In conclusion, this work proposed a fully automatic method for the whole liver T2* measurement by incorporating a deep learning-based liver segmentation to the SAPE method. Experiments showed that the proposed method achieved an accurate liver segmentation and T2* measurement with a high generalization ability without manual interference.Acknowledgements
This work was supported by National Natural Science Foundation of China under Grant U21A6005, Key-Area Research and Development Program of Guangdong Province (2018B030340001, 2018B030333001).References
1. Alústiza J M, Castiella A, De Juan M D, et al. Iron overload in the liver diagnostic and quantification[J]. Eur J Radiol, 2007, 61(3): 499-506.
2. Angelucci E, Brittenham G M, Mclaren C E, et al. Hepatic iron concentration and total body iron stores in thalassemia major[J]. N Engl J Med, 2000, 343(5): 327-31.
3. Labranche R, Gilbert G, Cerny M, et al. Liver Iron Quantification with MR Imaging: A Primer for Radiologists[J]. Radiographics, 2018, 38(2): 392-412.
4. Zheng Q, Feng Y, Wei X, et al. Automated interventricular septum segmentation for black-blood myocardial T2* measurement in thalassemia[J]. J Magn Reson Imaging, 2015, 41(5): 1242-50.
5. St Pierre T G, Clark P R, Chua-Anusorn W. Single spin-echo proton transverse relaxometry of iron-loaded liver[J]. NMR Biomed, 2004, 17(7): 446-58.
6. Anderson L J, Holden S, Davis B, et al. Cardiovascular T2-star (T2*) magnetic resonance for the early diagnosis of myocardial iron overload[J]. Eur Heart J, 2001, 22(23): 2171-9.
7. Gandon Y, Olivie D, Guyader D, et al. Non-invasive assessment of hepatic iron stores by MRI[J]. Lancet, 2004, 363(9406): 357-362.
8. Wood J C, Enriquez C, Ghugre N, et al. MRI R2 and R2* mapping accurately estimates hepatic iron concentration in transfusion-dependent thalassemia and sickle cell disease patients[J]. Blood, 2005, 106(4): 1460-5.
9. Hankins J S, Mccarville M B, Loeffler R B, et al. R2* magnetic resonance imaging of the liver in patients with iron overload[J]. Blood, 2009, 113(20): 4853-5.
10. St Pierre T G, Clark P R, Chua-Anusorn W, et al. Noninvasive measurement and imaging of liver iron concentrations using proton magnetic resonance[J]. Blood, 2005, 105(2): 855-61.
11. Runge J H, Akkerman E M, Troelstra M A, et al. Comparison of clinical MRI liver iron content measurements using signal intensity ratios, R (2) and R (2)[J]. Abdom Radiol (NY), 2016, 41(11): 2123-2131.
12. Kirk P, He T, Anderson L J, et al. International reproducibility of single breathhold T2* MR for cardiac and liver iron assessment among five thalassemia centers[J]. J Magn Reson Imaging, 2010, 32(2): 315-9.
13. Marro K, Otto R, Kolokythas O, et al. A simulation-based comparison of two methods for determining relaxation rates from relaxometry images[J]. Magnetic Resonance Imaging, 2011, 29(4): 497-506.
14. Positano V, Salani B, Pepe A, et al. Improved. T2*assessment in liver iron overload by magnetic resonance imaging[J]. Magnetic Resonance Imaging, 2009, 27(2): 188-197.
15. Mccarville M B, Hillenbrand C M, Loeffler R B, et al. Comparison of whole liver and small region-of-interest measurements of MRI liver R2*in children with iron overload[J]. Pediatric Radiology, 2010, 40(8): 1360-1367.
16. Deng J, Rigsby C K, Schoeneman S, et al. A semiautomatic postprocessing of liver R2* measurement for assessment of liver iron overload[J]. Magn Reson Imaging, 2012, 30(6): 799-806.
17. Liu M, Vanguri R, Mutasa S, et al. Channel width optimized neural networks for liver and vessel segmentation in liver iron quantification[J]. Computers in Biology and Medicine, 2020, 122: 7.
18. Positano V, Meloni A, Santarelli M F, et al. Deep Learning Staging of Liver Iron Content From Multiecho MR Images[J]. J Magn Reson Imaging, 2022.
19. Feng Y, Feng M, Gao H, et al. A novel semiautomatic parenchyma extraction method for improved MRI R2* relaxometry of iron loaded liver[J]. J Magn Reson Imaging, 2014, 40(1): 67-78.
20. Wang C, Zhang X, Liu X, et al. Improved liver R2* mapping by pixel-wise curve fitting with adaptive neighborhood regularization[J]. Magn Reson Med, 2018, 80(2): 792-801.
21. Ronneberger O, Fischer P, Brox T. U-Net: Convolutional Networks for Biomedical Image Segmentation[C]. Medical Image Computing and Computer-Assisted Intervention – MICCAI 2015, 2015: 234-241.
22. Chen J, Lu Y, Yu Q, et al. TransUNet: Transformers Make Strong Encoders for Medical Image Segmentation[J]. CoRR, 2021, abs/2102.04306.
23. Zhang H, Wu C, Zhang Z, et al. ResNeSt: Split-Attention Networks[C]. 2022 IEEE/CVF Conference on Computer Vision and Pattern Recognition Workshops (CVPRW), 2022: 2735-2745.
24. Storey P, Thompson A A, Carqueville C L, et al. R2* imaging of transfusional iron burden at 3T and comparison with 1.5T[J]. J Magn Reson Imaging, 2007, 25(3): 540-7.
Figures