1642
mcLARO: Multi-Contrast Learned Acquisition and Reconstruction Optimization for simultaneous multi-contrast and multi-parametric mapping1Cornell University, New York, NY, United States, 2Weill Cornell Medicine, New York, NY, United States
Synopsis
Keywords: Quantitative Imaging, Multi-Contrast
We propose a unified framework for highly accelerated multi-contrast and multi-parametric imaging in a single scan. Our framework, named mcLARO, includes designing a novel multi-contrast pulse sequence, optimizing k-space sampling pattern and image reconstruction with a learning-based approach, and fitting T1, T2 T2* and QSM maps using the reconstructed multi-contrast images. mcLARO is compared with reference T1w, T2w, GRE, T1, T2, T2* and QSM mapping sequences and achieves comparable results.Introduction
Developing pulse sequences and image reconstruction techniques to acquire multiple contrasts simultaneously and fit multi-parametric maps can be used to reduce overall scan time for qualitative and quantitative MRI. In addition to conventional contrast-weighted images such as T1weighted (T1w) and T2weighted (T2w) images and quantitative parameters such as T1 and T2 maps, there has been an increasing interest in incorporating multi-echo GRadient Echo (GRE) to map T2* and quantitative susceptibility mapping (QSM) (1-3). In this work, we extend our prior work, learned acquisition and reconstruction optimization (LARO) (4,5) for QSM acceleration, to the multi-contrast and multi-parametric imaging, which includes developing a multi-contrast sequence, optimizing spatial-temporal k-space sampling pattern and building an unrolled image reconstruction network. The resulting method is named mcLARO: Multi-Contrast Learned Acquisition and Reconstruction Optimization.Method
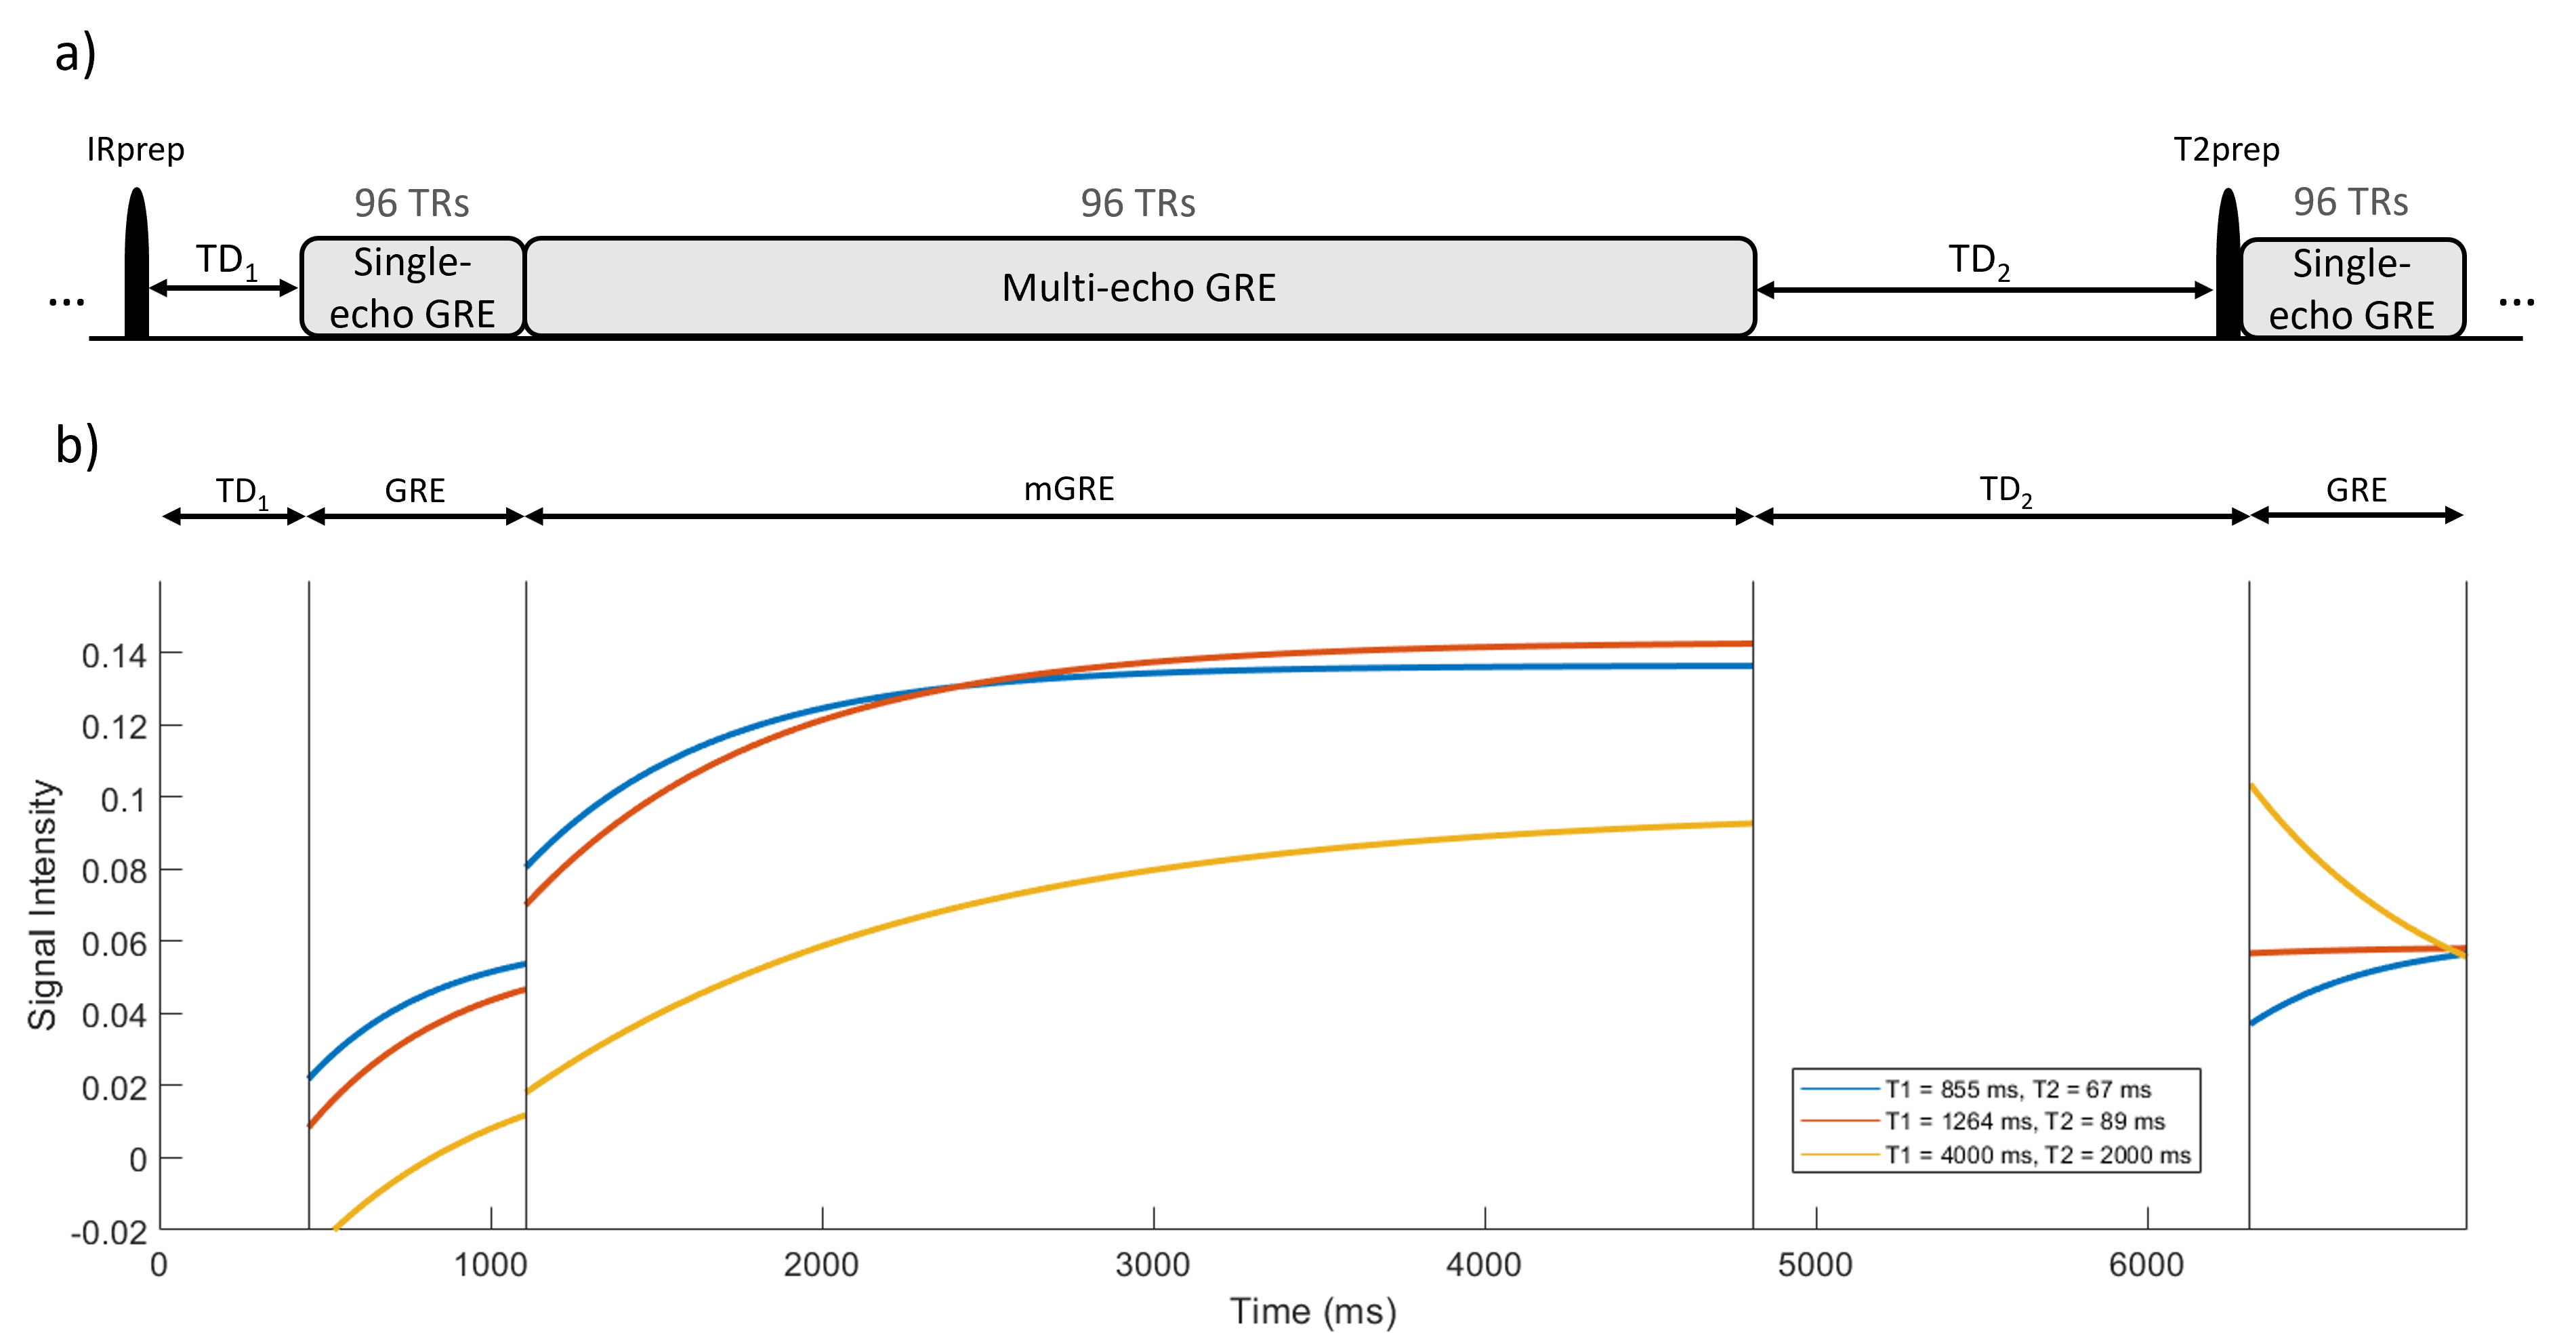
Pulse sequence:The proposed multi-contrast pulse sequence and the corresponding Bloch simulation of transverse signals are shown in Figure 1. Inspired by MP2RAGEME (1), each repetition starts with a non-selective (180º) inversion pulse followed by a wait time $$$TD_1$$$, a collection of single-echo ( $$$N_{T_1}$$$ TRs) and multi-echo ( $$$N_{MGRE}$$$ TRs, each $$$N_E$$$ echoes) GRE acquisitions, which acquire signals for T1w and QSM, respectively. Magnetization is then allowed to recover for a second wait time ( $$$TD_2$$$ ), followed by a T2 preparation (6) (82.5ms T2 decay time) pulse and a collection of single-echo GREs ( $$$N_{T_2}$$$ TRs) for T2w signal. Sequence parameters were: $$$N_{T_1}=N_{MGRE}=N_{T_2}=96, N_E=9, TD_1=450ms, TD_2=1500ms, TR_{T1}=TR_{T2}=7.1ms, TR_{MGRE}=39.4ms, TE_{T1}=TE_{T2}=2.5ms, TE_{1,MGRE}=2.5ms, \Delta TE_{MGRE}=4.03ms$$$,voxel size: $$$1\times1\times1 mm^3$$$, acquisition matrix: $$$256\times206\times160$$$, bandwidth (BW): $$$\pm 50 kHz$$$, flip angles (FAs) $$$FA_{T1}=FA_{T2}=8º$$$, and $$$FA_{MGRE}=12º$$$.
Network architecture:
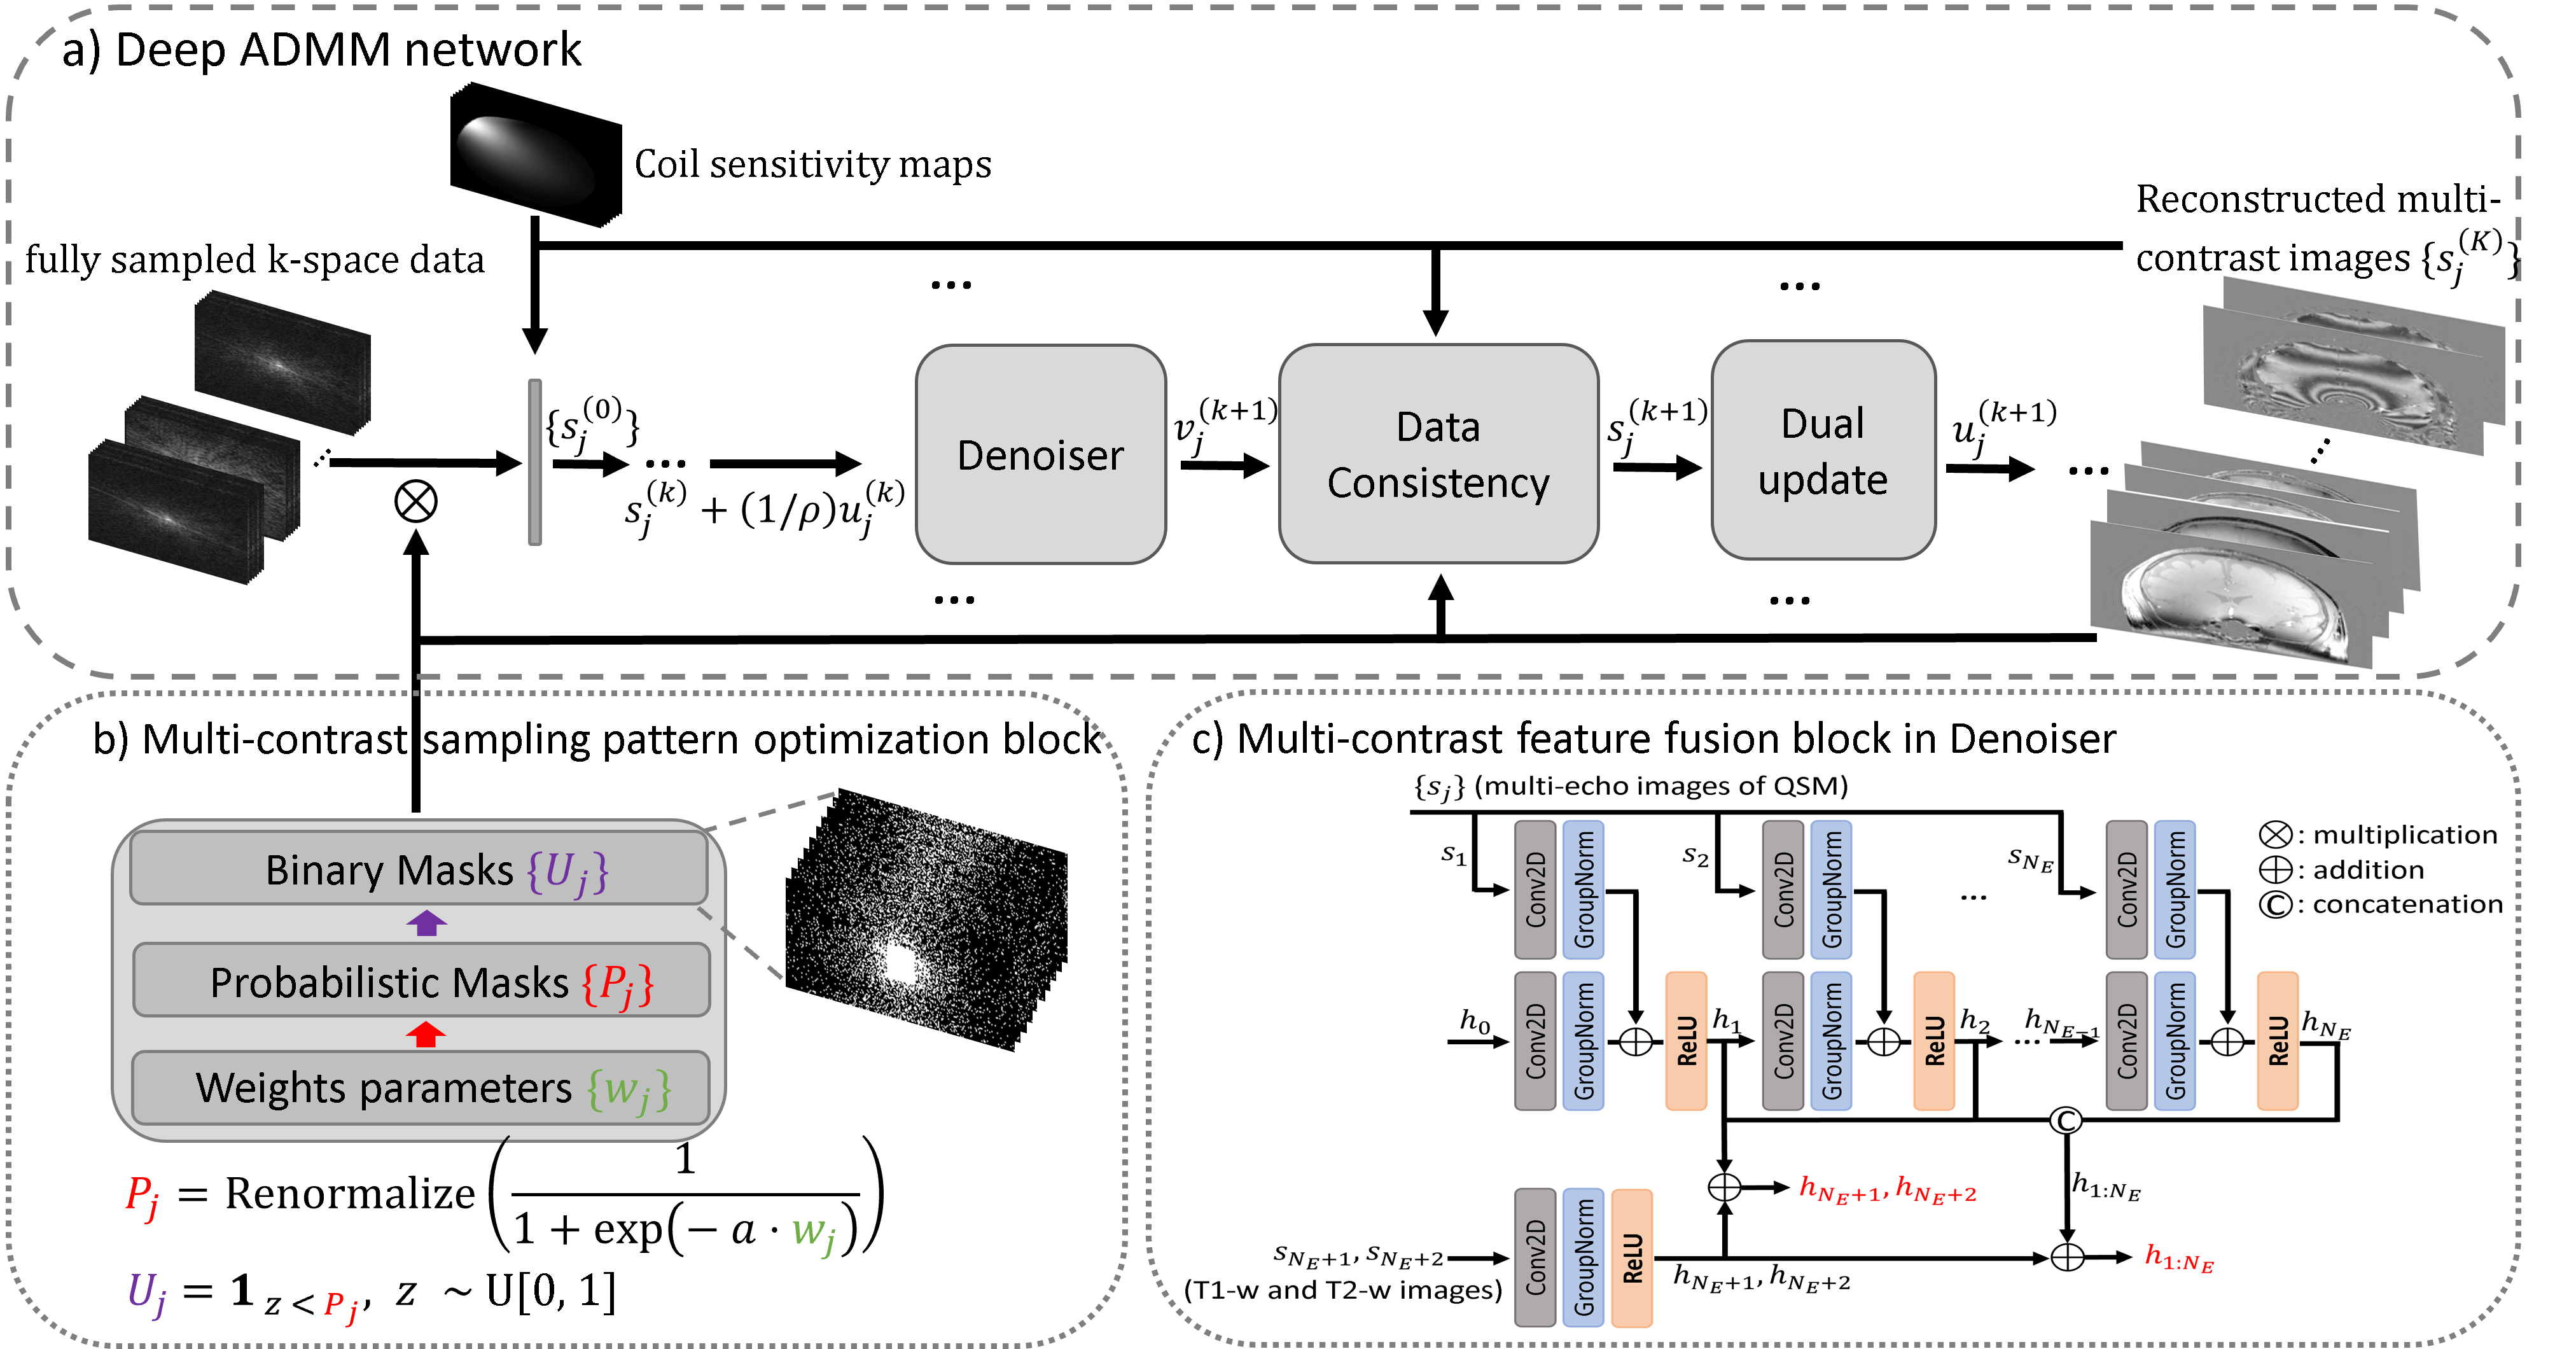
A sampling pattern optimization module in Figure 2b (4,5) is used to optimize an under-sampling pattern for each contrast. A deep ADMM network (Figure 2a) proposed in (5) is used for image reconstruction by unrolling an ADMM iterative scheme of multi-contrast images, where T1w, T2w, and multi-echo images of QSM are reconstructed together. A multi-contrast feature fusion module (Figure 2c) is proposed by extending a temporal feature fusion module in (5) to aggregate image features across contrasts and echoes during reconstruction.
Training details:
Fully sampled data were acquired on 10 healthy subjects. Coil compression (7) was applied to the original 32-coil k-space data, generating 8 virtual coils to save GPU memory. The coil sensitivity map of each echo and contrast was then estimated with ESPIRiT (8) using a centric 20×20×20 self-calibration k-space region. Fully sampled multi-contrast images were computed by combining multi-coil k-space data using the obtained coil sensitivity maps to provide labels for network training. Cross-validation was applied to train 5 networks, where each time a distinct 2 subjects were selected as test dataset and the remaining 8 subjects for training. During test, each subject was fed into the corresponding trained network to generate reconstructed multi-contrast images.
Prospective acquisition and comparison:
The learned under-sampling pattern was implemented into the proposed multi-contrast pulse sequence with a total scan time of 5:09 mins for a prospective acquisition. QSM was calculated through fitting total field map (9,10), removing background field (11) and solving ill-posed dipole inversion (12) from the reconstructed multi-echo GRE data. T2* was calculated by ARLO (13). T1 and T2 maps were calculated by dictionary matching, where a dictionary of 3-time-point transverse magnetization in the mcLARO sequence was simulated with T1 values (ms) in [100:10:2000] and T2 values (ms) in [10:1:200]. In QSM, mean susceptibility values and standard deviations in manually drawn region of interest ROIs including Globus pallidus (GP), Substantia Nigra (SN) and Red Nucleus (RN) were computed and compared. T1, T2 and T2* values of mcLARO in white (WM) and gray matter (GM) were compared with reference T1, T2 and T2* values.
Reference scans:
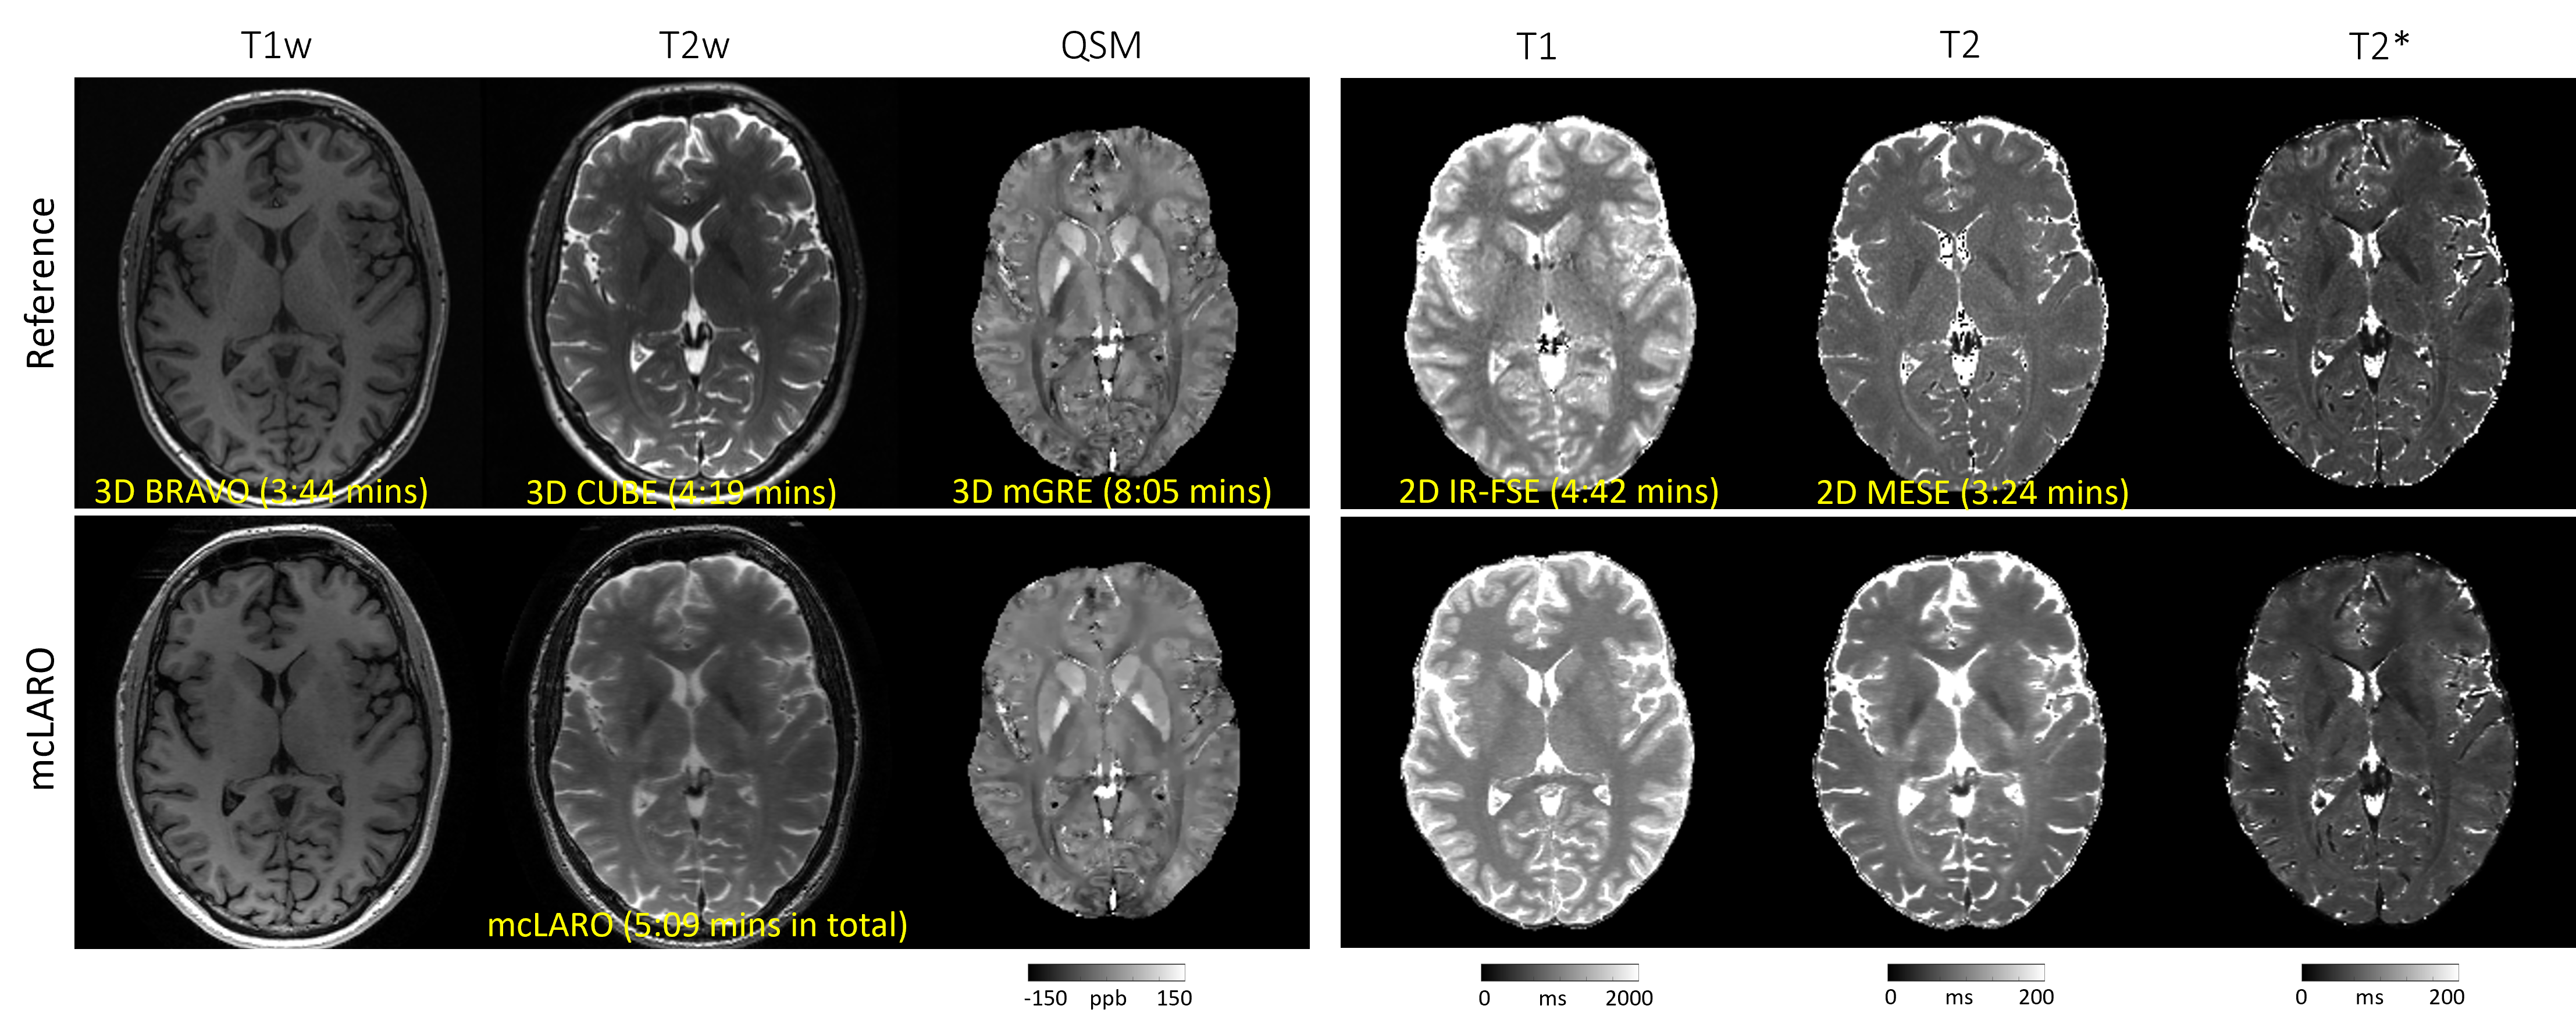
T1w: 3D MPRAGE (3D BRAVO, 3:44 mins).T2w imaging: 3D fast spin echo (3D CUBE, 4:19 mins).T2* and QSM: 3D multi-echo GRE (3D mGRE, 8:05 mins).T1 mapping: 2D inversion recovery fast spin echo (2D IR-FSE, single slice, 4:42 mins).T2 mapping: 2D multi-echo spin echo (2D MESE, single slice, 3:28 mins).
Results
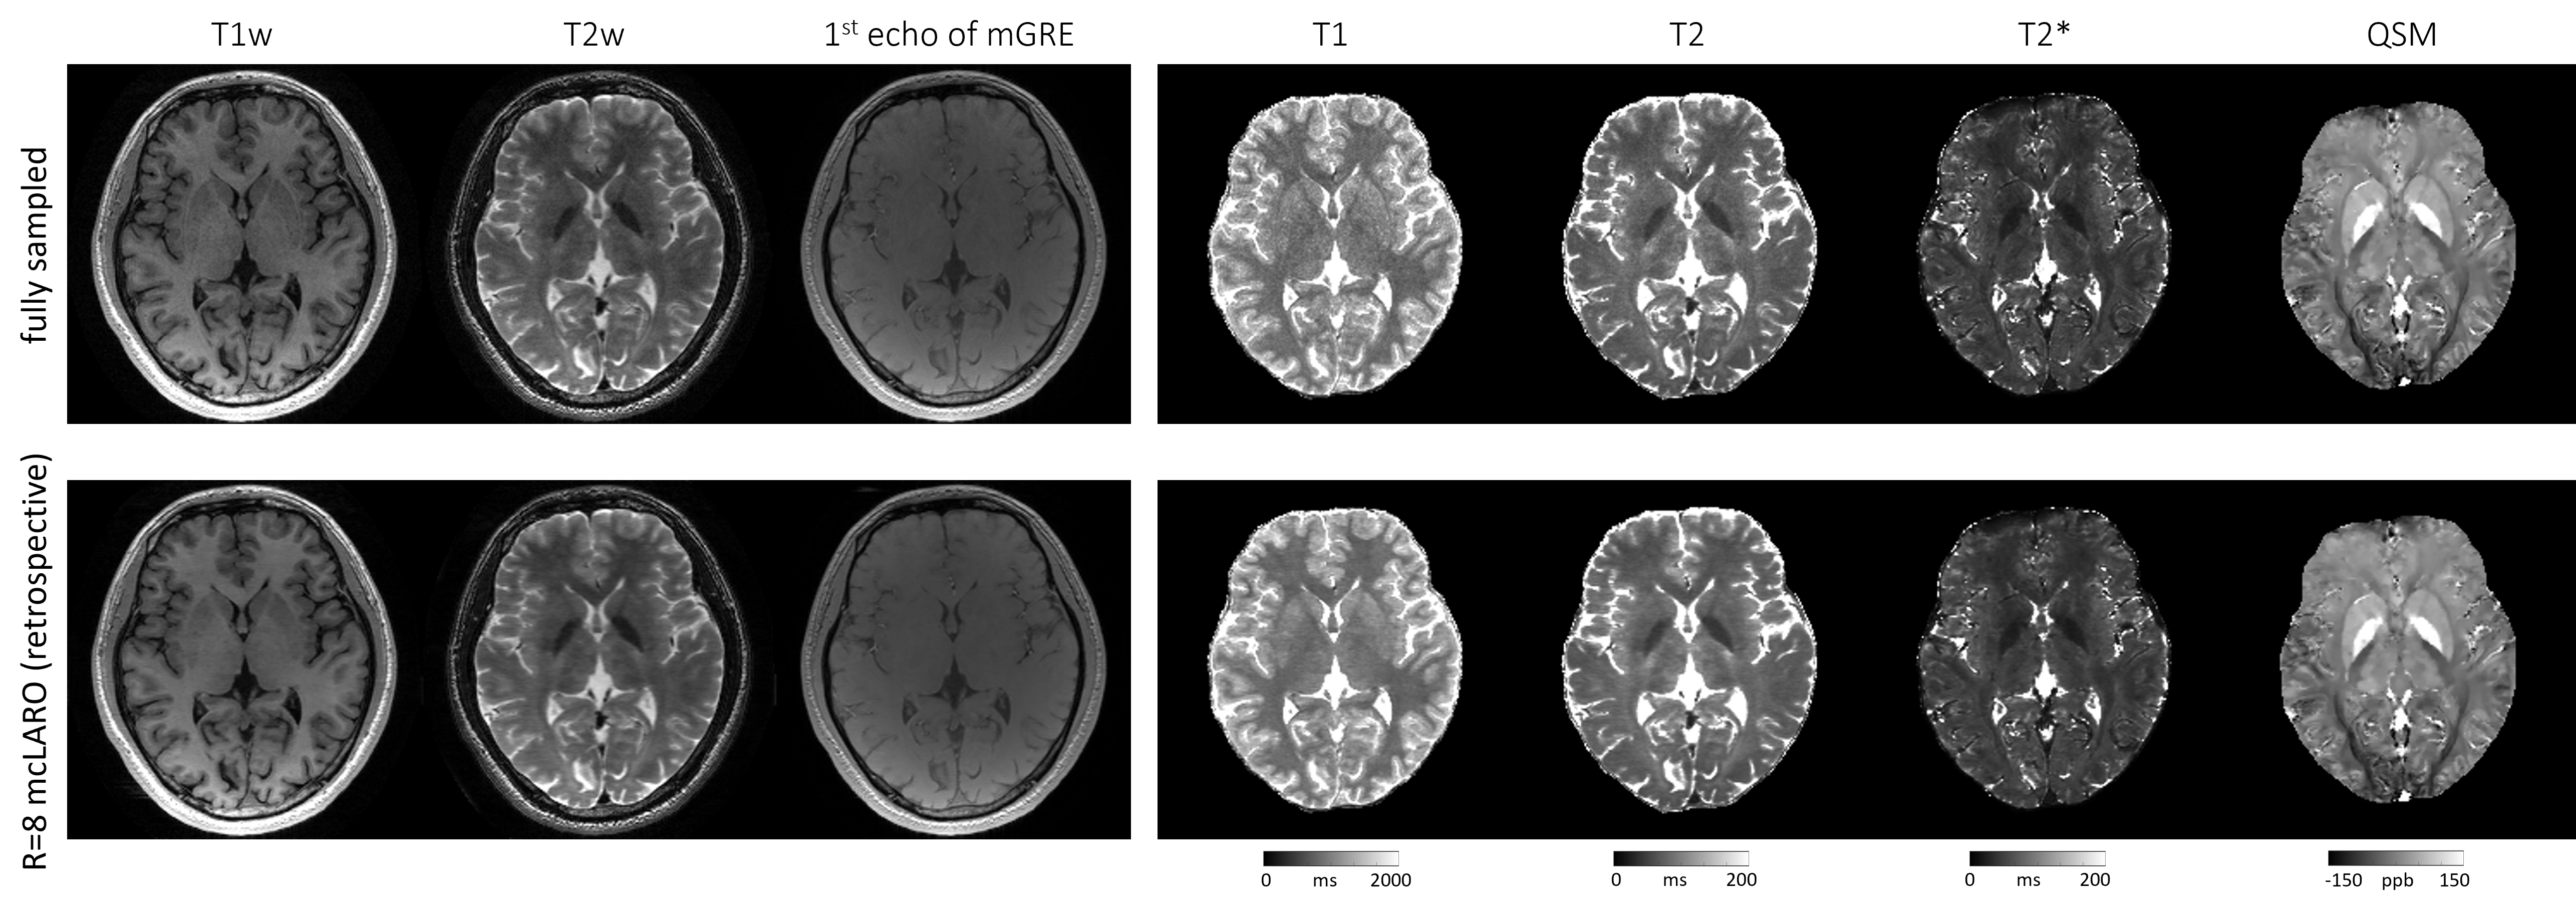
Retrospective under-sampling:Figure 3 shows fully sampled and retrospectively under-sampled mcLARO reconstructions and quantitative maps of one test subject. Under-sampled reconstructions of T1w and T2w images and T1 and T2 maps suppressed noise which was visible in the fully sampled images and maps. Comparable T2* and QSMs were observed between fully and under-sampled reconstructions.
Prospective under-sampling:
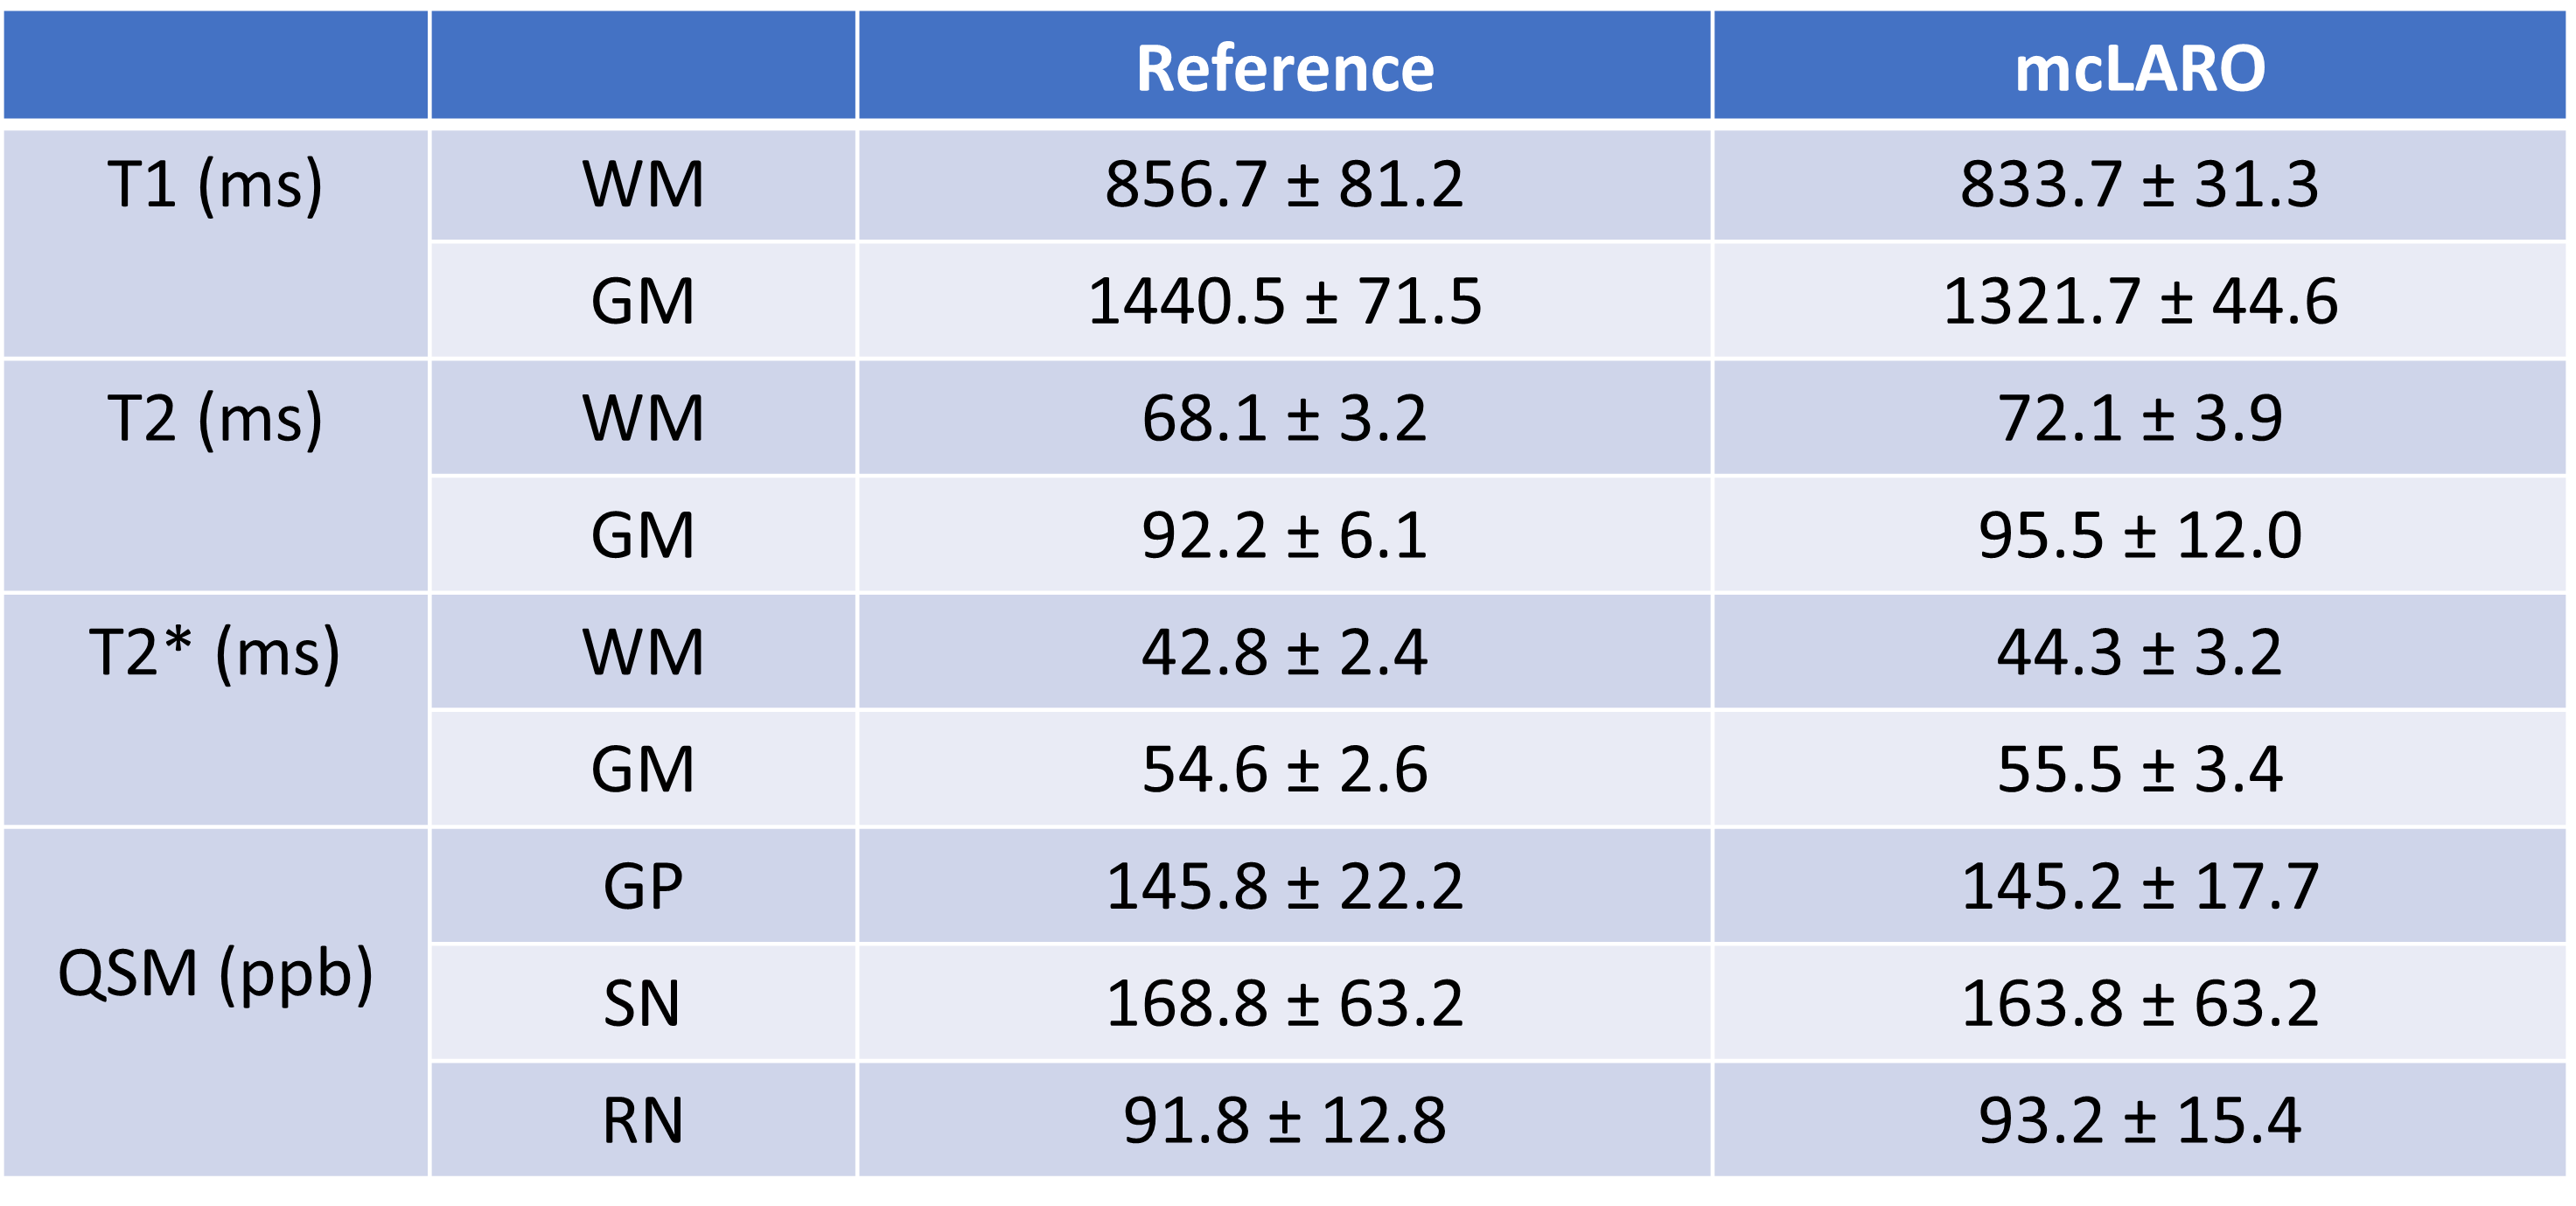
Figure 4 shows T1w, T2w, QSM, T1, T2 and T2* references (first row) and prospectively under-sampled mcLARO reconstructions and T1, T2, T2* and QSM (second row) of one test subject. Similar gray and white matter contrast were observed in both T1w images. The mcLARO T2w image was slightly blurrier than the reference T2w. Brighter white matter and darker cerebrospinal fluid were observed in mcLARO T2w image. ROI comparison of T1, T2, T2* and QSM is shown in Table 1. Similar ROI values between mcLARO and reference were achieved in all maps.
Conclusion
We proposed mcLARO as a new learning-based framework for fast whole brain isotropic T1w, T2w imaging and T1, T2, T2* and QSM mapping in a single scan. Compared to the reference scans, good image quality of T1w and QSM were achieved in mcLARO. Similar ROI values in all quantitative maps were also achieved.Acknowledgements
This work was supported by the NIH R01NS105144.References
1. Caan MW, Bazin PL, Marques JP, de Hollander G, Dumoulin SO, van der Zwaag W. MP2RAGEME: T1, T2*, and QSM mapping in one sequence at 7 tesla. Human brain mapping 2019;40(6):1786-1798.
2. Cao T, Ma S, Wang N, Gharabaghi S, Xie Y, Fan Z, Hogg E, Wu C, Han F, Tagliati M. Three‐dimensional simultaneous brain mapping of T1, T2, and magnetic susceptibility with MR Multitasking. Magnetic Resonance in Medicine 2022;87(3):1375-1389.
3. Wang F, Dong Z, Reese TG, Bilgic B, Katherine Manhard M, Chen J, Polimeni JR, Wald LL, Setsompop K. Echo planar time‐resolved imaging (EPTI). Magnetic resonance in medicine 2019;81(6):3599-3615.
4. Zhang J, Spincemaille P, Zhang H, Nguyen TD, Li C, Li J, Kovanlikaya I, Sabuncu MR, Wang Y. LARO: Learned Acquisition and Reconstruction Optimization to accelerate Quantitative Susceptibility Mapping. arXiv preprint arXiv:221100725 2022.
5. Zhang J, Zhang H, Li C, Spincemaille P, Sabuncu M, Nguyen TD, Wang Y. Temporal Feature Fusion with Sampling Pattern Optimization for Multi-echo Gradient Echo Acquisition and Image Reconstruction. 2021. Springer. p 232-242.
6. Brittain JH, Hu BS, Wright GA, Meyer CH, Macovski A, Nishimura DG. Coronary angiography with magnetization‐prepared T2 contrast. Magnetic resonance in medicine 1995;33(5):689-696.
7. Zhang T, Pauly JM, Vasanawala SS, Lustig M. Coil compression for accelerated imaging with Cartesian sampling. Magnetic resonance in medicine 2013;69(2):571-582.
8. Uecker M, Lai P, Murphy MJ, Virtue P, Elad M, Pauly JM, Vasanawala SS, Lustig M. ESPIRiT—an eigenvalue approach to autocalibrating parallel MRI: where SENSE meets GRAPPA. Magnetic resonance in medicine 2014;71(3):990-1001.
9. Kressler B, De Rochefort L, Liu T, Spincemaille P, Jiang Q, Wang Y. Nonlinear regularization for per voxel estimation of magnetic susceptibility distributions from MRI field maps. IEEE transactions on medical imaging 2009;29(2):273-281.
10. Liu T, Wisnieff C, Lou M, Chen W, Spincemaille P, Wang Y. Nonlinear formulation of the magnetic field to source relationship for robust quantitative susceptibility mapping. Magnetic resonance in medicine 2013;69(2):467-476.
11. Liu T, Khalidov I, de Rochefort L, Spincemaille P, Liu J, Tsiouris AJ, Wang Y. A novel background field removal method for MRI using projection onto dipole fields. NMR in Biomedicine 2011;24(9):1129-1136.
12. Liu J, Liu T, de Rochefort L, Ledoux J, Khalidov I, Chen W, Tsiouris AJ, Wisnieff C, Spincemaille P, Prince MR. Morphology enabled dipole inversion for quantitative susceptibility mapping using structural consistency between the magnitude image and the susceptibility map. Neuroimage 2012;59(3):2560-2568.
13. Pei M, Nguyen TD, Thimmappa ND, Salustri C, Dong F, Cooper MA, Li J, Prince MR, Wang Y. Algorithm for fast monoexponential fitting based on auto‐regression on linear operations (ARLO) of data. Magnetic resonance in medicine 2015;73(2):843-850.
Figures