1640
Optimized Single-Shot EPI Sequence for Abdominal T2 Quantification: Comparison with CPMG Based Technique
Fei Han1, Ute Goerke2, Maria Altbach3, and Vibhas Deshpande4
1Siemens Medical Solutions, USA, Los Angeles, CA, United States, 2Siemens Medical Solutions, USA, Tucson, AZ, United States, 3University of Arizona, Tucson, AZ, United States, 4Siemens Medical Solutions, USA, Austin, TX, United States
1Siemens Medical Solutions, USA, Los Angeles, CA, United States, 2Siemens Medical Solutions, USA, Tucson, AZ, United States, 3University of Arizona, Tucson, AZ, United States, 4Siemens Medical Solutions, USA, Austin, TX, United States
Synopsis
Keywords: Quantitative Imaging, Liver
Conventional CPMG-based T2 quantitative approaches are often based on prolonged scan and complicated signal modeling, with multiple confounders that affects the T2 accuracy. In this work, we explore an alternative T2 quantitative strategy utilizing the Single-Shot EPI (SS-EPI) sequence. Phantom and in-vivo abdominal imaging results shows that despite the inferior spatial resolution, the SS-EPI could provide descent image quality and reliable T2 maps from a faster scan. Common confounders in the CPMG based approach seems not affecting the T2 values from the SS-EPI. The SS-EPI is an attractive alternative approach for T2 quantification for the abdomen and beyond.Introduction
T2 relaxation time is a potentially valuable biomarker for various diagnosis and tissue characterization applications, including liver fibrosis staging, liver iron concentration estimation, diagnosing polycystic kidney diseases and characterizing prostate tissue1. It is also an important alternative when contrast agent cannot be used for certain patient population. Most conventional T2 quantification is based on the CPMG sequence. For example, the Multi-echo Spin-echo offers high-resolution T2 images and maps in a reasonable scan time. The recently developed Radial TSE(RadTSE) technique2-3 further offers motion robust and faster data acquisition with the use of non-Cartesian sampling and view-sharing reconstruction, particularly suited for abdominal imaging applications. The signal in the CPMG sequence is modulated by the contribution of stimulated and secondary echoes. Although advanced signal models4 could be applied to address this concern, they often introduce additional confounders like the refocusing flip-angle (RFA), pulse profile, and field inhomogeneity, which potentially affect the T2 quantification. In this work, we explore and evaluate an alternative strategy - spin-echo single-shot EPI (SS-EPI). Phantom and In-vivo experiments were designed to compare the optimized SS-EPI sequence with the RadTSE, which representing the state-of-art CPMG approach.Methods
Scans were performed on a multi-vial phantom with different T2 values and on 6 healthy volunteers. In addition to the traditional phantom experiment, the vials were also attached to the chest of the volunteer as T2 reference. The basic spin-echo sequence was used to estimate the phantom T2 values as the ground truth. The SS-EPI was modified to allow multiple user-defined TE values within a same scan. Six shots were acquired with TE=28,35,45,60,80,130ms, TR=2500ms. The 15s scan covers eight slices. GRAPPA-2X and 5/8 partial Fourier were used to achieve small TE. Pixel size is 2.8x2.8x5mm. A prototype RadTSE sequence3 is used with turbo-factor of 32, radial views of 256 and pixel size of 1.3x1.3x5mm. The two sequences were repeated with different refocusing flip-angles and RF pulse types. Mono-exponential models were used for SS-EPI data and dictionary-based slice-resolved EPG model was used for RadTSE data to generate the T2 maps. Both models were implemented so that the T2maps are generated on the scanner.Results
Fig.1 compares the T2 from the two sequences against the ground-truth value. The SS-EPI gives accurate T2 estimations in different flip-angle and RF pulse configurations. The RadTSE T2 correlates well with the ground-truth. As expected, the flip-angle and pulse type are confounders for the T2 although they are included in the sEPG model. Fig.2 shows the example T2 images and T2 maps. We can appreciate the image quality of the SS-EPI although it is acquired with inferior spatial resolution.Fig.3 shows that the T2 estimated using fewer number of echoes from SS-EPI remain comparable with the one using all echoes. The visual differences of the T2 maps are only visible at high T2 values or in the extreme case of two echoes.
In the case presented in Fig.4, part of the subcutaneous fat is not fully suppressed, possibly due to imperfect B1/B0 field. This imperfection, although not obvious in the RadTSE T2 weighted images, translate into elevated T2 values in part of the liver. It indicates that the B1/B0 is another confounder in RadTSE T2 modeling. The SS-EPI although has similar unsuppressed fat signal, the imperfection does not cause noticeable variations in liver T2.
Discussion
The RadTSE offers superior image quality with better defined anatomical details and less motion and distortion artifacts in both T2 images T2 maps. However, the data acquisition takes longer time, and the sophisticated reconstruction and modeling may introduce additional confounders that affects the T2 quantifications. The SS-EPI acquisition is a faster sequence with simple signal models. Therefore, its T2 seems not to be affected the common confounder in the CPMG based approach. The two techniques can be suited for different applications with different technical requirements. For example, in tissue characterization for diffused liver diseases where spatial resolution is not critical, the SS-EPI could be applied to get quick and reliable T2 quantifications of the liver. On the other hand, the RadTSE may be suitable for characterizing liver and prostate tumors in high spatial resolution or where the underlying anatomy is susceptible to distortion.The SS-EPI protocol used in this study acquire 6 echoes ranges from 28ms to 130ms. Our data indicates that it can be further optimized by reducing the number of echoes and shifting more echoes towards higher TE values. Furthermore, the SS-EPI can also benefit from many recent technical advances, including the SMS, deep-learning recon and motion compensation.
Conclusion
The SS-EPI is an attractive alternative approach for abdominal T2 quantification, with the advantage of faster scan, simple modeling and the potential for more accurate and reproducible T2 maps.Acknowledgements
The development of the radial TSE method has been supported in part by NIH grant CA245920References
1.Draveny R, Ambarki K, Han F, Hilbert T, Laurent V, Morel O, Bertholdt C, Beaumont M. Comparison of T2 Quantification Strategies in the Abdominal-Pelvic Region for Clinical Use. Invest Radiol. 2022 Jun 1;57(6):412-421.
2.Altbach MI, Outwater EK, Trouard TP, et al. Radial fast spin-echo method for T2-weighted imaging and T2 mapping of the liver. J. Magn. Reson. Imaging. 2002;16(2):179 189.
3.Han F and Deshpande V. Accelerated Radial Turbo-Spin-Echo Sequence for Free-Breathing Abdominal T2 Mapping. Abstract #2117, ISMRM 2021
4.Lebel RM, Wilman AH. Transverse relaxometry with stimulated echo compensation. Magn. Reson. Med. 2010;64(4):1005 1014.
Figures
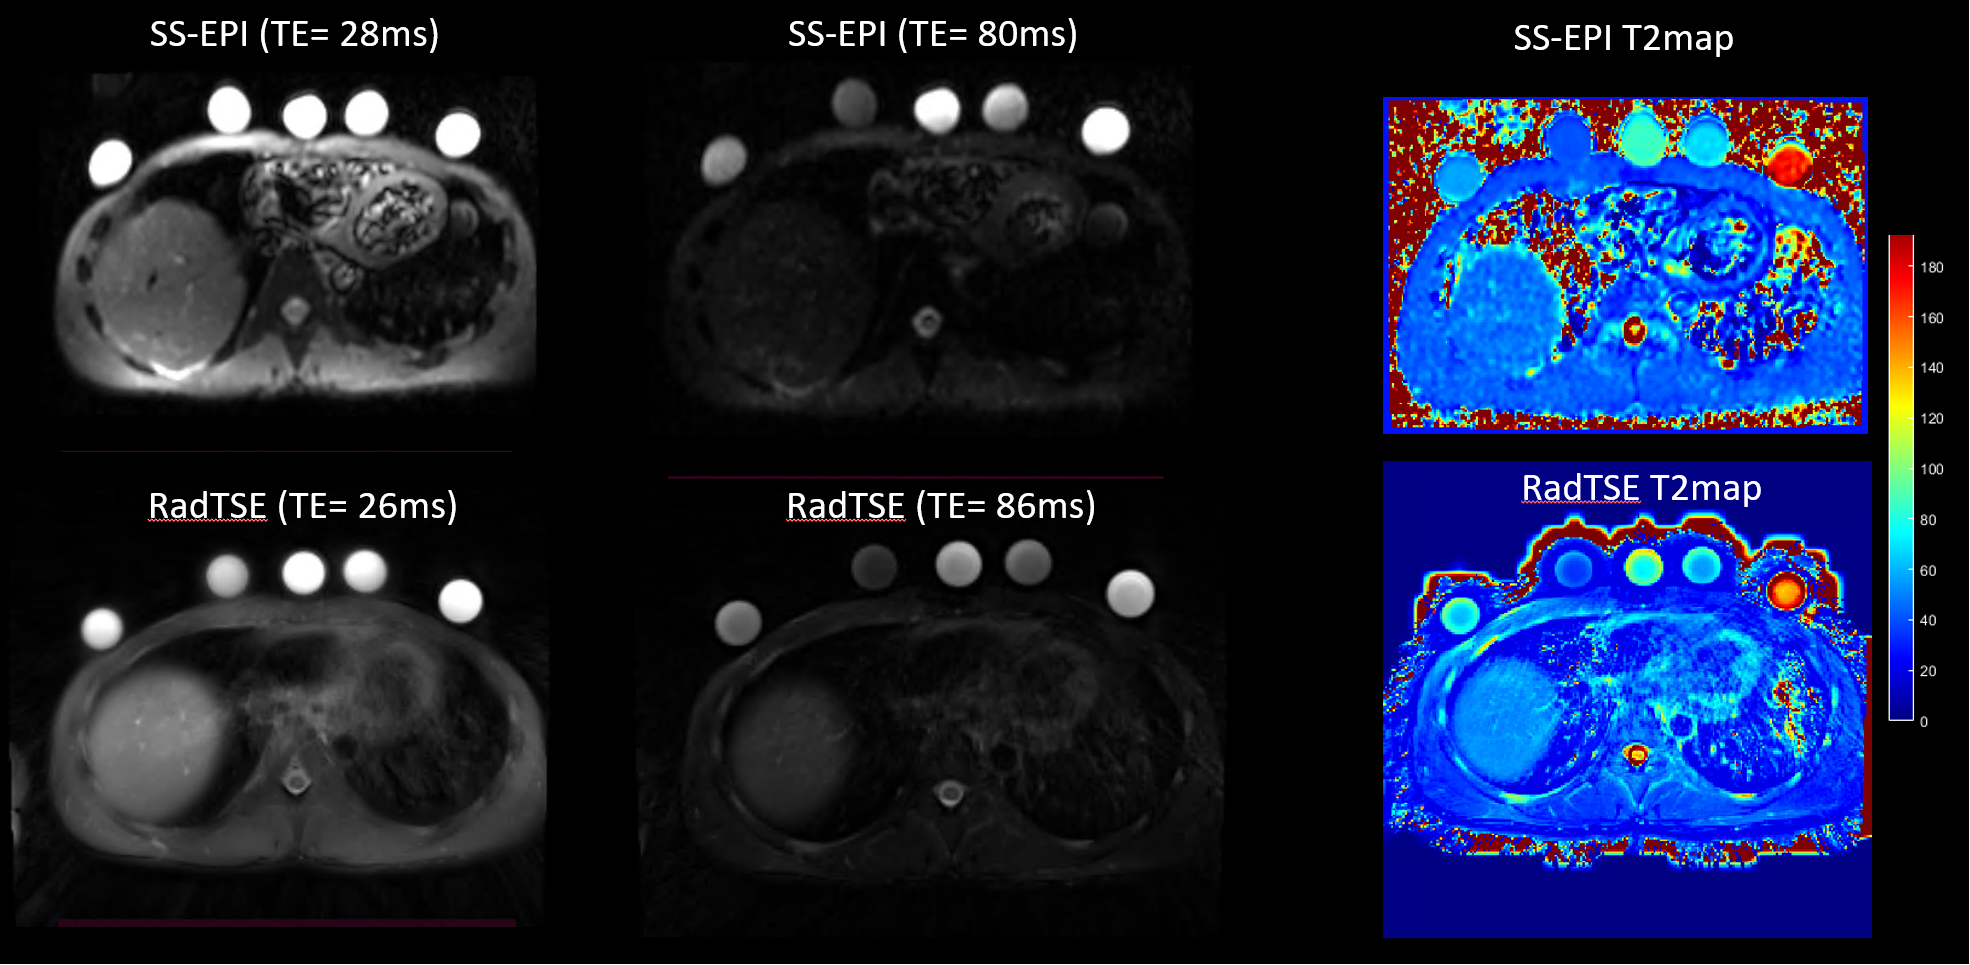
Fig.1 T2 estimates based on SS-EPI match well with the ground-truth over a range of T2 and different RF pulse configurations.
The high T2 value is slightly under-estimated possibly due to the lack of echoes with
high TE. The T2 estimates based on RadTSE correlates well with the
ground-truth. The RF pulse and refocusing flip-angle seems to be confounders of the T2 quantification in RadTSE.
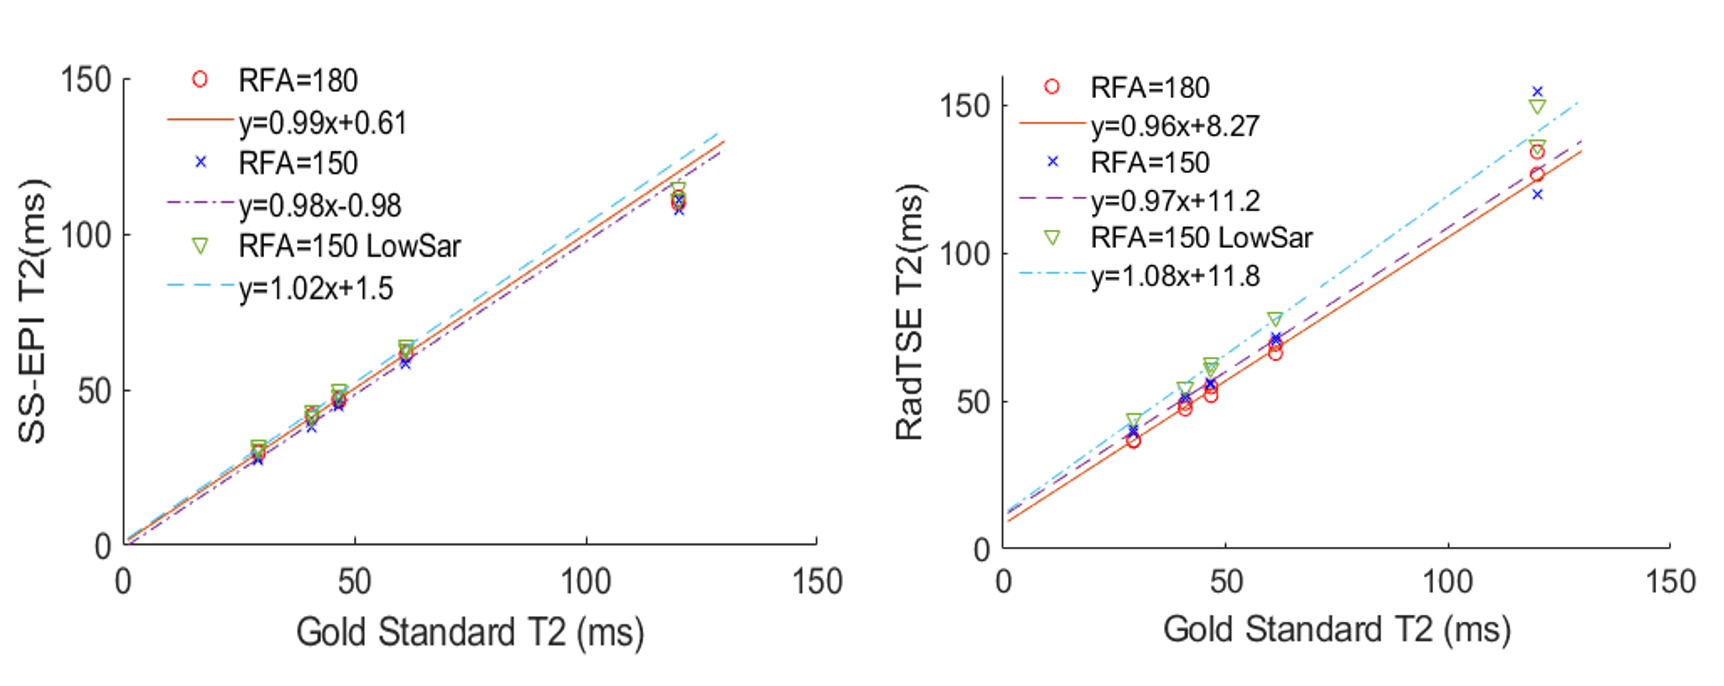
Fig.2 T2 images and T2 maps from SS-EPI and
RadTSE, both have good image quality although the SS-EPI is acquired
with much inferior spatial resolution. Some image distortion is found in the
SS-EPI images especially in the region of the vials attached to the subject.
The T2 maps of the phantom vials in the RadTSE T2 maps is not as uniform as the
one from SS-EPI, possibly due to the use of k-space view-sharing reconstruction.
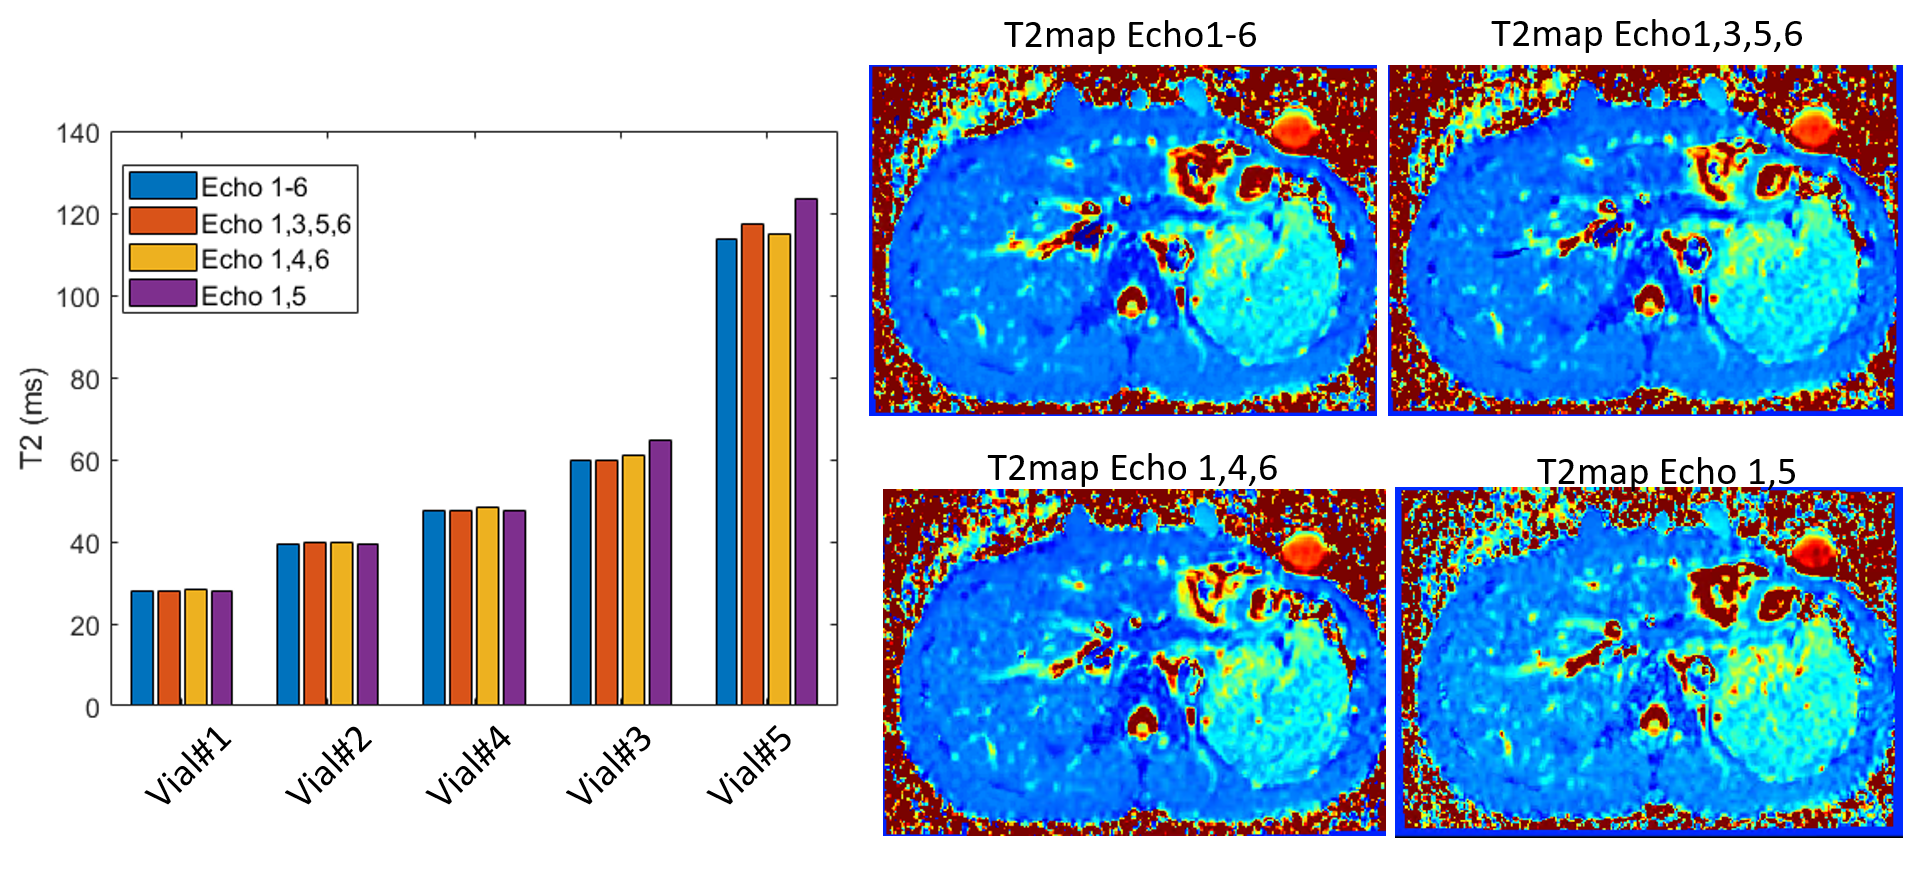
Fig.3 The estimated
T2 values remain stable even if fewer echoes were used. The T2 maps only
shows noticeable visual difference in regions with high T2 values and in case
with only 2 echoes. It demonstrates the potential to further shorten the data
acquisition without much loss in the T2 quantification performance.
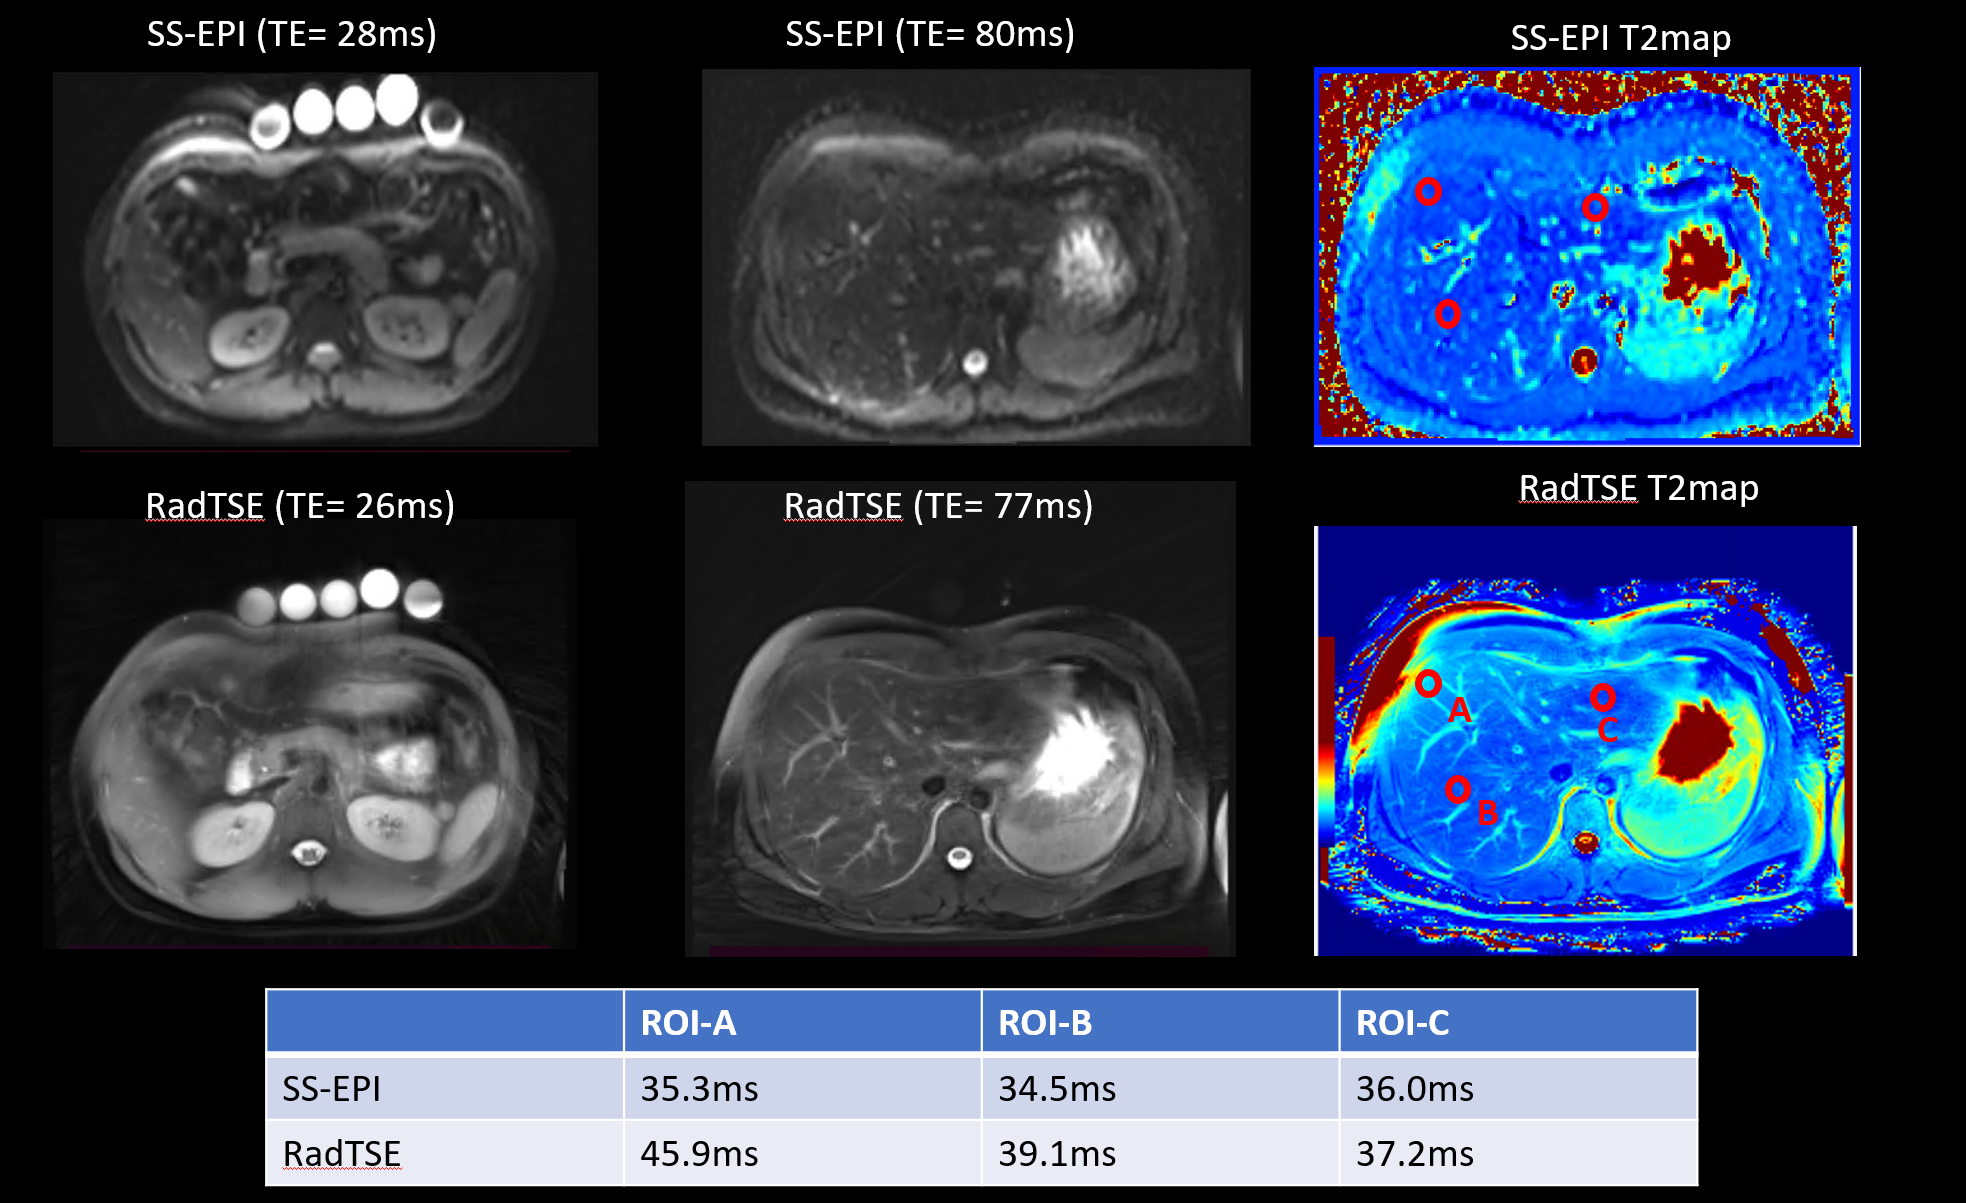
Fig.4 The T2
weighted images and T2 maps using SS-EPI and RadTSE on a healthy volunteer. The
possible B0 or B1 imperfection (indicated as non-suppressed subcutaneous fat)
translate into elevated T2 values of adjacent liver tissue in RadTSE T2 maps.
The liver T2 values in the SS-EPI remains stable across the three ROIS taken in
different portion of the liver.
DOI: https://doi.org/10.58530/2023/1640